by Greg Harmon
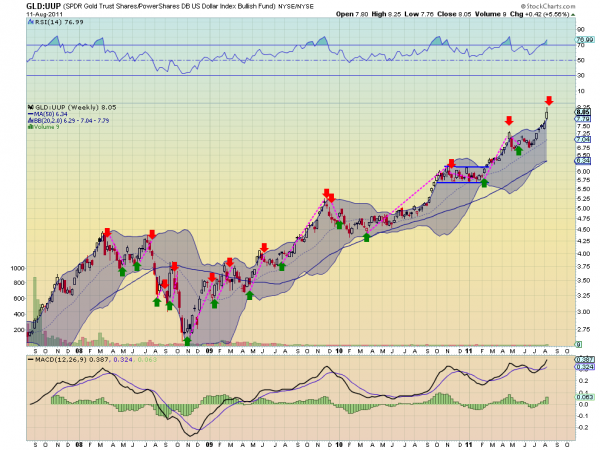
The US Dollar Index has been mired in a broad range between 73.50 and 76 for over 3 months. Looking at the chart of index itself does not show much to give a member of the Treasury Department any joy. Just more of the same. But the US Dollar Index ($UUP) measured against Gold ($GLD) and against US Treasuries ($TLT) is showing some signs of strength. From the ratio chart below of $GLD against $UUP on a weekly basis Gold is close to flashing a sell signal against the US Dollar that has been accurate for the last 4 years. Whenever the ratio breaks the upper

Bollinger band and the Relative Strength Index starts to fall after exceeding 70, it falls back to at least the mid line of the Bollinger bands. Next week could be the trigger.
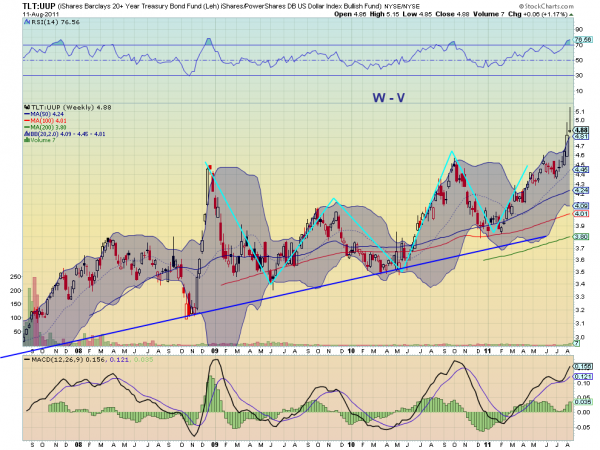
From the weekly ratio chart of $TLT against $UUP the ‘W-V’ pattern has completed but now the it is the last two candles that draw attention to this pair. Both of these candles are out of the Bollinger bands and both have very long upper shadows, topping tails. If the weekly candle finishes here or

lower then it will print a shooting star. This is a possible reversal candle, but needs to be confirmed next week as well. The RSI on this pair is also into overbought territory, adding to the possibility of a pullback.
This US Dollar strength is important to watch to see if it expands to the point of creating early signs of weakness in Gold or Treasuries. A crack in Gold or Treasuries could confirm a bottom in the S&P 500 ($SPY) as noted in the article below on the correlation between $SPY and $TLT. Keep an eye in this space.
No comments:
Post a Comment