by
It has taken years of trading and research to come to the conclusion that Corn is the Rosetta Stone to the Financial World. Whether you are interested in the forecast for inflation, fuel costs or sovereign value or the trade off between real and paper assets, the answer can be found in Corn. To understand this you first need to shift your thinking from the view that Corn is something you eat a few months in the Summer with butter and salt on it. Start by thinking of Corn as Gold, but with a use.
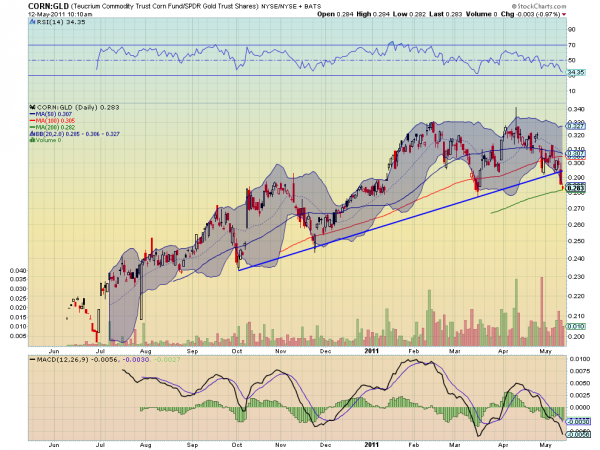
Looking at the ratio of the Corn ETF, Teucrium Commodity Trust Corn Fund (ticker: $CORN) to the SPDR Gold Trust Shares (ticker: $GLD) above you can see the steady rise of the trend since October. It is outpacing Gold has been store of value. Not a surprise as it has real uses. Both reflect a rise in the value of real goods. But Gold also is seen as a safe haven for foreign market debt crises. Now the ratio is breaking lower. Should this continue does it forecasts that the need to own real assets is waning. Or is this just an inflation related rotation while Gold rises on global fear?
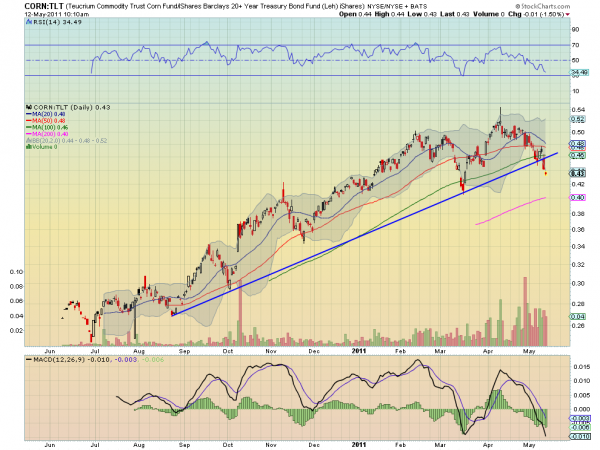
In the ratio of CORN to the iShares Barclays 20+ Year Treasury Bond Fund (ticker: $TLT) it can be seen that this ratio had been rising steadily. But now that US Treasuries are strengthening it has broken the trend line and risks heading much lower. So yes there is some information about lower inflation expectations in Corn prices.
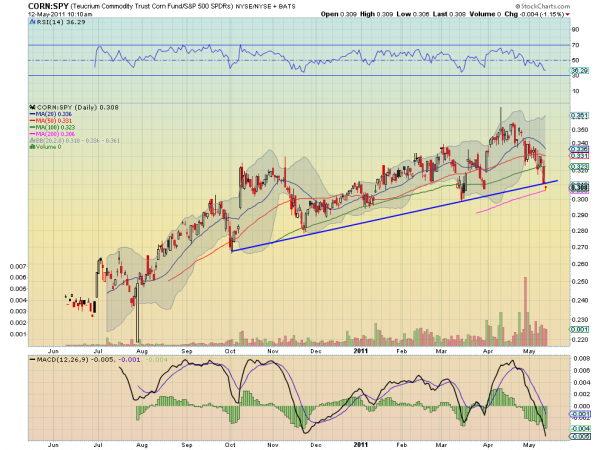
The ratio of CORN to the S&P 500 SPDR (ticker: $SPY) shows that the trend has been for real assets over paper assets but that it is being tested. Should the trend line be broken and the ratio continue lower then it would signal a shift back to paper assets.
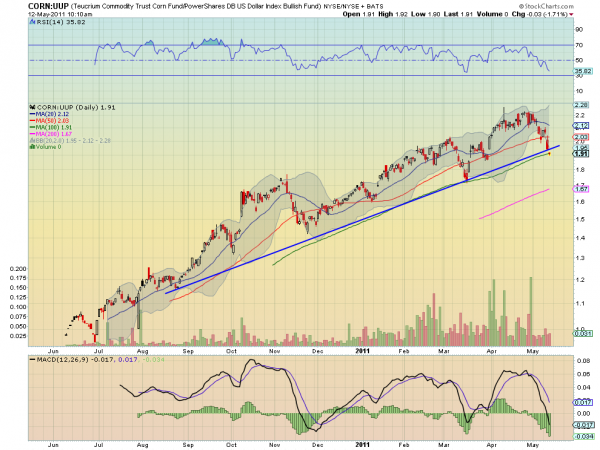
Studying the ratio of CORN to the Power Shares DB US Dollar Index Bullish Fund (ticker: $UUP) shows that Corn has been rising at the expense of the US Dollar as well, so it has been predicting devaluation to continue. But this trend is also being tested. Should it break and continue lower it would also suggest that devaluation of the Dollar is reversing.
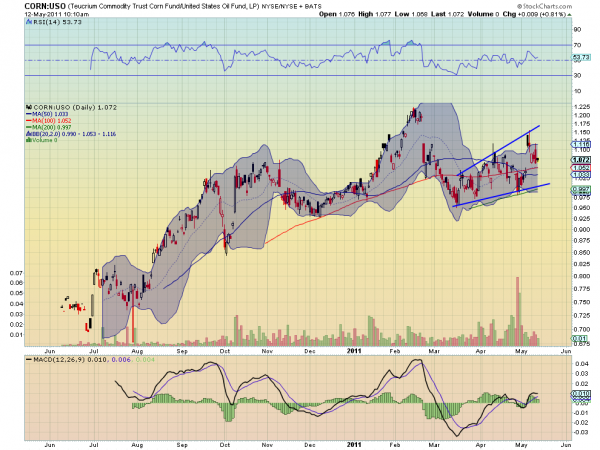
Finally the ratio of CORN to the United States Oil Fund (ticker: $USO) shows that CORN price growth has been outpacing the cost of Oil outside of a set back in March. Now it is slowly trending higher again in a rising expanding wedge pattern. There is no talk of peak Corn so what does this mean? A reflection that from a fuel perspective it is holding value better than Oil. Does this suggest that Corn is the future fuel?
Corn is at a critical juncture. It is at a inflection point in the choice between real and paper assets, the growth of inflation, the devaluation of the Dollar and the future of energy usage in this country. Do you still need to be convinced that it is not just a Summer treat? Continue to watch these ratios as they will give a great forecast of the future of the economy and the markets. As these trends breakdown they will be leading indicators.
No comments:
Post a Comment