Ben Bernanke gave testimony to committees of each house of Congress last week, and reiterated that the Fed’s long term goal is for an inflation rate of 2%. Saying it another way, Bernanke hopes to confiscate 2% of the value of your money every year. But we digress.
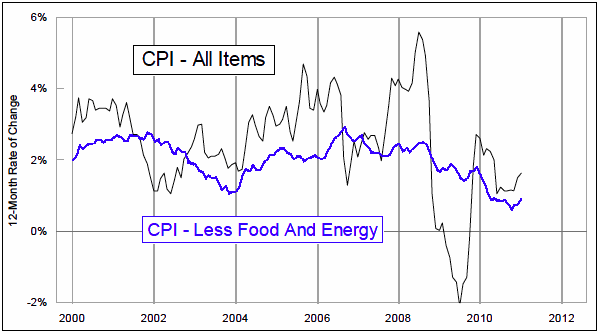
If you look at the most recent data for the Consumer Price Index (CPI), then the inflation rate for “all items” is getting close to that 2% number. But the “core” rate, which excludes food and energy, is up only 0.9% from a year ago, which leads the Fed’s thinkers to conclude that there is still room for their easy money policy.

In calculating the CPI, food and beverages only account for 14.8% of the weighting, and “motor fuel” is only 5.1% (information from bls.gov). So taking them out does not really gut the whole index. But what it does do is overweight other things in the calculations, things like housing which is 41.5% of CPI.
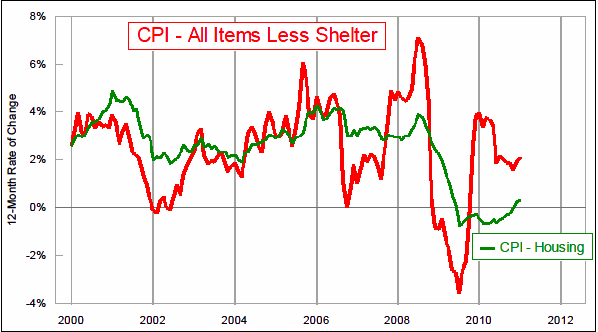
Not many people know that the BLS produces a whole variety of permutations of CPI, including or excluding this or that, plus regional versions. A couple of the more interesting ones are shown in the middle chart, and we never hear people talking about these. The “all items less shelter” series takes out housing, thereby giving greater weight to food, energy, medical care, apparel, etc. It is at a 2.1% growth rate already. The CPI-Housing series, on the other hand, is still near zero, thanks to the continued excess supply following the housing market collapse that is keeping prices down. So whereas some economists do not want to get confused by one-time events like Libya and Egypt that affect oil prices, they are happy to allow artificially low housing prices to remain in the data, and lead everyone to believe that inflation is not a problem.

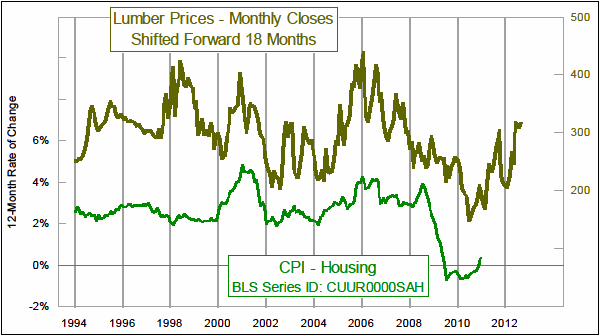
Based on our research, inflation is getting ready to be a much bigger problem than Fed officials may realize. The bottom chart looks at the CPI-Housing inflation rate, and we also include the plot of lumber prices in this chart. The lumber data are shifted forward by 18 months to reveal how the housing portion of the CPI tends to echo the movements of lumber prices.

The past two years have seen a big rebound in lumber prices from their all-time low in January 2009. The CPI-Housing inflation rate is just getting started on replicating that price climb, and has several months of upward movement ahead. Remember that housing prices make up 41.5% of the calculation of the CPI, so any significant rise will have a huge effect on the headline inflation numbers. We do not believe that Bernanke gets this concept, based on the public statements he has made. He still seems to believe that he has time remaining before he needs to act to prevent inflation, when in reality there is already a good dose of inflation that is in the pipeline and getting ready to reveal itself.
No comments:
Post a Comment