Monday, March 24, 2014

Gold Golden Cross Is Not Always a Positive Indicator

By: Bob_Kirtley

An exciting major event is about to occur in the precious metals arena this very week and you will no doubt see many references to it and that is formation of Golden Cross. Gold bugs including me will be looking for this event to become the ignition for gold to rally to much higher ground.
We will commence with a definition of a Golden Cross as defined by Stockcharts.com: A signal where the shorter moving average moves above the longer moving average. Usually, this term is associated with the 50-day moving average crossing above the 200-day moving average.

There is also an opposite and negative event known as the Cross of Death; this is when the shorter moving average moves below the longer moving average, for example, the 50dma crossing below the 200dma.
The Golden Cross
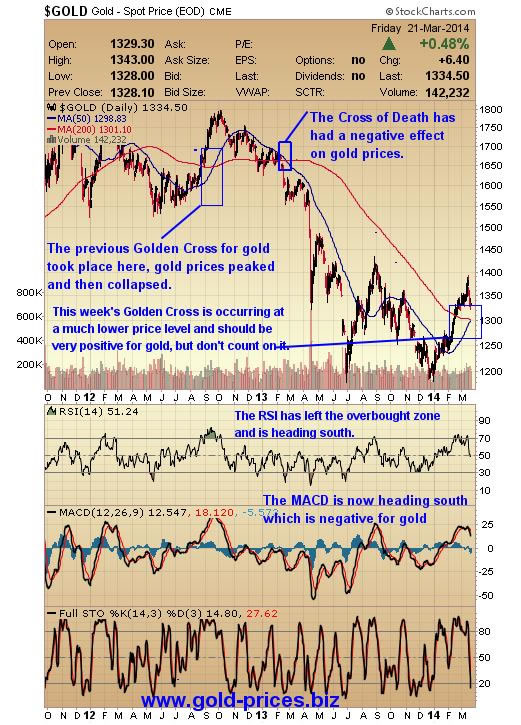
As we can see on the above chart a golden cross is about to be formed this week. However, before we bet the ranch on gold prices making a moon shot we might want to take a look at what happened when this cross appeared previously on the gold chart. It took place around September 2013 and as we can see things turned to custard with gold prices peaking and then falling from $1650/oz to $1200/oz in June 2014.
This week’s Golden Cross is occurring at a much lower level and should be very positive for gold, but don’t count on it. The RSI has left the overbought zone and is heading south. The MACD has formed a negative crossover and is now also heading south. It should also be observed that gold prices managed to form a new ‘higher high’ recently but was unable to hold it for more than a few days, which is disappointing as it suggests weakness.
The Precious Metals Mining Stocks
If you take a quick look at the Gold Bugs Index, the HUI you can see that it more or less followed gold. In 2013 the HUI was standing at around the 500 level, it went on to fall to around the 200 level, slashing more than 50% off the value of the gold mining stocks, a gut wrenching experience for those who were heavily invested in this sector.


Conclusion
Technical analysis is not a perfect science and as investors we should not rely on any one indicator on which to predicate our trading strategy. Even when we have a situation where a number of technical indicators appear to be lining up with each other is it very important to have a good grip on the big picture and a good understanding of the fundamentals. The fallout from the Ukraine, Janet Yellen’s tapering programme, the continuing purchases by the Chinese, to mention just a few, are all playing key roles in gold’s progress.
The gold market was a profitable sector to be invested in for over a decade or so, but the last two years this has not been the case, so great care and patience is now the order of the day. We are hunting for what we think are bargains in the mining sector in anticipation that the bottom may not be in yet and a final capitulation may still lie ahead of us. To that end we are largely in cash, but are buyers when we think that a stock has been sold off too aggressively and therefore offer us great value. Although I am not a big fan of the US Dollar it has to be noted that it did outperform gold, silver and the miners in 2013 by a long way
We will keep most of our gun powder dry and wait until we are absolutely certain that this bear phase is over before adopting a more aggressive stance on the acquisition trail. We are weary of this bear phase and we will trade accordingly until this bear goes into hibernation.
Got a comment, fire it in, especially if you disagree, the more opinions that we have, the more we share, the more enlightened we become and hopefully the more profitable our trades will be.

See the original article >>

14-year resistance and high valuations for Small caps right here!

by Chris Kimble

CLICK ON CHART TO ENLARGE

Russell 2000 is hitting a 14-year resistance line on a monthly basis at (1) above. At the same time valuations are hitting levels only seen twice in all of history.  In the past the combo of resistance and valuations took place near a peak in small cap prices. Different this time?

Pretty important price point and pattern for the Russell 2000 right now!

See the original article >>

Guess Which Precious Metal Is Controlled By The Russians

by Tim Staermose

Palladium is like the Rodney Dangerfield of precious metals. It never gets any respect.

If you ask someone about precious metals, in fact, just about everyone has heard of gold and silver. And occasionally platinum.

But palladium is one of those obscure precious metals that few people think about, or even know about.

Aside from actually having its own currency code (XPD), palladium is widely used in a variety of industrial applications, from spark plugs to catalytic converters to hydrocarbon ‘cracking’ to electronic components.

And here’s something most people don’t know: most of the world’s palladium is mined in Russia.

Since October 2013, Palladium prices have had a moderate boost—about a 5.3% increase in five months.

But given what’s happening in Russia, prices could soar. In fact, with trade sanctions looming, palladium could be taken off the world market indefinitely.

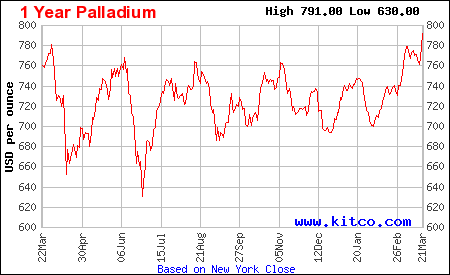
As the following chart shows, palladium has just broken out to a new 52-week high and is showing strong upward momentum.

1 year palladium Guess which precious metal is controlled by the Russians...

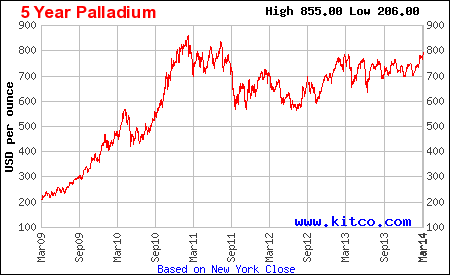
Moreover, if you look at the 5-year chart, it could be about to break out to even longer-term highs.

5 year palladium Guess which precious metal is controlled by the Russians...

I would consider buying palladium today, with a stop-loss order to protect your capital, at $759. That means if the market should prove this thesis wrong, the loss would be limited to just 4%.

I think the near-term upside target is the 5-year high of $855. That’s about an 8% gain from where we are today.

An upside of 8% versus a downside of 4% makes palladium a good risk/reward trade, given that the odds of the higher-price outcome are much better than the odds of the lower-price outcome.

But if tensions between the West and Russia escalate and trade sanctions stay in place for a prolonged period, $855 could be a very conservative upside target for palladium.

The last time Russia withheld palladium supplies from world markets back in 2000, the price rose 151% from a low of $433 in January 2000 to over $1,090 an ounce by January 2001.

In a scenario like that, palladium would be an incredibly profitable trade.

One easy way to take a position in palladium is via the ETFS Physical Palladium Shares (PALL on the New York Stock Exchange).

A new physical palladium ETF sponsored by Standard Bank has also just launched in South Africa.

And Absa Bank, which already sponsors the world’s largest platinum-backed ETF, has also announced it will launch a palladium ETF called NewPalladium. It will list on the Johannesburg Stock Exchange on March 27th.

These new palladium ETF launches, coming at a time of tightening supply due to Russian sanctions, could easily add more upward momentum to palladium prices, as they will withdraw supply from the market to physically back their shares.

However, if you want to avoid the possibility of any counterparty risk, there’s no substitute for owning the physical metal yourself.

The Royal Canadian Mint has in the past minted palladium versions of its very popular and instantly recognizable Maple Leaf bullion coins.

You can also buy 1 troy ounce palladium bars from most major dealers.

See the original article >>

Home builders need to breakout now or…

by Chris Kimble

CLICK ON CHART TO ENLARGE

The Dow Jones Home Construction index created a "Bearish Head & Shoulders" top from 2003 to 2007. The index ended up losing  90% of its value during the housing crisis with half of the decline taking place once the neckline broke. Over the past five years the index has had a strong rally, taking it to the "underside of the neckline" of that monster bearish pattern.

At the same time, it's hitting the underside of the neckline, it happens to be hitting a key Fibonacci retracement level and might be creating a "Double Top" at this key price point at (1). Last week the index might have created a lower high and a large bearish wick at (2).

For home builders to move higher, they need to break this heavy resistance as soon as possible!!!

See the original article >>

Bullish sentiments prevail in US Cotton futures, India market steady

by Commodity Online

China cotton demand has been supportive of prices and good quality of US cotton supplies has ensured that 80% of the current crop has been sold out.

24 Mar 2014

CHICAGO/MUMBAI (Commodity Online): US Cotton futures is now witnessing a bull run due to sound fundamental and economic factors, according to Louis W Rose, a leading cotton researcher and analyst in Rose Report.However, analysts pointed out that speculative interest was behind the rise in US futures and may not have any appreciable impact on Indian markets.

This week's cotton export report showed net sales near 55 K RBs while shipments were a robust 345 K RBs for all cotton, the Rose Report said. Both net sales and shipmennt figures exceeded the per week requirements to mee the USDA's revised 10.7 M statistical bale export projects. Sales cancellations were a sparse 15 K RBs.

China cotton demand has been supportive of prices and good quality of US cotton supplies has ensured that 80% of the current crop has been sold out.

CFTC report for week ending March 11 shows 8% growth in futures net long positions for speculative funds and holders of non-reportable positions while there was 21% growth in futures and options combined net long positions. Buying activity has intensified near to $0.90 per pound levels, the repeort analysing CFTC data said.

"Next week will be light with respect to cotton and economic reports, but the USDA final cotton ginning report is scheduled for release on Mar 25 and, given the current tightness of US stocks, the weekly export report on Thu will bear watching."

The report said that based on USDA-AMS classing data, it would appear that the final ginning number will most likely be closer to 12.9 M than 13.0M bales. This is quite bulish for the commodity.

US Cotton May futures is likely to finish unear unchanged to a bit lower. May 2014 futures may trade a range of $0.91 to 0.94 on the inside or $0.905 to $0.906 on the outside, according to Louise W Rose, in Rose Report.

According to the US Department of Agriculture, stocks in US warehouses will be at a four-year low of three million bales (of 217.72 kg each) at the end of the season in July. Exports from the US is projected nearly two per cent higher at 10.7 million bales.Global stocks at the end of July are projected at around 95 million bales by the USDA.

India Cotton overview
India cotton prices remained steady on weaker export demand and demand is expected to be muted in the coming days due to finacial year ending.

Gujarat Sankar-6 cotton was traded at Rs 42,300-42,500 for a candy of 356 kg for best quality, while average grade cotton was traded on Rs 39,500-41,500 a candy. Kapas or raw cotton ruled steady as demand from ginning mills was lower.

At Rajkot, kapas traded at Rs 900-1,065 for a maund of 20 kg. Gin delivery kapas was traded at Rs 1,060-1,065 a maund.

Cotton arrivals were lower. This week, arrivals decreased to 50,000 bales in Gujarat from 55,000 last week. Similarly, across the country arrivals declined from 1.82 lakh bales to 1.52 lakh bales.

See the original article >>

Key cycles come to end as geopolitics heats up

By Jeff Greenblatt

Gang, this is it. Cycle season comes to an end right about now. Friday was 618 days off the October 2011 bottom, so we are about to wrap it up by Monday, the latest Tuesday. Let us not forget the last big window in 2007 did not validate until the last day. So it was Friday where tech started turning south. As you can see from the picture, there is no technical damage yet as we are still in the confines of these trend channel lines. However, the way the week was going, the pattern came right up to the line and had an opportunity to break through. It did not. It could have spared us the extra drama. It did not.

What should concern bulls about this other than the obvious, which is it had runners on base and didn’t drive them in, is that people suddenly got skittish about holding positions over the weekend.

What did they think was going to happen? Unfortunately, these days there’s a lot that can happen. The most important thing that did happen is suddenly Putin is using the Crimean crisis as a leverage point in the ongoing nuclear negotiations with Iran. Truth be told, Putin has a lot of the same geopolitical interests the other major powers have concerning containing Iran. But it would not surprise me if Putin changed to the other side of the aisle if the United States pushed for more comprehensive sanctions.

That brings us briefly to last Monday, which I told you could have turned out to be a disaster. Well, John Kerry had warned – no “threatened” is a better choice of words – the previous Thursday about what the United States might do if the Crimea was annexed. These threats never came to fruition, so markets took the opportunity to go higher. Let me put it to you this way: The greater likelihood is bears gave up once again when the news wasn’t the worst possible outcome. We’ve discussed in this space for the past three years how skittish bears really have become. They even have the wind at their backs right now, yet somehow keep the blinders on. Still, someone came along and pushed the sell button on Friday.

But not all is rosy. Have you seen the Housing Index? Granted, this trendline only goes back to October, but it’s the first real sign of a major sector not holding support.

I can’t even tell you the BKX looks like this. But let’s just say for a minute the HGX drags down the entire market. Right now it is leading to the downside. For the reason banking is not doing the same thing if this is all we get whatever real correction develops will not achieve its destiny if banking at some point doesn’t become a major participant.

We are truly at an inflection point because at the end of the cycle period we are either going to have the NDX complete a flag pattern pullback or this is going to be the origin of something more important. That’s what it comes down to, and we should have a better feel for it by Tuesday. Because this is the seasonal change point, day 618 and the Gann master timing window we hardly need an excuse or justification for Friday’s action. Markets are supposed to turn this time of year. I’m sure CNBC can come up with a spin as to why the NDX would break down tomorrow if it does.

The higher probability outcome for Housing is a drop to about 182. Given the high at week 261 was 213 that would be a drop of about 14.55%. So if week 260 off the bottom produced a 14+% correction and less elsewhere we get off the hook very light. When we look back at this period we might come to the realization this sequence could be the origin of a stock market bubble. I told you flat out back in February if this time season did not produce a meaningful the correction the implication was the development of a bubble. There are some elements in place. The most important is dysfunction of bears to operate effectively in this environment. Like every correction since 2011 bears have given up too easily and way too early. On the other hand this is the last chance for a meaningful drop.

The other major event of the week was Janet Yellen’s first Fed meeting. The change in the language is the Fed is finally signaling they are willing to raise interest rates six months after the tapering program ends. Simple math puts that at a year from now. On the surface, I don’t have a problem with that simply because if we rewind the clock, Bernanke originally told us rates would be low until about 2013. Back in 2009, that was a long time into the future. Now that it's 2014 nobody should have a problem with it. However people do have a problem and all you really need to do is look at the HGX to see what kind of problem people have. My problem is Bernanke had to ease much longer than anticipated because Obama and Congress never learned to work together

The economy could have been so much further along by now and as it turns out we have the weakest recovery since the Great Depression and I don’t think the economy is going to ready to increase rates even in a year down the road. Too bad they don’t have a choice because the Fed can’t control long term rates and I think the bond market has already entered a new bear market. What that means is the lower the price the higher interest rates go and 2013 turned out to be a year that greatly exceeded even my lone wolf voice in the dark projections.

Here’s the other problem: Suddenly geopolitics is getting in the way. I warned you a year ago the big geopolitical story of the year would center on Iran. I thought Israel would hit them, I really did. Instead they tried to cut a deal and are slowly finding out that no matter what Iran says, their actions are they will continue to support the terrorists whose goal is to wipe Israel off the face of the earth. It was reported here 2 weeks ago US intelligence played a key role in the capture of a ship headed for Gaza loaded with rockets that could’ve destroyed both Tel-Aviv and Jerusalem. Score a major victory for the Obama Administration.

Why am I spending so much time on geopolitics? Look back at the two world wars and you’ll see they were both preceded by economic disasters. The panic of 1907 was the precursor to World War I in 1914. What year was the financial collapse? So you can see we are in a behavioral/socionomic time window for the outbreak of another major war. Personally, I don’t think the United States can beat Russia in a war. That’s not putting the U.S. down, but I think all sides realize there is never going to be a winner if the US and Russia ever do go to war, so it can never happen. So all of this geopolitical stuff directly relates to our work.

So the economy isn’t likely ready for a hike in interest rates and we certainly aren’t in a position to wage a major war. Not when the government is downsizing the military to pre-World War II levels. The rebound in the economy is promising but in no shape or form are we to the consistent prosperity of the back end of other cycles of expansion. I’ll leave you with this question. Is this economy anywhere near as prosperous as the end of the last two business cycles in the 1980s and 1990s? Your answer to that question should determine whether you think rates should go up. Then you are likely to understand why this bull market is getting long in the tooth. 

See the original article >>

Follow Us