Saturday, July 16, 2011

Different Patterns

by Kimble Charting Solutions


The Week Ahead: Are Hedge Fund Investors Bailing Out?


It’s possible that big-time redemptions caused several would-be rallies last week to sputter and die. A short-term rally remains likely, but if the sell-offs continue, June’s lows could be tested, writes MoneyShow.com senior editor Tom Aspray.


It was clearly a rough week for stocks. Despite historic oversold readings after last Monday’s selling, rally attempts have been feeble. Typically, such an oversold market would stage a decent one- or two-day rally, but it never came last week.


Selling by hedge funds could be keeping the market lower…as several days last week, stocks opened strong only for the rally to fizzle quickly. June saw the highest level of hedge-fund redemptions since October 2009, and I doubt things have gotten better in July, as most apparently missed the rally.


For the year, the HFN Hedge Fund Aggregate Index is up just 0.63%, against over 6% for the S&P Total Return Index. Therefore one can see why hedge-fund investors may be looking elsewhere: If the hedge funds are selling in order to meet redemption requests, it could explain the recent action.


Obviously, the stock market and economy had enough barriers to overcome last week without the hedge funds. Early last week, concerns over Italy’s debt surfaced, and of course the ongoing stalemate over the debt ceiling has many worried.


Adding to the volatility were hopes of QE3 after Fed Chairman Ben Bernanke’s testimony. He clarified his comments on Thursday, and stocks quickly sold off.
chart
Click to Enlarge


From a technical standpoint, the market is reaching a critical juncture. As the chart of the Spyder Trust (SPY) indicates, the 50% support level at $130.95 was violated Thursday. This makes the 61.8% level at $129.85 more important.


The McClellan oscillator is an advance/decline indicator that measures whether the market is overbought or oversold. On July 7, it stood at +258 (overbought), but closed Friday at -36.


It is trying to turn up, and is now oversold enough to fuel a rally. One is likely by mid-week.


Gold broke out of its recent trading range in impressive fashion, and looks ready to go even higher. Crude oil also finished the week on a strong note, and overall the firming in the commodity markets suggested to me that the commodity markets had turned the corner.


Most of the economic data last week was better than the horrible job numbers, but not good enough to get anyone excited. The inflation numbers reflected the lower crude-oil prices, retail sales were just barely positive, and consumer sentiment was the weakest in over two years.


This week, the focus will be on earnings reports, as the economic calendar is light. So far earnings have been better than expected, but this has not helped the market.


On Tuesday, we have housing starts, followed by existing home sales on Wednesday. Then on Thursday, in addition to the weekly jobless claims, we get the Philadelphia Fed survey.


WHAT TO WATCH


The sentiment picture reflects that both individual investors and financial newsletter writers are still positive on the market. There has been little change over the past two weeks.


Of course, this must be viewed from a contrarian standpoint, as it could reflect a level of complacency that is negative for the market. An increase in bearishness would be more positive.


Last time, I was looking for a six- to seven-day correction, like we saw in April. Friday marked six days since the high. Clearly, the action early this week will be important
chart
Click to Enlarge


S&P 500
The key support level for the Spyder Trust (SPY) is now $129.80. From a technical standpoint, a daily close below this level will indicate a drop back to the $125 to $127 area.


A close back above the $133 level is needed to signal that the correction is over, while a failed rally to this level would be negative.


As noted last week, the S&P 500 A/D line did make convincing new highs on July 7. It is still above its uptrend from the June lows. A break of this uptrend will indicate a drop back to the June lows.


Dow Industrials
The Diamonds Trust (DIA) has held up much better than the SPY, as the 38.2% support level at $123.93 was only slightly violated last Friday.


The more important 50% support is at $122.83, and a close below $121.79 would be negative.


The Dow Industrials’ A/D line has just corrected back to the late June highs, which is the first good support. 
It is still well above both its short-term trend (line a) and longer-term support (line b).


Nasdaq-100
The PowerShares QQQ Trust (QQQ) got a boost on Friday due to the much better than expected earnings from Google (GOOG). The tech giant alone comprises 5% of QQQ.


The 38.2% support level was broken on Thursday, and the A/D on the Nasdaq-100 closed right on its short-term uptrend (line d). It was the move above the downtrend (line c) in the A/D line in late June that signaled the recent rally.


The 50% support level for QQQ is $56.47, and this now becomes more important. A close above last Wednesday’s high of $58.34 would be the first strong sign that the uptrend had resumed.

Russell 2000
The iShares Russell 2000 Trust (IWM) is also acting better than the SPY, as it is still above its 50% support level at $81.60.


The Russell 2000 A/D line also looks stronger than that of the Nasdaq-100. It was weaker than the others in April, which turned out to be a strong warning.


There is key short-term resistance now at $84.47, which needs to be overcome to signal a stronger rally in small-cap stocks.

The Perfect Indicator for All Markets


On-balance volume (OBV) is a proven-effective leading indicator that allows traders to spot turning points and valid signals across a wide variety of markets and time frames.

For the majority of technical analysts, volume plays an important role. Unfortunately, simply comparing one day’s volume to a three-month average will not tell you much about whether money is flowing in or out of a particular market or stock.

In the late 1970’s, my father gave me a book by Joseph Granville titled Granville’s New Strategy of Daily Stock Market Timing for Maximum Profit. A few years later, I found Granville’s on-balance volume (OBV) on Compu Trac, one of the earliest technical analysis software programs. I was quickly hooked on the OBV. From the following examples, as well as my daily Charts in Play column, I think you will see why it is my favorite indicator for all markets.

Joe developed the OBV as a way to determine whether the smart money was buying or selling. It is calculated by keeping a running total of the volume figures and then adding in the volume if the close was higher than the previous period, or subtracting the volume if the closing price was lower.

If you are doing this in a spreadsheet, such as Excel, the starting volume can be arbitrary, as it is the pattern of the OBV—not the absolute number—that is important. When viewed on a monthly or weekly basis, this can be very useful in identifying major trends.

From the start, I analyzed the OBV in the same way that I would analyze a price chart. I used trend lines, moving averages, and support/resistance analysis to determine whether the OBV was positive or negative.

Divergence analysis was always quite important, though divergences are not always observed at every important turning point. Like my early work on Welles Wilder’s Relative Strength Index (RSI), it was critical to use divergence analysis on multiple time frames in order to generate valid signals.

In May 1985, my analysis of the OBV on the major currencies was instrumental in helping me identify major bottoms in currencies like the Deutsche mark (DMK) and Swiss franc (CHF), and therefore, the top in the US dollar (USD). At the time, most of the leading economists were expecting the dollar to remain strong for a few years. The dollar had bottomed in November 1980 with the election of Ronald Reagan.

Figure 1
chart
Click to Enlarge

In a May 21, 1985 appearance on the Financial News Network, a precursor to CNBC, I discussed a chart very similar to the one above of the Deutsche mark futures contract traded on the CME. In my early adaptation of the OBV, I had also added a 21-period weighted moving average (WMA) of the OBV, which is plotted in green.

The weekly chart shows that the DMK was in a well-established downtrend (line a) starting in 1982, as it was falling in value against the US dollar. In 1984, the decline accelerated, as it fell 25% to a low of 0.2881, or 3.47 DMK per USD. By comparison, in early 1984, it was 2.5 DMK per USD.

During this decline, the OBV rallied several times to its declining weighted moving average. Then in March 1985, the OBV moved above its weighted moving average and broke its downtrend, line c. The WMA flattened out over the next six weeks before starting to rise.

On several attempts, the OBV was unable break through resistance (line d). With the OBV now above its rising weighted moving average and with confirming bullish signals in the analysis of the CHF and British pound (GBP), it suggested these currencies had bottomed out. The daily technical studies had been positive on the currencies for several months, and this was another negative for the dollar.

The OBV overcame its resistance, line d, on July 5, 1985 (line a). One week later, the DMK also broke through its corresponding resistance, line d. This is one of the reasons I find the OBV to be such a valuable indicator, as it often leads prices by one or more periods. Obviously, this can make the risk/reward on new positions much more favorable.

The DMK tested its downtrend (line a) in August and had a sharp, three-week pullback. During this time, the OBV was much stronger, as it held well above its rising weighted moving average.

In late September, the G5 nations got together over a weekend at the Plaza Hotel in New York and agreed to devalue the dollar. As you can see on the above chart, the DMK futures gapped higher and accelerated to the upside, as there was concerted intervention to lower the dollar. By early 1988, the DMK had more than doubled.

I have found that the OBV works on any market that has good volume, and I have long advised cash forex traders to keep an eye on the currency futures, where the volume data is very reliable.
chart
Click to Enlarge

One of the most simplistic ways to use the OBV is to see if it makes a new high with each price high in an uptrend, or makes a new low with prices in a downtrend. For the past five years or so, I have been reporting on the monthly OBV analysis of the gold futures. The arrows on the above monthly chart of gold reflect the new monthly OBV highs going back to 2003.

On the chart, you will see that each new high in the gold futures has been confirmed by a new high in the monthly OBV. The last closing monthly high in the gold futures was in April and was supported by a convincing new high in the OBV. It is also clear from the chart that the 21-period WMA has acted as a good level of support, as tests of the rising WMA have often marked correction lows.

As I referred to earlier, the OBV is the only indicator that routinely will break out ahead of prices. At the end of December 2008, the OBV closed above resistance at line c when gold closed at $884. It was not until the end of February that the gold futures overcame trend line resistance, line a, at $928.

More serious students of the OBV can also watch for when the indicator is rising or falling more sharply than prices. A good example occurred in the fall of 2010 when the OBV was rising much more sharply (see circle) than gold prices. The chart indicates that gold prices did catch up over the next few months.

If you can’t look at the monthly, weekly, and daily data, then at least look at the weekly and daily data. One of my favorite patterns to watch for is the weekly bottoming formation in terms of price and the OBV.

For 18 months, the OBV for corn was in a trading range, lines e and f. While the price chart was forming lower highs, line d, the OBV was forming higher highs (line e). This was a bullish sign.

In mid-August, corn prices closed above resistance at 412, and this was confirmed by the breakout in the OBV, point 2. For the next eight months, both corn and the OBV were moving sharply higher. The OBV tested its rising weighted moving average in the latter part of November, which presented a good buying opportunity.

Corn prices peaked in April and the new highs were confirmed by a new high in the OBV. But in June, when corn made a further new high, line g, the OBV formed a lower high, line i. The next week, the OBV dropped below its weighted moving average and corn subsequently broke support at line h.

In most cases, an eight-to ten-week divergence in the weekly OBV can lead to a multi-month correction. For corn, it will be important to see if the uptrend in the OBV (line j) does hold.

Figure 3
chart
Click to Enlarge

The OBV is also a valuable tool when analyzing the various market sectors. The Dow Transportation Average is one that I monitor closely. The weekly OBV on the Transports confirmed the March 2009 lows before rising sharply, and by that summer, it was in a clear uptrend.

The OBV peaked in August and then developed a trading range, as indicated by the resistance at line b. The Transports had a corresponding level of resistance at 4287, line a. In late February, the OBV moved above its weighted moving average and two weeks later overcame the resistance at line b. This breakout coincided (line 1) with the close in the Transports above the resistance at line a.

The Transports rallied almost 8% before peaking at the end of April 2010. The Dow Transports consolidated for the next four months, but in the first week of September (line 2), the OBV moved to new highs when the resistance at line d was overcome. The Transports did not overcome the corresponding resistance at line c until eight weeks later, in November.

The Transports made a short-term peak in mid-February 2011 and then declined 7.9% from the highs. The OBV held up much better than prices, and just three weeks later, it made new highs (line 3) and again lead prices higher.

Both the Transports and the OBV made new highs in early May, but as the Transports made a new high the week ending July 7 (line e), the OBV formed a lower high. This may be a significant divergence and does warrant close watching. A drop below its WMA would be an additional warning sign. A violation of support at line g would indicate that an interim top was in place.

Stricter bank test leaves 80 billion euro hole: analyst

by Reuters

(Reuters) - Europe's banks would be 80 billion euros ($113 billion) short of capital under a tough test of their health, more than 30 times the amount demanded in an official test, according to a leading analyst.

Eight small banks on Friday failed a test of how 90 European lenders would withstand a two-year recession and were told to raise 2.5 billion euros.

Twenty top banks would fail a more severe test based on the data they supplied in the official test, with lenders in Britain, France and Germany all falling short, said Kian Abouhossein, an analyst at JPMorgan, in a note on Saturday.

The official tests were criticized for not applying a haircut on sovereign bond holdings in the banking book and having too low a pass mark.

"EBA stress test II is yet again an opportunity missed for EU member states encouraging banks to raise equity as Basel 3 ratios remain low," Abouhossein said.

Europe's banks would need 41 billion euros to keep their core capital ratio above 7 percent, rather than the 5 percent pass mark used in the official test, according to Reuters calculations.

JPMorgan said the shortcomings meant the results were of limited value, although the test provided far greater data and transparency than has been available in the past, allowing analysts to run an "acid test" for 27 banks using stricter criteria including haircuts on sovereign banking book exposures and a 7 percent pass mark.

The banks tested would show an 80 billion euro capital deficit, including 25 billion euros for UK banks, 20 billion euros for French banks, 14 billion for German banks, 9 billion for Italian banks, 4 billion in Spain, 4 billion euros for Portuguese banks and 4.5 billion in Austria, Abouhossein said.

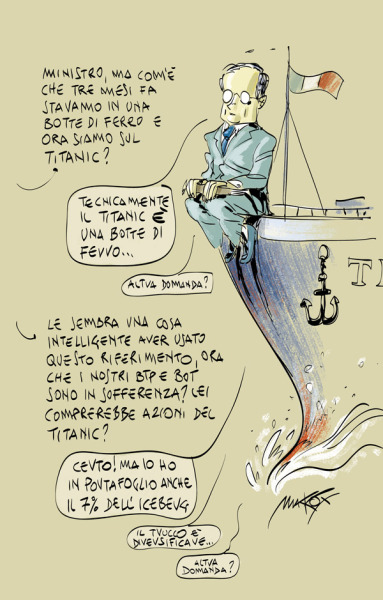
Tremonti: "We are on the Titanic ..."

vignetta di Makkox
Ricordate quando Pinocchio Tvemonti invitava a spendere (i nostri soldi, non i suoi) in quanto la crisi era solo psicologica, bisognava far girare l’economia? Era il 2009, mica mille anni fa. E quando, sempre lui, il superministro che tutto il mondo ci invidia (ma sarà vero?) sosteneva che “la crisi è superata, grazie a noi, la sinistra mente”. Anche in questo caso sembra passato tantissimo tempo, ma era solo l’anno scorso. È facile dare addosso a chi non si lascia andare a facili ottimisti e resta ancorato alla realtà, facendo la parte del gufo triste, della cassandra portasfiga capace solo di preconizzare avvenimenti drammatici, luttuosi. Eppure tutti i nodi vengono al pettine, e le bugie hanno le gambe corte. Infatti lo stesso Tvemonti, ora invoca l’aiuto dell’opposizione. “Siamo sul Titanic”, dice. “Il debito ci divora”, sostiene. Ma cosa ha fatto il governo in tutti questi anni per lo sviluppo? Ben poco, a sentire l’autorevole Financial Times, secondo il quale “In un mondo ideale Silvio Berlusconi si sarebbe già dimesso”. Ma non per il bunga bunga e le barzellette idiote, bensì per la sua cronica mancanza di credibilità, “per convincere i mercati che l’Italia è affidabile”. E per farlo non basta un pacchetto di misure di austerità, servirebbero provvedimenti in grado di far crescere il nostro Paese. Che magari siano anche in sintonia con quanto democraticamente espresso dagli elettori il 12 e il 13 giugno. Quando cioè hanno detto basta alle privatizzazioni all’italiana che finora hanno portato solo svantaggi ai contribuenti (e invece la manovra dà mandato a una dismissione in tempi più rapidi del patrimonio dello Stato).  Come fa a girare l’economia se tutto quello che il “genio della finanza creativa” sa inventarsi è la mancata rivalutazione di pensioni normalissime, che spesso sono utilizzate come vero e proprio ammortizzatore sociale, dato che servono a pagare gli studi ai figli, o per aiutarli a sopravvivere, data la precarietà dei loro lavori malpagati? O l’ennesimo aumento delle accise sulla benzina, che colpisce tutti i cittadini e che sicuramente non contribuisce a far girare l’economia, dato che come si sa con il carburante aumentano anche tutti i beni, dato che il trasporto più caro viene fatto ricadere sull’acquirente?

(vignetta di Makkox)
Ricordate quando Pinocchio Tvemonti invitava a spendere (i nostri soldi, non i suoi) in quanto la crisi era solo psicologica, bisognava far girare l’economia? Era il 2009, mica mille anni fa. E quando, sempre lui, il superministro che tutto il mondo ci invidia (ma sarà vero?) sosteneva che “la crisi è superata, grazie a noi, la sinistra mente”. Anche in questo caso sembra passato tantissimo tempo, ma era solo l’anno scorso. È facile dare addosso a chi non si lascia andare a facili ottimisti e resta ancorato alla realtà, facendo la parte del gufo triste, della cassandra portasfiga capace solo di preconizzare avvenimenti drammatici, luttuosi. Eppure tutti i nodi vengono al pettine, e le bugie hanno le gambe corte. Infatti lo stesso Tvemonti, ora invoca l’aiuto dell’opposizione. “Siamo sul Titanic”, dice. “Il debito ci divora”, sostiene. Ma cosa ha fatto il governo in tutti questi anni per lo sviluppo? Ben poco, a sentire l’autorevole Financial Times, secondo il quale “In un mondo ideale Silvio Berlusconi si sarebbe già dimesso”. Ma non per il bunga bunga e le barzellette idiote, bensì per la sua cronica mancanza di credibilità, “per convincere i mercati che l’Italia è affidabile”. E per farlo non basta un pacchetto di misure di austerità, servirebbero provvedimenti in grado di far crescere il nostro Paese. Che magari siano anche in sintonia con quanto democraticamente espresso dagli elettori il 12 e il 13 giugno. Quando cioè hanno detto basta alle privatizzazioni all’italiana che finora hanno portato solo svantaggi ai contribuenti (e invece la manovra dà mandato a una dismissione in tempi più rapidi del patrimonio dello Stato). Come fa a girare l’economia se tutto quello che il “genio della finanza creativa” sa inventarsi è la mancata rivalutazione di pensioni normalissime, che spesso sono utilizzate come vero e proprio ammortizzatore sociale, dato che servono a pagare gli studi ai figli, o per aiutarli a sopravvivere, data la precarietà dei loro lavori malpagati? O l’ennesimo aumento delle accise sulla benzina, che colpisce tutti i cittadini e che sicuramente non contribuisce a far girare l’economia, dato che come si sa con il carburante aumentano anche tutti i beni, dato che il trasporto più caro viene fatto ricadere sull’acquirente?

See the original article >>

The principle of Pareto ...

by Contact Me

Follow Us