Monday, September 15, 2014

Under down under

By Lucy Meakin and Kristine Aquino

Australia’s dollar fell below 90 U.S. cents for the first time since March, and Sweden’s krona declined after elections as prospects for U.S. interest-rate increases next year boosted the greenback’s allure.

The Bloomberg Dollar Spot Index rose to a 14-month high. Australia’s currency (CME:A6Z14) extended this month’s drop to 3.4% after data showed the weakest growth in Chinese industrial output since the global financial crisis. Emerging-market currencies slid. The krona (CME:SKZ14) declined as Sweden faced the prospect of a hung parliament.

“The risks now are building for the Australian dollar, not just from the U.S. higher yields but from the Chinese angle as well,” said Ian Stannard, head of European foreign-exchange strategy at Morgan Stanley in London. “We’ve seen the Aussie already moving below 90, giving quite a bearish signal. It’s an important week for global risk-assessment.”

Australia’s currency fell 0.2% to 90.23 U.S. cents at 8:36 a.m. New York time and earlier touched 89.84 cents, the lowest level since March 12. The krona depreciated 0.4% to 7.1464 versus the U.S. currency and reached 7.1571, the weakest since June 2012.

The U.S. dollar (NYBOT:DXZ14) strengthened 0.4% to $1.2916 per euro (CME:E6Z13) and was little changed at 107.24 yen. The euro fell 0.5% to 138.51 yen. Japanese financial markets were shut today for a national holiday.

China Production

Chinese industrial output rose 6.9% from a year earlier in August, the statistics bureau said Sept. 13. That was down from 9% in July and the slowest pace outside the Lunar New Year holiday period of January and February since December 2008, based on previously reported data compiled by Bloomberg. China is Australia’s largest trading partner.

Before the slide in the Aussie, the median forecast in Bloomberg surveys of analysts for the currency’s end-2014 level had climbed to 92 cents at the beginning of this month. That was the highest projection since July 2013 and the first time in more than a year that the Aussie’s spot level had fallen below the survey estimate.

The krona depreciated as the three-party Social Democratic opposition led by Stefan Loefven won 43.7% of the votes, versus 39.3% for the government of Prime Minister Fredrik Reinfeldt, with all the votes counted. The nation’s political establishment was thrown into turmoil as backing for the anti- immigration Sweden Democrats more than doubled, to 12.9%, making them the third-largest party.

Reinfeldt’s Loss

The result marks an end to eight years of rule by Reinfeldt’s conservative-led coalition. The premier said he will hand in his resignation today as the responsibility of forming a new government falls to the Social Democrats, which won the most votes.

“The krona has weakened in response to the Swedish election result,” BNP Paribas SA analysts led by London-based Steven Saywell, wrote in an e-mailed note. “The market’s concern is over the time it may take for a government to be formed, but we would highlight that the current weak levels of the krona limit the scope for a selloff.”

The Bloomberg Dollar Spot Index, which tracks the greenback against 10 major currencies, increased 0.1% to 1,051.55 and had touched 1,052.14, the highest since July 2013.

A gauge of manufacturing in the New York region rose more than forecast, climbing to a reading of 27.54 for September, from 14.69. A Bloomberg forecast called for 15.95.

Best Performer

The dollar has risen 3.6% over the past month, making it the best performer of 10 developed-nation currencies tracked by Bloomberg Correlation-Weighted indexes. Signs of a strengthening U.S. economy have boosted speculation the Federal Reserve is moving closer to raising interest rates as it tapers its program of quantitative easing.

There’s a 78% chance the Fed will raise its target for overnight lending between banks from a range of zero to 0.25% by its September 2015 meeting, fed funds future data compiled by Bloomberg show today. Policy makers begin a two-day gathering tomorrow.

“The strength of the dollar is something we’ve been anticipating, knowing that we have QE finally ending,” Dan Morris, a global investment strategist at TIAA-CREF Asset Management, said in an interview on Bloomberg Television’s “On The Move” with Jonathan Ferro in London. “You do see a negative reaction on the part of emerging markets when those currencies do start to weaken against the dollar, with cash flowing back to the U.S.”

A Bloomberg index of 20 developing-nation currencies slid 0.3% to 88.97 and touched 88.90, its lowest level since 2009.

Copyright 2014 Bloomberg. All rights reserved. This material may not be published, broadcast, rewritten, or redistributed.

See the original article >>

What happened to the volatility?

By Daniel P. Collins

Every time it looks like we are heading back to a “regular” market environment we are reminded just how extraordinary an event we went through in 2008. Perhaps there is no going back — at least not for a long time. The key factor is that nearly all major currencies are wallowing in a near zero-interest rate environment and central banks across the globe are keeping a tight handle on monetary policy (see “Not much to trade over,” below). The result has been historic low volatility in currency markets.

“Obviously with monetary policy and yield differential being a big catalyst for currency direction the whole world seems to have come to a standstill,” says Interactive Brokers Chief Market Strategist Andrew Wilkinson. “Risk was set in neutral gear and nobody has a good handle on what comes next for the dollar.”

Or for anything else for that matter. An odd component of the recent low volatility environment is that it is happening with the world awash in geopolitical risk. We have the Russia/Ukraine situation, a hot war in the Gaza strip, the Islamic State of Iraq and Syria (ISIS) gaining a strong foothold in both those countries and an Ebola outbreak in Africa. 

“I have never seen anything like it in terms of complacency,” says Marek Chelkowski, principal of advisor MDC Trading. “There are a lot of volcanos.”

“We are setting records for most narrow average daily ranges,” adds Michael Aronovitz, portfolio manager for Gables Capital Management. “The average euro range is 30 to 40 pips a day; we were used to seeing 120 pips a day a few years ago. That is not going to change until interest rates begin to rise in the United States and there is more variation between (rates in) G10 countries.”

The situation compounds itself because with most central banks wallowing between zero and 50 basis points there is not a wide range of potential moves. “In a normal environment people would be looking at a larger potential range in movement of interest rates, but with it frozen that range is 25-50 basis points instead of perhaps 400 basis points,” Aronovitz adds.  

Dollar ready to soar?

There is a consensus that the dollar rally, which began in July, will continue, though the range of conviction is wide. 

Dean Popplewell, director of currency analysis and research for Oanda, sees numerous factors supporting the dollar. The taper, set to be complete by Q4, low inflation and the current low volatility all are adding to dollar strength according to Popplewell.

He points out that the European Central Bank is concerned with deflation as the U.S. Federal Reserve argues over when to begin raising rates.

Wilkinson is also positive on the dollar but more by default, and is cautious. “We had a lot of false starts with the dollar,” he points out. “Currency traders have been tripped up by that so many times. Ultimately it left a lot of people nursing wounds and sitting on the sidelines.”

He points out that economic data is still tepid and while the Fed should be the first mover, it could take another year. “The problem is that at the moment that move is thought to be way off into 2015.  And for the spot currency market that is a lifetime away,” Wilkinson says.

Erik Tatje, market strategist at RJO Futures, says, “We will see some weakness out of the Eurozone and a strengthening of the dollar by year end. I don’t foresee the fed changing anything. The dollar will continue to rally.”

Aronovitz is also bullish and cautious. “The dollar will continue to strengthen though there will be hiccups along the way,” he says. “We are at an historical low in currency volatility and that is the bigger story. Dollar strengthening is expected but the pace of the move is historically very slow.”

Expectations for the dollar range from slightly higher, following a correction, to testing the 2013 highs.

The summer rally took out some short-term resistance and the greenback faces a series of resistance areas in the narrowing ranges of the last few years (see “Squeezing the dollar,” below).

“What we are seeing now is a bit of a fear trade where people want to be long the dollar because stock markets are looking vulnerable to correction,” Wilkinson says. “And for the first time in a long while we are seeing the dollar feed off of those. The dollar is looking clever at this point in time but as [summer turns to fall] once again the same fears that are driving the dollar higher may end up receding.”

Popplewell sees the dollar breaking out of its narrow range and eventually testing 85. However, there is close-in resistance that must be challenged first.

“The first [resistance] level is 81.75, which was a 161.8 Fibonacci retracement from a previous zone,” says Tatje. “We really started to break above some key technical levels (in August); 81.50 to 82 will see a little resistance. If we can break above 82, I don’t see a whole lot of resistance. The next level of real resistance is 82.80-83.”

Wilkinson is less confident. “It might try and break through 82, but I see it between 82-81 for the remainder of the year,” he says. “I am not really looking for a substantial move in either direction. If we go off, we don’t go too far and if the dollar comes back, it won’t turn into a dollar rout.”

Chelkowski says, “I would buy the dollar but at a little better level because there is some pain coming.”

Tatje adds, “The dollar just looks the strongest relative to other currencies at this point. We are seeing a shift in strength to the dollar and that momentum will persist. By October, the market may test [the 2013 high]. We could see 83 anywhere from October to November. The key is when the market starts to trade above 82, because there will not only be near-term profit taking from this most recent rally but also longer-term resistance.”

Euro/yen

The euro is not looking nearly as strong as the dollar and that has folks cautious as well. “When it looks too easy it is usually the wrong trade,” Chelkowski says. “Everyone hates the euro here. Everyone is short the euro, but I am a contrarian at heart.” He notes that the euro may make a comeback, but adds, “If euro prints 135, I would be a seller.”

“The euro is weakening because of the geographic proximity (to Russia) and the likely impact on Germany (from sanctions) and therefore the Eurozone as a whole,” Wilkinson says. “But I don’t think the euro will continue to slip. I can see 132 by September but I would not predict anything much lower.”

At that point, Wilkinson would turn bullish. “You can make the argument that the euro would be quite attractive at that point. On the other side of the financial crisis the euro could probably go to 150 but I would not put a time on that.”

Popplewell says it should be an intriguing end to the year. “The equity correction at the beginning of August provided some well-needed volatility and holds out hope for a more normal market. The euro will underperform the dollar and the dollar will outperform the yen.” Popplewell targets 131-129 for the euro.

Where things could get very interesting, judging from our experts, is with the Japanese yen. That is where we have seen the widest variance in opinion.

“There is nothing to cheer for in the yen,” Chelkowski says. “But markets don’t work like that. I would buy yen against Aussie.”

And he is not alone. Popplewell says the low volatility has pushed more traders to the carry trade, which he says is oversubscribed already. “The Aussie and kiwi (New Zealand dollar) benefit from the low rate environment. Those trades are overcrowded [and] will come under pressure by the end of the year.”

Specifically he is talking about a lot of traders long the Aussie and New Zealand dollars and short the yen.

While Popplewell sees an unwinding in the carry trade, Chelkowski has more ominous reasons for supporting the yen.

“I would sell risk, that means you sell the Aussie, you sell the kiwi and you buy yen and you have to buy the dollar,” Chelkowski adds.

He says the problems with the Chinese economy are not over, despite the rhetoric from Chinese leaders and that the correction in equities this August may just be the beginning. “I don’t believe in a global economic recovery. I am bearish on the stock market. We are in a serious scenario. I say 95 on dollar yen.”

“The yen is interesting,” acknowledges Wilkinson. “There was a view that things were getting better—the sales tax had created a whiff of inflation and the economy was staring to move. It was starting to act like a better risk arbiter than the dollar. It even was advancing against the euro, and now it seems to be [under pressure]. It may be ready to resume a march to 105 or 110 on concerns the Eurozone [problems] will roll over to the United States.”

The China wildcard

One of the reasons analysts have varying opinions on the yen, particularly vs. the Aussie, is because that trade is highly dependent on China (see “Wide breadth,” below).

China appears to have weathered its recent economic storm but like all things Chinese, the details are sparse.

“The Chinese economy seems to have turned the corner, which is good for the Aussie,” Wilkinson says. “It is difficult to predict that [the Aussie] is going to suffer when its biggest customer continues to grow at 7% to 7.5%.”

That is if you believe those numbers. “Six to nine months ago everybody was talking about how China was falling apart, now you are hearing that China is turning the corner,” Chelkowski says. “I don’t believe the Chinese numbers; the worst is yet to come. Obviously you would want to sell the Australian dollar.”

Aronovitz agrees that the Chinese data is questionable. “We expect our GDP to come out at 4% and it is flat—they expect GDP at 7.5% and it comes out at 7.5%.”

The larger question is if China will move further to float the yuan.

“The Chinese economy has suffered at the hand of a strengthening exchange rate,” Wilkinson says. “It is a long journey to bring it in line with where it should be. They just don’t want to do that too quickly. Perhaps in an era of stronger global growth they make that transition faster but we are still not clear of the financial recession.”

It’s all about rates

What is clear in the forex world is that there is very little volatility and that is not likely to change until interest rates change, which is why everyone has their eyes on the Fed. “It is really difficult to make currency projections because conventional monetary policy is perhaps dead,” Wilkinson says. “Even though interest rate increases appear on the horizon, there are a lot of “ifs” on the way that [could] actually provoke the fed into tightening. I’m quite concerned that we are going to be in an era of unconventional monetary policy going forward.”

Aronovitz says the one thing that can change expectations is if the economy begins to fail or we see an uptick in inflation. “Inflation is what central banks are paying attention to,” he says.

And after six years of a zero-rate environment it is unclear what tightening will bring or look like.

“The very action of pulling interest rates up will retard economic growth significantly. We have eight years since [U.S.] monetary policy was last tightened, so I don’t know how the economy is going to respond to it,” Wilkinson says. “The traditional catalysts for currency movements are almost redundant because we keep on getting these pushes in yields and we end up pushing back.”

It is unclear how quickly the Fed will move when they do move sometime in 2015. Tatje expects any move to be gradual. “It will be a slow gradual increase in the rates as opposed to a big jump of a whole percent.”

Judging by the Fed fund futures, it will be slow and not come until the end of the third quarter (see “The long wait,” below). It is important to remember that this unwinding has been continuously pushed back. “The long wait,” shows that a year ago Fed fund futures had priced in an interest rate of roughly 1.75% by the first quarter of 2016, now it indicates a rate of less than 1% for that period.

Of course those expectations can accelerate, particularly if the economy improves at a faster pace and if inflation spikes. Nothing lasts forever and that will hold true for the low volatility currency environment.

“The forex market had been handcuffed by the central banks,” Popplewell says. “When the market is quiet for a number of years, there tends to be an upshot in volatility and opportunity. Something we have been craving for a long time.”

While change is inevitable, the question on everyone’s mind is when.

See the original article >>

The Return of the Currency Wars

By David Wessel

When a country’s economy grows too slowly, the standard short-term remedies are to increase government spending, cut taxes or reduce interest rates. When none of those options is available, governments often resort to pushing down their currencies to make their exports more attractive to foreigners (and, these days, to push up import prices and thus bring inflation back up to desired levels).

When the world economy is sputtering, and every big country increases spending, cuts taxes and reduces interest rates, the global economy  benefits from the increase in demand.   That’s the story of 2009.

But when individual countries lean heavily on pushing their currencies down, that tends to shift demand from one place to another rather than increasing the total.  That is a “currency war.”  And we may be on the verge of one. Last time, the emerging markets were doing the complaining; this time, it may be the U.S.  (OK, I’m oversimplifying, but only a bit.)

Japan has already managed to depreciate its currency. The yen is at a six-year low against the dollar.  There is a fine line between pursuing expansionary monetary policy which works (in part) by reducing a country’s currency, and making currency depreciation a primary goal. The U.S. and Europe have tolerated the sinking yen largely because they saw it as part of Prime Minister Shinzo Abe’s broader effort to resuscitate the Japanese economy.

Now the spotlight is shifting to Europe.  Europe is growing painfully slowly, if at all.  Unemployment in the countries that share the euro is 11.5%. Among the under-25 crowd, nearly one in four is out of work.

Standard economics, the sort pushed by the International Monetary Fund, among others, suggests that while Europe addresses its much-discussed structural impediments to economic growth, it also pursue low taxes, more government spending and more expansionary monetary policy. And since short-term interest rates are already at zero, that means something akin to the Federal Reserve’s quantitative easing, the purchase of huge amounts of assets by the central bank to get more money into the economy, rekindle inflation (now at 0.3% in Europe) and nudge investors into private-sector loans, bonds and stocks.

But what appears to be economically necessary is not politically possible. Germany is the heavyweight in the eurozone.  It wants to keep the pressure on southern Europe to reform labor and other regulations, to work harder and to reduce their debts so it won’t bless more expansionary fiscal policy. And for those reasons, plus its historic anxiety about inflation no matter what the circumstances,  it appears opposed to more aggressive European Central Bank action – or, at the very least, it is slowing the ECB’s efforts to move in that direction.

The politics are treacherous.  As Europe leaders fumble and struggle to reach consensus, the public backlash against austerity and slow growth is building.  Euro-skeptic Marie Le Pen (“I don’t want this European Soviet Union,” she told der Spiegel Online in June) has a shot at becoming the next president of France.

So what’s the ECB to do? Push down the euro to try to juice the eurozone’s exports.  That appears to be one of ECB President Mario Draghi’s current objectives, and it’s one he can achieve with words even if he can’t get his policy council to agree on printing a lot of euros.  It certainly is appealing to the French, who’ve long seen the currency as a useful economic instrument.

And the markets are getting the message. The euro, which was trading above $1.38 for most of the spring, has fallen below $1.30 – and Goldman Sachs economists predict it’ll fall to $1.15 by the end of 2015.

For now this isn’t a big threat to the U.S. economy.  The U.S. dollar has been strengthening for some time, initially because nervous investors were looking for safety and more recently because markets expect the Fed to begin raising interest rates from rock-bottom levels next year, well before the ECB does.

Although there are always manufacturers complaining that the dollar is hurting their exports and there are long-standing complaints about China’s manipulation of its currency to favor its exports, the dollar hasn’t really been a big political or economic issue in the U.S. lately.

Perhaps because there has been so much else to worry about; perhaps because the dollar’s attractiveness has helped the U.S. Treasury lure foreigners to lend billions of dollars at very low rates.   U.S. exports have been growing; they contributed 1.3 percentage points to the 4.2% annualized increase in gross domestic product in the second quarter. But that could change if Japan and Europe continue to nudge their currencies down as a substitute for economic policies more friendly to global economic growth.

See the original article >>

Tesla & Bio Tech near short-term support

by Chris Kimble

biotechteslasept15

CLICK ON CHART TO ENLARGE

Tesla and Bio Tech have been great performers over the past 24 months. Earlier this year both of them gave back some of there gains and then started another impressive rally.

Both are making attempts to make strong closes above highs hit 6 months ago, as they both are facing short-term support at this time.

Kind of interesting to see how much these patterns look alike since the first of March this year! How these stocks handle short-term support could have some influence on the future of NDX 100 index.

-See the original article >>

The Illusion Of Permanent Liquidity

by Lance Roberts

AFP (Agence France-Presse) recently printed an interesting piece about the current illusion of permanent liquidity.  To wit:

"Loose monetary policies have created an 'illusion of permanent liquidity' that is spurring investors to make risky bets and push up asset prices, the Bank for International Settlements said Sunday.

This "illusion" has not only been driving investors to make risky bets across the entire spectrum of asset classes; it has also led to the illusion of economic stability and growth. For example, financial analysts have started pushing the idea that the current earnings and economic backdrop will last for another decade. Such an expansion would rival the longest previous period on record (119 Months) from March of 1991 through March of 2001 during the "technological revolution." A repeat of such an expansion would be quite a feat if it were to occur. However, the drivers of declining inflation, interest rates and increasing leverage are no longer available to support such an expansion in an economy driven 70% by consumption.

Debt-GDP-EconomicExpansion-091514

This idea of "infinite liquidity," and the belief of sustained economic growth, despite slowing in China, Japan and the Eurozone, has emboldened analysts to push estimates of corporate profit growth of 6% annually through 2020. Such a steady rise in earnings per share would push levels to more than $183.00 per share. The problem, as shown in the chart below, is that such an earnings expansion has never occurred in history as it completely disregards the course of normal business and economic cycles.

Estimated-Earnings-Growth-091514

(Note: The dashed lines show that earnings have a strong history of ranging, due to the business cycle, between 6% peak to peak and 5% trough to trough.)

It is unlikely given the current scenario of sub-par economic growth, excess labor slack globally and deflationary pressures rising, that such lofty expectations will be obtained. Importantly, it will be the consequences of such a failure that will be the most important.  As the BIS states:

"The longer the music plays and the louder it gets, the more deafening is the silence that follows," Claudio Borio, who heads the BIS's monetary and economic unit, told reporters.

'Markets will not be liquid when that liquidity is needed most,' he warned, urging 'sound prudential policies (and) extra prudence on the part of market participants themselves.'

Many central banks have kept their rates at record lows and pumped their economies full of liquidity first to stave off recession during the financial crisis and then to boost recent anaemic economic growth."

There is a rising realization by Central Banks that these excess liquidity flows have failed to work as anticipated.  The Bank of Japan entered into a "quantitative easing" program nearly 3x the size of that of the Federal Reserves most recent endeavor, or a relative basis, with nothing gained but a near 7% drop in economic growth. Domestically, the Federal Reserve's program has boosted asset prices that has inflated the wealth of the top 10% but left the bottom 80% in a worse financial position today than five years ago. (see "For 90% of Americans There Has Been No Recovery")

"Borio stressed that 'a common mistake is to take unusually low volatility and risk spreads as a sign of low risk when, in fact, they are a sign of high risk-taking. The illusion of permanent liquidity is just a prevalent now as in the past.'

Borio pointed out that years of 'unusually accommodative' monetary policy has left investors feeling secure low interest rates would continue or only be gradually tightened. That confidence has also spread to the international banking industry, where claims rose by $580 billion between January and March, BIS said. That marked 'the first substantial quarterly increase since late 2011.'"

The complete lack of "fear" in the financial markets can be seen in the levels of volatility across virtually all asset classes. The chart below, from Todd Harrison at Minyanville, shows volatility near their lowest levels on record for currencies, equities, and interest rates.

Volatility-USD-Stocks-IntRate-091514

As Todd stated:

"Per the chart below, currency volatility, interest rate volatility, and S&P 500 volatility are compressed across the board. That makes sense in a world where liquidity is artificially infused into the financial fabric -- volatility is the opposite of liquidity -- but not so much as the punch bowl is being taken away. And it is clearly something that is on the radar of Federal Reserve officials given the interconnectedness of the global financial machination."

The illusion of liquidity and complacency, or should I say over-confidence, in the Federal Reserve has driven an unprecedented "yield chase" and an excessive disregard for underlying investment risk. The mistake that is currently being made by the vast majority of Wall Street analysts is two-fold. The first is the assumption that the Federal Reserve can normalize interest rates given the underlying deterioration in global growth currently. The second is that increases in interest rates will have ZERO effect on future earnings or economic growth.

As I discussed recently in "Don't Fear Rising Interest Rates, Really?" there has been no previous point in history where rising interest rates did not only slow the economy, but eventually led to an economic recession, market dislocation or both.

"While rising interest rates may not "initially" drag on asset prices, it is a far different story to suggest that they won't. I addressed this issue previously in "Why Market Bulls Should Hope Interest Rates Don't Rise" wherein I pointed out twelve (12) reasons why rising interest rates are a problem, particularly when those rate increases are coming from a period of very low economic growth.

What the mainstream analysts fail to address is the "full-cycle" effect from rate hikes. The chart and table below address this issue by showing the return to investors from the date of the first rate increase through the subsequent correction and/or recession."

Fed-Rate-Hikes-Outcomes-Chart-082514

The BIS is correct, the "Illusion of Permanent Liquidity" has obfuscated the underlying inherent investment risk. The belief that Central Banks will always be ready to jump in to avert a dislocation in financial or credit markets has emboldened investors to take on an incredible amount of risk.

The problem is that these excessive liquidity flows have only impacted the economic surface. Eventually, the underlying malaise will likely overwhelm the small beneficial effects of liquidity and a mean-reversion will occur. It is only then that investors will come to understand the gravity of the "risks" they have undertaken as the illusion of permanent liquity fades.

See the original article >>

Growth Debt And Secular Stagnation - Implications For The S&P 500

by Lance Brofman
Last October we published "A Very Long-Term View Of Government Finances - Implications For The S&P 500". The forecast extended to 2088 based on macroeconomic data forecasts from the Congressional Budget Office (CBO). From these we developed alternative economic scenarios, and we forecasted profits, the S&P earnings multiple, and thus an index value for the S&P 500 (NYSEARCA:SPY).
The conclusions from that analysis were both negative and potentially positive. On the one hand CBO data forecasts revealed a very negative equity market outlook because the CBO projected that current law would result in a huge increase in government outlays relative to GDP. But on a brighter and more hopeful note we showed that the outlook could be much more positive if GDP growth were just 0.2% per year higher than the baseline CBO forecast.
In July-August this year CBO updated its budget outlook for the 2014-2024 period. We applied this updated outlook to the long term, enabling us to update near and distant budget forecasts and forecasts for profits, the earnings multiple, and the S&P index. As part of this exercise we are integrating issues raised by Dr. Lacy Hunt of Hoisington Capital Management in his recent podcast entitled "The World Economy's Terminal Debt Sclerosis".
Our accompanying Table I shows a comparison between the most recent CBO ten year budget outlook and the outlook it published last year for the same ten year period. As usual the period is forecast on the basis of current law, and the forecast assumes no recession or any meaningful externality. In its update CBO has downgraded its ten year forecast for nominal GDP from an average of 5% per year to 4.5% and for real GDP from an average 2.8% per year to 2.5%. Implicitly it has therefore downgraded its estimate of future inflation as well.
The expectation of slower economic growth weighs on government finances. While the federal budget deficit in 2014-2015 is lower than CBO's year ago forecast, the cumulative ten year deficit is now about $600 billion higher. Because GDP growth is slower and the deficit is higher, by 2024 publicly held debt as a % of GDP is at 74% versus the 70% level that was forecast in last year's report. Finally, CBO forecasts that net interest as a % of GDP is about steady relative to last year's forecast. This is owing to a lower interest rate forecast that is a by-product of slower growth and lower inflation.
This revised CBO outlook is consistent with the mosaic of the U.S. and global economy described by Lacy Hunt in his recent podcast. Lacy argues that the economy is in a vicious self- reinforcing environment of stagnation (a liquidity trap) which is an outgrowth of excess public and private sector debt. In this environment excess debt inhibits economic growth which in turn exerts downward pressure on inflation. Weak inflation in turn depresses aggregate demand, adversely affecting nominal GDP and public sector revenue growth even as the monetary authority drives down interest rates to combat slow growth and low inflation.
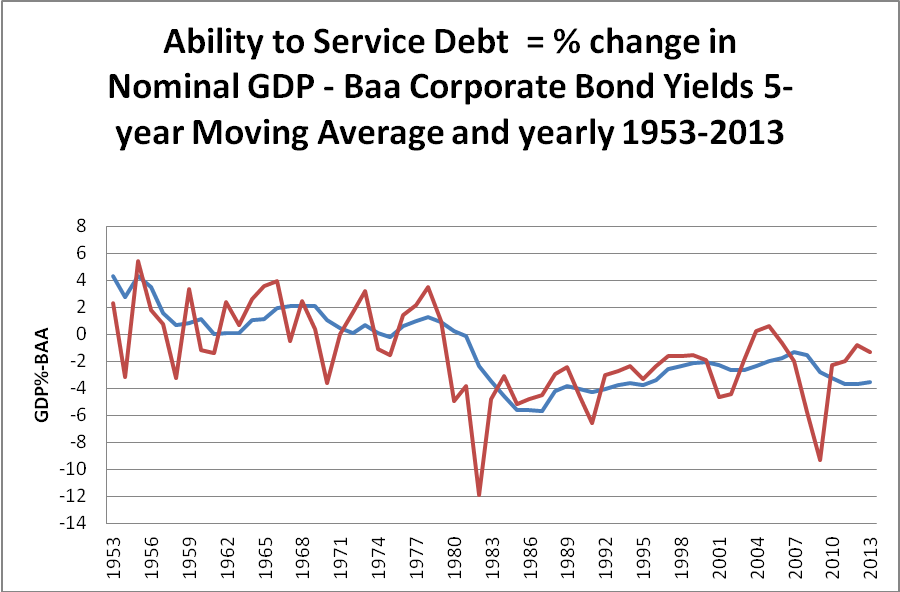
From Lacy's vantage point the guts of the problem is the economy's growing inability to service its debt and the fact that interest rates have not fallen sufficiently to alter the sclerotic demand environment in which the U.S. and global economy is immersed. To illustrate this conundrum Lacy utilizes a relationship codified by the Austrian School of Economics wherein the BAA interest rate is related to nominal GDP growth such that as long as the interest rate is higher than nominal GDP growth, the economy is unable to adequately service its debt, thus prolonging sluggish business activity.
The accompanying Chart I shows a coincident history between the BAA bond rate and nominal GDP growth and a five year moving average of the two for the post World War II period. Coincident data is very jagged because of periodic business expansions and contractions. The five year average smoothes this and makes the trend in the relationship more vivid. On the chart zero is the line of demarcation for debt service with a favorable level being above zero and a worsening debt service climate represented by a below zero reading. On balance whether it be coincident or smoothed data the chart shows that until 1980 the BAA rate was consistently below the GDP growth rate which is a positive for debt service. Since 1980 the opposite has prevailed even as the general level of long term interest rates declined. The debt service proxy hit a low point in 1987 and from there it improved steadily with faster economic growth in the 1990s. But even during the 1990s the economy's ability to service debt deteriorated, and of course it worsened significantly with the onset of recession in 2008-2009 and throughout the past five years of recovery.
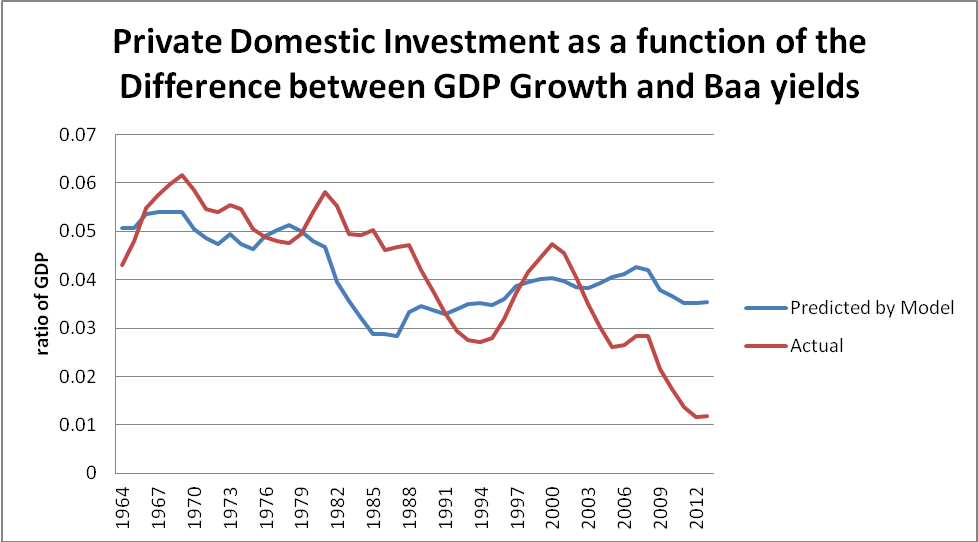
One could identify many channels through which debt service might affect the overall economy. Its impact on business investment would be one such channel so to test this we correlated net domestic investment (the domestic capital spending of domestic companies) with the five year moving average of Lacy's debt service variable. In fact the relationship is direct, meaning the better able that debt is serviced i.e. GDP exceeds the interest rate, the more positive it is for capital spending. The accompanying Chart II shows the historical fit. The relationship is statistically significant, explaining 18% of the variation in capital spending.
The BAA bond rate seems as good a proxy as any for the economy-wide business cost of funds. It works better than the ten year treasury rate in correlations with business investment. Yet it was not as useful as the ten year treasury rate in forecasting the market multiple. We surmise this reflects the presumption that borrowing costs for 90% of S&P 500 companies are close to the ten year rate. Moreover, almost all BAA corporate bonds are callable whereas treasuries are not callable. This gives investors an asymmetry whereby if rates drop, bonds are called but if rates rise, they would most likely not be called.
With this in mind our use of the ten year treasury rate in our short and long term forecasting models of the market multiple seems quite valid. And you will recall that this variable and a forward looking moving average of federal outlays to GDP are the prime ingredients in our forecasting model of the market multiple. Our model for estimating profits includes nominal and real GDP growth and a lagged moving average of unit labor cost in manufacturing.
Last year when we estimated this model to the 2080s we found that eventually the market multiple would fall into the single digits beginning in 2034 and to zero in 2067. With newly revised input data the news is less bad as the model now shows that 2039 is when the multiple swings into single digits.
The prime factor driving down the multiple is an explosion in government's share of the economy beginning in 2025. And in the context of Lacy's analysis this explosion makes it ever more difficult to service debt. This makes a dollar's worth of earnings less valuable, leading to weaker equity prices, a rising cost of equity capital and thus ever slower investment and economic growth.
To date Central Banks have been attempting to improve the GDP-interest rate relation. Their direct method has been zero short term interest rates and quantitative easing. The goal of low interest rates and monetary expansion has been to boost aggregate demand and price inflation, implicitly in this country and explicitly in the case of Japan and more recently Europe. Lacy would argue that while these Central Bank policies are effective intermittently, the effect is transitory and they are doomed to fail.
We are sympathetic to this argument as we have long argued that the U.S. and the global economy is caught in a liquidity trap. Of course Central Bank policies would be more effective if fiscal policies were in sync. But the fact is that over regulation, and tax and spending policies have often been countervailing. Given this we have also long argued that what is needed to break the debt spiral is some new innovation that would spur demand independently of public policies. Growth was facilitated in the 1950s and 1960s with the construction of the interstate highway system and the space race. Thus, the economy was very able to service the debt that was incurred during World War II.
Growth was facilitated in the 1990s by the advent of the internet and advances in computer technology. The 1990s was a rapid growth era even though Lacy's debt service ratio was consistently below zero. This implies that while debt service may be an impediment to growth it certainly is not the only factor affecting economic growth. The same is implied by the correlation between debt service and capital spending. The relation is significant but not conclusive.
The problem is that as debt service is negative and it is allowed to fester, the impact eventually becomes debilitating. This becomes clear when examining the very long term outlook to the 2080s. As noted earlier, upon running our models for the very long term we found that federal outlays to GDP rose to such a degree that it drove the earnings multiple to zero in the 2060s. With newly revised data the news is slightly less bad in that it is not until 2074 that the multiple falls to zero. This we would describe as providing cold comfort at best.
The accompanying Table II shows this and accompanying CBO macro forecast data to 2089. Various measures remain at tolerable levels until the middle of the next decade when they begin to explode. For example, the federal deficit would reach 12.7% of GDP at the terminal date versus about 3% currently and 14.7% in CBO's earlier analysis. Debt held by the public would reach 229% of GDP by 2089 versus 74% currently and 245% in the analysis done last year.
The major drivers of future deficits have not changed either in size or in order of importance. Federally financed health care and interest payments on the federal debt are the two most significant with social security outlays coming in a distant third. Federal health care spending is shown to rise from roughly 4.9% of GDP this year to 14% at the end of the forecast period in 2089. Of the total, spending on Medicare is shown to rise from 3% to 9% of GDP while spending on medical, child health insurance, and Affordable Care Act subsidies rise from 1.9% to 4.7% of GDP.
Net interest payments rise even as interest rates are lower than initially forecast by CBO. Interest payments are projected to rise from 1.3% of GDP currently to 10% of GDP by the end of the forecast period. Of course this increase parallels the rise in the amount of debt held by the public. Net interest payments are untouchable-the obligations have to be met-and there certainly does not and probably will not be any political will to halt the rise in federal health care spending as the population continues to age.
Ominously one cannot convincingly argue that this is even a worst case. Indeed, CBO projects that all federal spending excluding health care and net interest will actually decline from 14.2% of GDP currently to 12.6% of GDP eventually. This is actually a sharper decline than CBO forecast for this category in last year's document. Moreover, considering that social security is in this catchall category and is projected to rise from 4.7% of GDP to 6.9%, the reductions elsewhere are even sharper. Defense is in this category and it is hard to convincingly argue that the world has become a safer place.
Finally, regarding tax policy CBO projects a revenue rise from 17.6% of GDP currently and in the vicinity of the long term average to 23.9% by 2089 or considerably above the long term average. Raising the ratio above the 18.5% average seems very difficult to accomplish in the short term and very likely the long term as well. If Dr. Lacy Hunt is currently fearful of the consequences of the economy's current debt service predicament, he has to be absolutely terrified at the long run outlook that is forecast y CBO under current law.
But a financial disaster is not inevitable. We demonstrated in last year's Very Long Term Outlook how significant an economic growth path that was merely 0.2% per year higher than the CBO forecast could be. Indeed the federal budget deficit would disappear by the mid-2080s and the debt to GDP ratio would shrink to a very manageable 45% in a permanently slightly faster growing economy. With CBO newly revised estimates budget balance could be achieved ten years earlier. Thus, the secular stagnation thesis of Dr. Larry Summers would prove transitory as opposed to secular and Lacy would sleep better at night as the economy's ability to service its debt improved.
Achieving faster economic growth through some combination of faster real activity and higher inflation may be easier said than done. The optimal vehicle for achieving a faster GDP growth path will continue to be a matter of acrimonious debate. But while action seems elusive there does seem to be an emerging consensus that the tax and regulatory apparatus needs to be overhauled and spending needs to be more efficient. This will not be easy or quick and in the meanwhile incentives for growth oriented innovation need to be emphasized in order to boost aggregate demand and propel the economy out of its liquidity trap.

(click to enlarge)
Chart II Actual and Predicted - Net domestic investment: Private: Domestic business as a ratio of GDP 5-year moving averages 1964-2013 as a function of the difference between GDP growth and Baa corporate bond yields
(click to enlarge)
Source: Growth Debt And Secular Stagnation - Implications For The S&P 500
Additional disclosure: Please note that this article was written by Dr. Vincent J. Malanga and Dr. Lance Brofman with sponsorship by BEACH INVESTMENT COUNSEL, INC. and is used with the permission of both.
See the original article >>

Follow Us