Tuesday, April 8, 2014

April 9 USDA Reports: All Eyes on Demand

By: Fran Howard

USDA’s April World Agricultural Supply and Demand Estimates, released April 9, will likely not hold any large surprises due to how quickly the report follows the release of March 31’s Prospective Plantings and quarterly Grain Stocks reports.

Analysts anticipate USDA will lower both U.S. and world ending stocks on corn and soybeans due to strong world demand.

Looking at corn first, analysts expect a carryout of 1.403 billion bushels, down 3.5 percent from March’s 1.456 billion but more than 70 percent higher than last year’s 821 million bushels.

"For this report, we see higher revisions for exports and ethanol," Allendale, a brokerage firm in McHenry, Ill., says in a recent press release.

Others aren’t so sure.

"Traders will be looking for support for the recent rallies," says Chad Hart, grain economist with Iowa State University. May corn futures have increased about 40 cents per bushel since the beginning of March due to strong feed demand, exports, and ethanol production.

"If there is a weak spot, it will probably be in the ethanol numbers," says Hart. Recent logistics problems experienced by the ethanol industry could leave more corn in the carryout number.

The average estimate for the world carryout of corn is 157.72 million metric tons, down slightly from last month’s 158.47 million but 17 percent higher than last year’s 134.67 million metric tons.

Analysts expect USDA to lower corn production in Argentina to 23.95 million metric tons from last month’s 24 million. Brazil production is also expected to drop to 69.66 million pounds from March’s estimate of 70 million tons.

Soybeans

Soybean import and export numbers will also be front and center in April’s WASDE report.

"We are so tight on beans," says Dan O’Brien, economist with Kansas State University. "I’ll be curious to see whether USDA adjusts the import numbers on beans to confirm whether soybean shipments have been coming into the United States to help fill our export commitments."

Analysts are looking for a soybean carryout of 139 million bushels, down from last month’s 145 million and last year’s 141 million. The average forecast for the world carryout is 70.14 million metric tons, down from March’s 70.64 million but substantially higher than last year’s 57.79 million metric tons.

Allendale anticipates USDA to increase both soybean exports and imports.

The average trade estimate for Argentina’s soybean crop is 54.15 million metric tons, up from last month’s 54 million. Brazil’s crop is pegged at 87.43 million metric tons, down more than 1 million metric tons from last month’s estimate. Still, Brazil and Argentina combined are expected to produce 141.58 million metric tons of soybeans, a nearly 8 percent increase from last year’s 131.3 million.

See the original article >>

A Surplus of Controversy

by Kenneth Rogoff

CAMBRIDGE – When the US Treasury recently added its voice to the chorus of critics of Germany’s chronic current-account surplus, it underscored the deep disagreement over what, if anything, should be done about it. The critics want Germany to increase its contribution to global demand by importing more and exporting less. The Germans view the maintenance of strong balance sheets as essential to their country’s stabilizing role in Europe.

Both sides’ arguments will certainly receive a full airing at the spring meetings of the International Monetary Fund and the World Bank. Unfortunately, the debate has too often been informed more by ideology than facts.

The difference between what a country exports and imports can reflect myriad factors, including business cycles, demographics, investment opportunities, and economic diversification. It can also reflect the government’s penchant for running fiscal surpluses; after all, the current-account surplus, by definition, is the excess of public and private savings over investment.

During the first half of the 2000’s, US policymakers chose not to worry about sustained current-account deficits, which peaked at above 6% of GDP. They argued at first that the deficits merely reflected the world’s attraction to superior US investment opportunities, an odd position given that the US was not growing especially quickly compared to emerging markets.

Later, academic researchers identified more plausible reasons why the US might be able to run large deficits without great risk, as long as investors’ desire for diversification, safety, and liquidity sustained global demand for US assets. But policymakers should have recognized that even these better rationales had limits, and that massive sustained current-account deficits are often a blinking red signal of deeper problems – in this case, over-borrowing by households to finance home purchases.

In the case of Germany, of course, we are talking about surpluses, not deficits. And even though the surpluses exceed 6% of German national income and would seem to be on the same order of magnitude as pre-crisis US deficits, one must remember that the German economy is less than a quarter the size of the US (at market exchange rates).

However, as the Center for European Policy Studies’ Daniel Gros has pointed out, the issue is not simply Germany. Smaller northern European countries, including the Netherlands, Switzerland, Sweden, and Norway have been collectively running surpluses at least as large as Germany’s relative to national income, and, in absolute terms, their combined surpluses are even larger. So the issue obviously merits attention. But what is the cause, and is it related to policy?

Certainly, no one can criticize northern Europe for exchange-rate undervaluation. By almost any purchasing-power measure, the euro seems overvalued (and the Swiss franc even more so).

Keynesians look at these surpluses and say that the northern European countries should drive them down by running much larger fiscal deficits to boost domestic demand. They have a point, but they grossly overstate the case. Many studies have shown that changes in private savings and investment tend to offset partly the current-account effects of higher fiscal deficits.

For example, larger German fiscal deficits would hardly have been a decisive factor in Europe. Research by the IMF and others suggests that the demand spillovers from German fiscal policy to Europe are likely to be modest, particularly in the eurozone’s troubled countries, like Greece and Portugal. Germany trades with the entire world.

The European Commission has recently completed its own report on Germany’s surpluses, concluding that it is difficult to pin down the many factors underlying it, which of course is true. For example, Germany’s capital-goods exporters have benefited enormously from growth in China.

The Commission nonetheless argues persuasively that policies to promote public and private investment would tame the surpluses in the short term and strengthen German growth in the long term. One might add that there are still extensive impediments to competition in the service and retail sectors in many northern European countries. Removing them would increase consumption of all goods, including imports.

And Germany is right to point out that its strong balance sheet underpins Europe’s fragile stability today. Would European Central Bank President Mario Draghi’s vow in the summer of 2012 to do “whatever it takes” to save the euro have been nearly as effective if investors doubted Germany’s underlying financial strength and resolve?

At the same time, it is also true that Germany could have been more forthcoming and more liberal in using its balance sheet to defuse debt-overhang problems in periphery countries like Portugal and Greece, and perhaps even Ireland and Spain.

The bottom line is that large sustained external imbalances are something that global policymakers do need to monitor closely, because, as the US housing bust showed, they can be an indicator of problems that need to be investigated more deeply. And critics of the surplus countries are right that there are two sides to every balance, and that policies in both surplus and deficit countries should be subject to review. But it is wrong to believe that simplistic answers, such as more fiscal stimulus or more austerity, are a panacea; more often, the underlying problems relate to debt, structural rigidities, low investment, and weak competitiveness.

See the original article >>

Grains, soybeans turn to weather for price direction

By Allendale Inc.

Corn: Trade certainly put heavy focus on the Monday morning weather maps. Even with trade expecting a slightly bullish USDA report on Wednesday, this corn market spent most of the day moderately lower on a slightly drier forecast. As of Monday, the forecast update showed a 15-day forecast where temps were above average all but three days with light rains in the one- to five-day forecast, moderate rains in the six- to 10-day forecast and heavier rains in 11- to 15-day. On all but the extended maps, the forecast was helpful for a normal planting pace.

Ethanol, which had recently made a strong surge higher, has cooled back off to more “normal” levels in the last week. Trade has not reacted to this ethanol drop just yet but it is worth keeping in mind along with the weather.

On Wednesday, trade is looking for carryout to drop from 1.456 to 1.403. This is an expected and small change, which means that 80% of our focus should still be on spring weather.

If you are a producer who is really going to see delays, look for a couple more weeks of support. If you are realistically going to start planting on time, look for lower trade. This is the time of the year where producers know more than trade what the short-term direction will be…Ryan Ettner

Soybeans: The beginning of the week started just like we finished last week, with liquidation of the bulls spreads dominating the trade action. With the Goldman Roll beginning today, no doubt some in the trade were front running the roll.

News that China had bought 120,000 tonnes of new-crop beans did provide some support for the new crop. The weekly export inspections come in at 509,603 tonnes, down a shade from last week’s 507,533 shipments. Wednesday, the USDA will be updating its supply/demand tables.

Allendale is looking for the old-crop ending stocks to drop by 10 million bushels. We look for the USDA to raise exports by 20 million bushels and offset part of the increase by raising imports by 10 million bushels. The average trade estimate for ending stocks is 139 million bushels with the range being 125 to 147 million bushels. Last month the USDA estimated the ending stocks at 145 million bushels. The average trade estimate for world ending stocks is 70.14 mmt with the range of estimates being 68.5 to 71.9 mmt. Last month the USDA estimated the world ending stocks at 70.64 mmt. The trade is looking for the Argentina bean crop to be estimated at 54.15 mmt. Last month the USDA estimated the crop at 54.0 mmt. As for the Brazilian crop, the trade is looking for it to come in at 87.43 mmt. Last month the USDA estimated the crop at 88.50 mmt.

We look for a choppy Tuesday as buyers will be positioning for Wednesday report. Bear spreading will probably be seen again as the Goldman Roll will be in full force. but with the trade anticipating a “bullish report,” breaks should find support…Jim McCormick

Wheat: Wheat finished Monday higher as rains were disappointing in the plains and a lack of moisture continues to concern farmers. We are also expecting to see ratings much lower than where they were when we entered into dormancy in the fall.

This drop is usually something we will find, but we need to keep in mind rains over the next two weeks will benefit the wheat crop. There are rains in the forecast for the Plains in the 11- to 15-day forecast but these totals continue to be disappointing, and if they remove this system the wheat crop could look really start to show some of the recent stresses.

The Ukraine situation doesn’t appear to be escalating much, but there are some new riots taking places in new Eastern cities, which are continuing to cause unrest as Pro Russia citizens are continuing to promote ideas of being absorbed into Russia. Export inspections were positive as we were above estimates, which could be a result of the stability of U.S. exports compared to those of the Ukraine.

We look for some higher trade as we are sitting around the long-term uptrend and though we broke that trend, we didn’t do it by a large enough margin that it cause funds to cover positions. Funds did add contracts last week, so we continue to look for more upside trade moving forward.

See the original article >>

Growing Unrest in the Eastern Ukraine

by Pater Tenebrarum

Pro-Russian Demonstrations Flare Up Again

Over the weekend, pro-Russian demonstrators became active in the Eastern Ukraine again, inter alia by seizing government buildings, a tactic they have adopted from the Pravy Sektor troopers supporting the 'Euromaidan' protests in Kiev. The idea seems to be: it has been effective in Kiev, so why not in Donetsk as well?

In order to avoid biased reporting of both Western and Russian sources on the events, German-language site 'Russland.ru' says that it is collating information exclusively from sources based in the Eastern Ukraine. While we can obviously not vouch for the reliability of this particular source either, it is no big secret that if one wants to know what is really going on, one has to cast a wide net and not rely solely on mainstream sources. For instance, they point out that the reason for the renewed outbreak of unrest has not been mentioned in the Western press. However, according to Eastern Ukrainian media, the detention and subsequent transfer to Kiev of pro-Russian opposition leader Pavel Gubaryev (also sometimes spelled 'Pavlo Gubarev') in early March has been widely cited by protesters as the trigger of the latest demonstrations.

The site also reports that the demonstrations were apparently much bigger than has been reported in the West. 2,000 demonstrators in Donetsk according to a German TV station became 5,000 according to Ukrainian online news site BigMIR, which it is pointed out 'couldn't really tell lies, as it actually aired a live stream of the event'.

The demonstrations are also quite widespread. Apart from Donetsk, Kharkiv and Odessa, the building housing the prosecutor-general in Lugansk has been stormed, and there were also demonstrations in Mariyupol, Melitopol, Dnyepropetrovsk, the Mykolaiv region  and most recently in Nikolayeva overnight (see this brief amateur video from Nikolayeva). The relatively neutral (but in principle pro-new government) Kiyv Post reports:

“[...] the majority of the population of eastern regions of the country, have remained silently complicit with what is happening, which reflects their attitude towards the change of the central government in Kyiv that took place on Feb. 22, after disgraced former President Viktor Yanukovych fled his post amid the EuroMaidan Revolution.

Only 12 percent of the southern areas of Ukraine and 9 percent of the nation's east say the country is moving in the right direction, according to a nationwide poll by GfK-Ukraine.

(emphasis added)

In other words, the allegation that Russian agents are behind the protests is not standing on overly solid ground. With 91% of the Eastern population disapproving of the new government in Kiev, it seems quite likely that the protests are actually genuine. Besides, the fact that the Kiev government is making these allegations amounts to the pot calling the kettle black. The 'Euromaidan' protests after all started out with active US help (the journalist who started it all was reportedly funded by the US embassy).

Meanwhile, the pro-Maidan government Eastern Ukrainian paper Vesharkiv reports that Yanukovich's 'Party of the Regions' has lost about half of its members and it is (rightly, we believe) suspected that they are joining more radical groups instead.

Pro-Russian Groups Call for Independence in Donetsk and Kharkiv

The latest development is that groups occupying government buildings in Donetsk and elsewhere announced yesterday that they regard these regions as independent as of now and are demanding referendums on independence similar to the one recently held in the Crimea:

“Pro-Moscow activists barricaded inside government buildings in eastern Ukraine proclaimed their regions independent Monday and called for a referendum on seceding from Ukraine — an ominous echo of the events that led to Russia's annexation of Crimea.

The Ukrainian government accused Russia of stirring up the unrest and tried to flush the assailants from some of the seized buildings, setting off fiery clashes in one city. Russia, which has tens of thousands of troops massed along the border, sternly warned Ukraine against using force.

[…]

Pro-Russian activists who seized the provincial administrative building in the city of Donetsk over the weekend announced the formation Monday of the independent Donetsk People's Republic.

They also called for a referendum on the secession of the Donetsk region, to be held no later than May 11, according to the Russian news agency Interfax.

A similar action was taken in another Russian-speaking city in the east, Kharkiv, where pro-Moscow activists proclaimed a "sovereign Kharkiv People's Republic," Interfax said.

It quoted the regional police as saying they later cleared the regional administration building, and the activists responded by throwing firebombs and rocks at the windows and setting tires ablaze. Local news reports said that the pro-Russian crowds then recaptured the building.

(emphasis added)

Why would anyone be worried by people throwing fire bombs and rocks? That's how the recent 'democratic change of guard'  was achieved in Kiev as well after all. Just asking. Of course the situation is indeed worrisome, because Russia may eventually get involved, and then the escalation no-one really wants will be at hand.

The German version of RIA Novosti incidentally reports via an anonymous source that the Kiev government is sending in three 'anti-terror units' to suppress the upheaval in the East, which will allegedly be supported by 'Blackwater mercenaries' wearing uniforms of the special police unit 'Sokol'.

Obviously, there is no way for us (or anyone else) to ascertain the truth of such reports, but pro-Kiev government agents provocateurs are definitely active in the protests in the East. In Kharkiv (according to the pro-Kiev government source 'Ukraininform'), Western Ukrainian nationalist supporters of 'Pravy Sektor' tried to disrupt the the demonstration with baseball bats, firecrackers and rocks, and were subsequently captured and forced by the enraged mob to crawl on their knees. Here is a video of this particular event:

Western Ukrainian nationalists forced to crawl on their knees by enraged pro-Russian demonstrators

So why does the government in Kiev so desperately want to hang on to a region that promises to be a source of endless trouble? The main reason is that both the bulk of Ukrainian industry is concentrated in the East, as well as most of the known fossil fuel resources. In other words, there are very strong economic motives behind wanting to keep control over the Eastern regions, even though they are populated by what are evidently quite recalcitrant people.

It should be noted that all nation states are eager to keep their territorial integrity intact, as size matters, and letting one region go often means others will split as well (few citizens really want to live in a large centralized state). Russia is no different, as the Chechen war demonstrated.

Currencies:

The Ukrainian hryvnia is at new all time lows, in spite of the recently announced IMF loans and other Western financial support measures:

Hryvnia, weekly

The Ukrainian hryvnia, weekly chart – the currency once again hits a record low – click to enlarge.

The Ruble has stabilized in recent weeks, but has been weakening slightly again in recent days, as the flaring up of unrest in the Eastern Ukraine introduces fresh uncertainties. However, the new trend toward a firmer ruble still appears intact at this point:

Ruble, daily

The Russian ruble, daily: weakening again in recent days, but the move so far looks like a corrective counter-trend move – click to enlarge.

Conclusion:

This is a situation that could easily get out of hand. We don't believe Russia's leadership is really interested in intervening in the Eastern Ukraine, as that would produce a far greater headache than the annexation of the Crimea (which was largely motivated by wanting to keep control of the Sevastopol port and could at least be justified on historical grounds), but it can obviously not be ruled out in case the unrest in the Eastern regions of the Ukraine gets further out of hand. The Russian proposal (which all concerned have so far studiously ignored) to create a federal political structure in the Ukraine that delegates some political power to the regions and grants them a degree of autonomy looks better by the day.

See the original article >>

Gold Miners Index: Domed House and Three Peaks Chart Pattern

By: Trader_MC

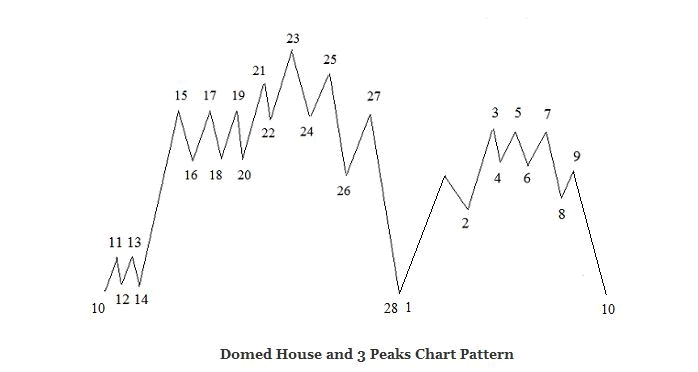
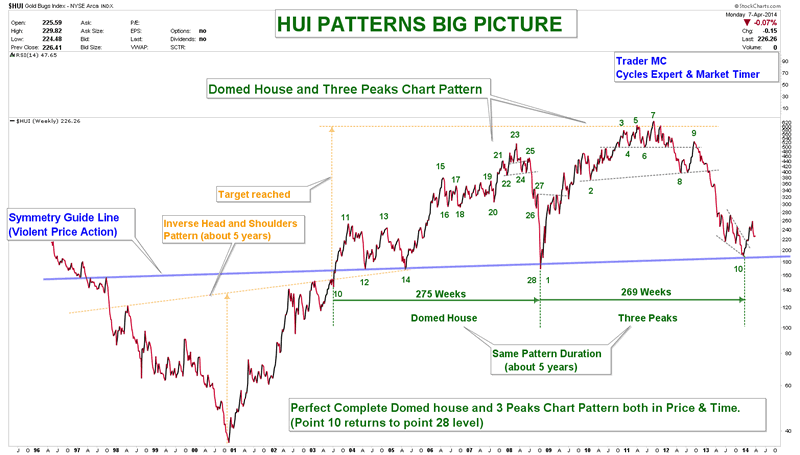
The Miners Index has made a perfect Domed House and Three Peaks Chart Pattern. This pattern, discovered by a stock market analyst, George Lindsay, can be found in multiple timeframes. On the following charts you can see the model of the Lindsay’s Domed House and Three Peaks Pattern, as well as the current chart of the Miners Index (HUI). You can notice that the HUI Index has made a perfect Domed House and Three Peaks Pattern during these last ten years.

On the right side of the HUI Patterns Big Picture chart you can see that the three peaks (3-5-7) were followed by two strong waves decline into point 10. This down move defined the “separating decline” as prices separate the Three Peaks from the rest of the formation. Point 10 returned to point 28 and prices rebounced strongly on the Symmetry Guide Line as they normally do.

You can also notice that the Domed House Pattern (275 weeks) lasted almost for exactly the same period as the Three Peaks Pattern (269 weeks). The Domed House and Three Peaks Pattern is now complete as final point 10 returns to points 28-1 level. I have been following this pattern for a long time and it is important to monitor such chart formation as it plays an important role in the market.

Lindsay Domed House and 3 Peaks chart Pattern

HUI DOMED HOUSE AND 3 PEAKS CHART PATTERN APR 7

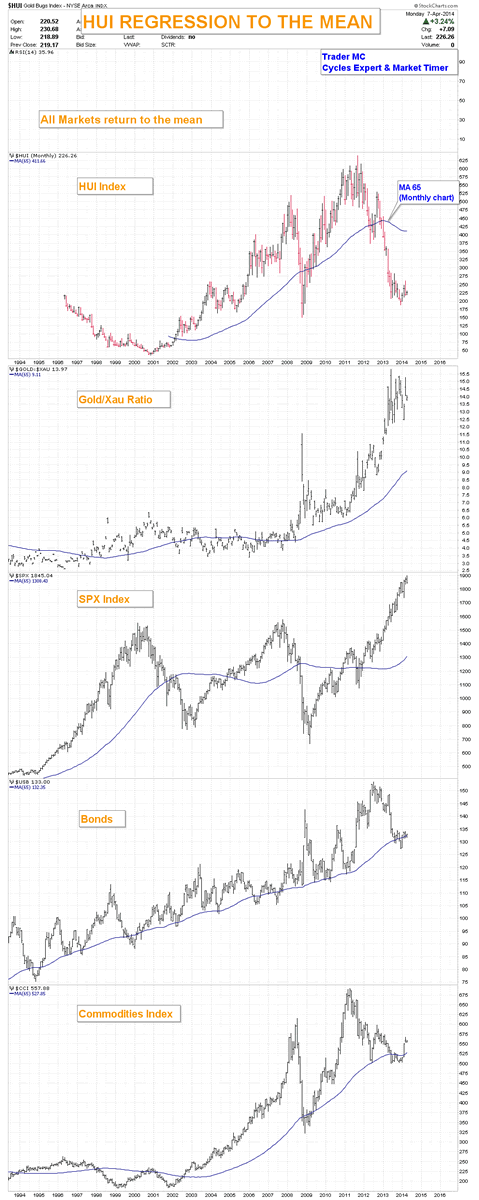
As you can see, both the Domed House and the Three Peaks Patterns have violent up moves, followed by strong reversals. In order to understand how the market works, it is important to keep in mind that all markets return to the mean. On the charts below you can see that the HUI Index, the Gold/XAU ratio and the SPX are far stretched from the 65 Monthly Moving Average. Every time it happened in the past, it generated a violent regression move which is a normal reaction for a market that has been too extreme. (I also included the Bonds and the Commodities charts as additional examples.) These charts are suggesting that odds favor an upside move for the Miners and a correction for the SPX Index on the intermediate term trend.

HUI MA 65 MONTHLY APR 7

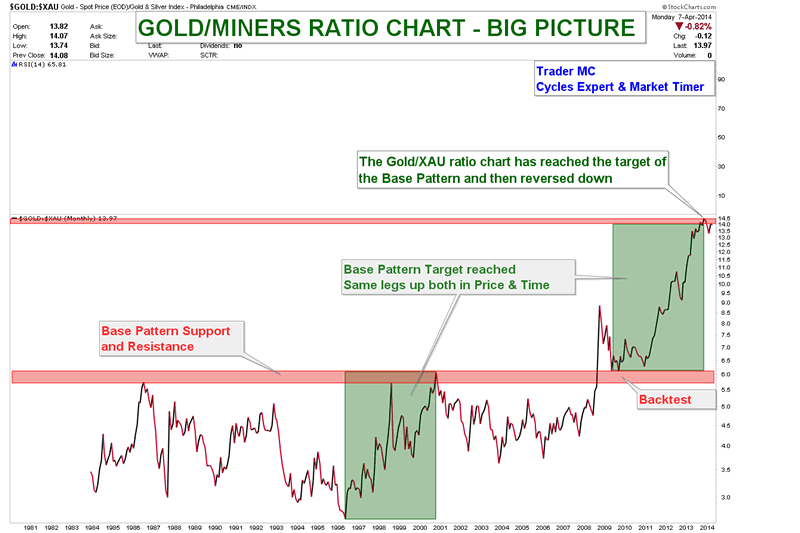
The next chart shows that the Gold/XAU ratio has reached its Base Pattern target and has a lot of downside potential. The vertical moves show how badly the Miners have performed to Gold these last two years. A regression to the mean may result in a violent down move and the Precious Metal stocks could strongly outperform the Gold Metal.

GOLD XAU RATIO CHART APR 7

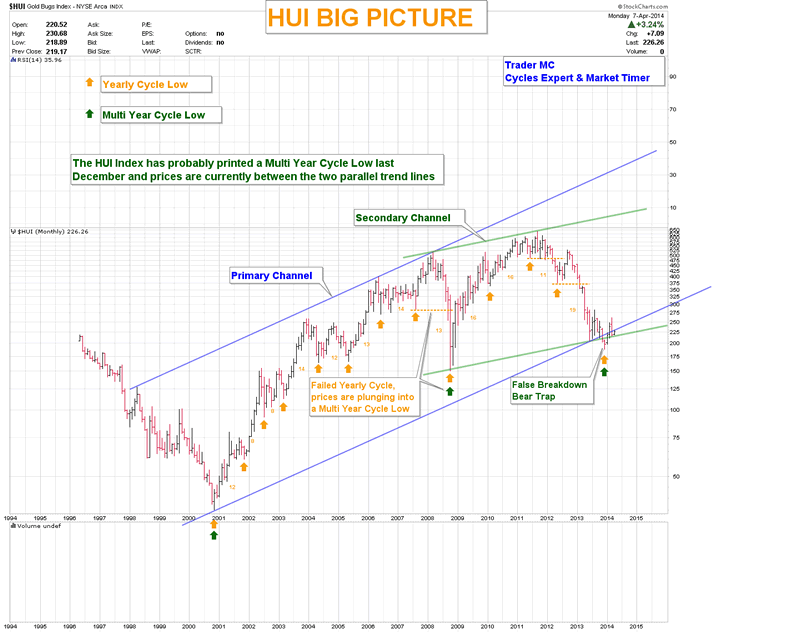
Here is another chart of the HUI Index where you can see that prices are between the two major parallel trend lines. The false breakdown last December looks like a bear trap and could have been a Multi-Year Cycle Low as it was late in the timing band for the HUI to print a Yearly Cycle Low. The lower blue trend line of the primary channel is still acting as a resistance and needs to be monitored closely. If prices go back into the blue channel, it would be a bullish sign for Miners.

HUI BIG PICTURE APR 7

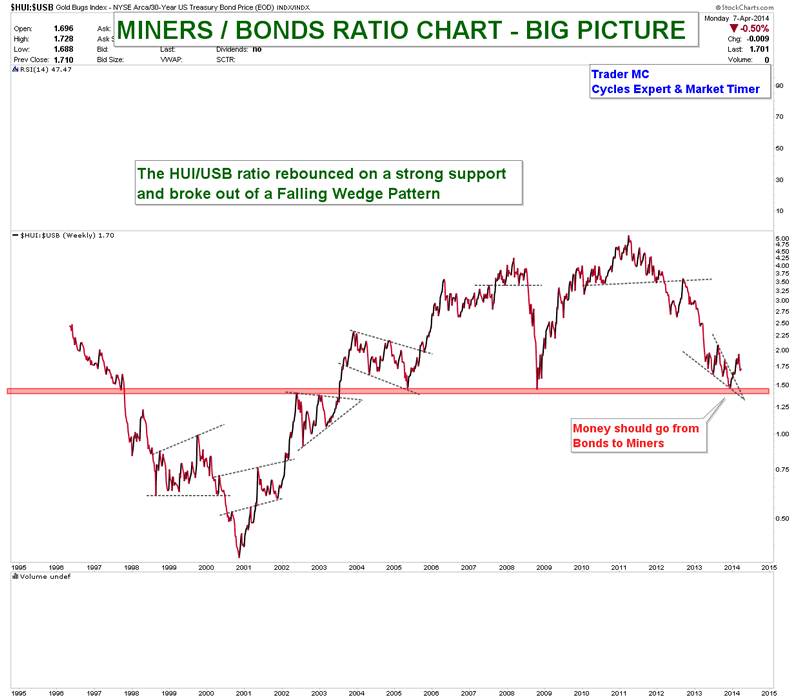
Next is the Miners/Bonds ratio chart. You can see that the HUI/USB ratio rebounced on a strong support and broke out of a falling wedge. Miners are outperforming Bonds and I expect more and more investors to leave the Bonds sector and to come into Miners during the coming months.

MINERS BONDS RATIO CHART APR 7

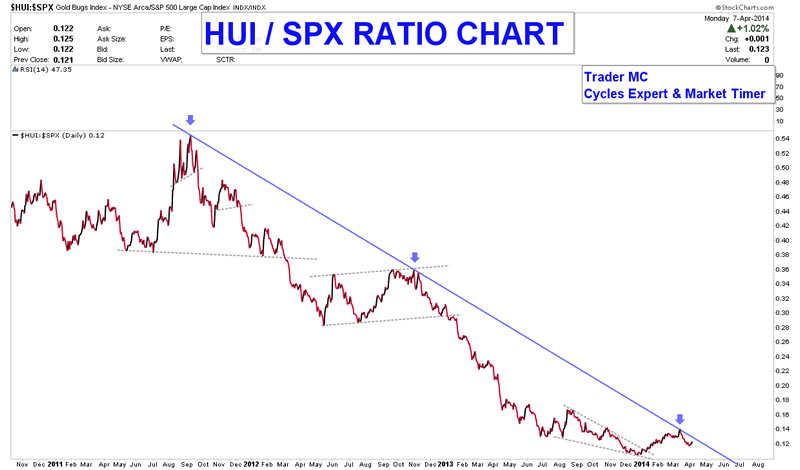
It is also interesting to keep an eye on the HUI/SPX ratio chart. Once a breakout of the resistance trend line occurs, Miners will be more attractive for the investors than the SPX Index. The HUI/SPX ratio got rejected right on the resistance trend line last month but the next attempt could be a successful one.

HUI SPX RATIO CHART APR 7

Irrationally low prices are the greatest opportunities for the investors, as all markets return to the mean. For the moment, I think that we have a decent bottom in place but nobody can predict the markets with 100% accuracy as they are irrational and like to push things to the extreme. I therefore cannot rule out the possibility of one more down move in Miners – in order to bring extreme pessimism – but if it happens then I expect it to be very brief, as the regression to the mean forces should play out and that would result in a great buying opportunity.

See the original article >>

The ONE Revelation About HFT Programs That Truly Scares Bankers (It's Not Stock Market Rigging)

by smartknowledgeu

Last week, the big story was how bankers use HFT (High Frequency Trading) algorithmic software not only to rig markets but also to commit theft on a daily basis (Frontrunning, like Quantitative Easing, is just fancy Wall Street lingo to disguise its true meaning of theft).  Though many among the naive in the public blogosphere expressed shock that stock markets are rigged and that regulators like the Securities Exchange Commission willingly allow this theft to occur, the only thing shocking about this story was how long it took this story to reach the mainstream and that people were crediting Michael Lewis with uncovering this story with his book “Flash Boys” when in reality this story had been discussed in detail on independent financial media sites for more than five years already.

For example, an accounting professor at the Yale School of Management, X. Frank Zhang, calculated that HFT trading was responsible for a minimum of 70% of all daily trading volume in US stock markets and possibly for as much as 78% of the volume in 2009. And HFT algorithmic trading was already dominating daily trading volume on US stock exchanges prior to 2009.  Thus one can clearly see that the only thing “new” about HFT algorithms is that this old news has finally moved into mainstream media headlines.

BATS CEO William O’ Brien, when confronted on MSNBC last week with the fact that HFT algos commit millions of acts that are specifically prohibited by the US Securities and Exchange Commission’s Regulation NMS, a regulation that requires brokers to guarantee customers the best possible execution of price on orders, ludicrously argued that HFT programs have no clients (David Cummings, a computer programmer that worked at the Kansas City Board of Trade, founded BATS, a stock exchange located in Lenexa, Kansas. The core code of BATS was derived from tradebot, a computer program that engages in algorithmic trading). There is only one possible way that O’ Brien’s claim that HFT programs “have no clients” can be true. If the HFT programs were artificially intelligent self-aware programs that made all decisions independent of the interests of the people that coded them and the bankers that used them, then perhaps O’Brien’s claim could be partially true. Otherwise, as long as bankers hire programmers to code HFT algorithms and employ them for their benefit and to the disadvantage of their competitors as well as the disadvantage of their clients, then the obvious clients of HFT programs are bankers and the companies that entice bankers to use them. To claim otherwise is simply a flat-out lie.

In any event, the Holy Grail that the bankers are seeking to protect is not that they use HFT programs to rig stock market trading.

The real truth the bankers wish to conceal from the public is that they use HFT programs to suppress gold and silver prices.

If this truth made it into the mainstream news and was being discussed at the same level at which HFT programs being used to rig millions of stock trades is being currently discussed, bankers would have a heart attack. However, do not let the complete media blackout of the banking cartel’s use of HFT algos to control gold and silver prices in the paper derivatives markets lead you to falsely conclude that the use of HFT programs are not critical to gold and silver price suppression.

There have been many instances in the past several years when it has been crystal clear that bankers were using the processing speed of HFT algorithmic programs to create waterfall declines in gold and silver prices that would have been impossible to create without them. In fact nearly six years ago, in 2008, I sent then US CFTC Commissioner Bart Chilton evidence of gold price slams in the New York market that would have been impossible for bankers to create without the use of HFT algorithms. Click on the following link to see the evidence I provided to Bart Chilton back then, in which gold prices literally were slammed at market open in New York in a matter of minutes by $30, $40, $60 and even more, almost always at the same exact time in New York, as well as his reply.

It was Bart’s reply in 2008 in the above link that led me to write him off as possibly being someone that would take action against the bankers’ immoral and unethical use of HFT programs to suppress gold and silver prices in paper derivative markets, and his retirement in December 2013 without any inroads being made to prevent bankers from using HFT algos to artificially slam gold and silver prices confirmed that my assessment six years ago was the correct one. In any event, though back then I couldn’t prove beyond a shadow of a doubt that bankers were using HFT algos to slam the price of gold and silver on the particular days of steep price declines that I presented to Chilton, NANEX has provided data in recent years that have confirmed my previous suspicions.  Let’s take a look at a couple of scenarios in which evidence is clear that bankers are using HFT algos to manipulate gold and silver prices, and I will further explain how bankers use HFT algos to create unnatural and artificial, non-free-market rapid waterfall-like declines in gold prices similar to the ones that I presented to Bart Chilton in 2008. Since I am not a coder that designs HFT algorithms, there may be some finer details in the process that I may not explain perfectly correctly below, but from my experience in tracking gold and silver prices for over a decade and the research that I have done, I believe that the bulk of my description is accurate.

On February 29, 2012, at 10:47:21 the GLD dropped by about 1% in less than 1/3 of a second, and on March 20, 2012 at 13:22:33 (1:22:33 p.m. ET) the quote rate in the ETF symbol SLV sustained a rate exceeding 75,000/sec (75,000 quotes per second) for 25 milliseconds (25 thousands of one second) and also dropped by a significant amount in less than a second. (Source: The Gold Cartel: Government Intervention on Gold, the Mega Bubble in Paper, by Dmitri Speck).   To put this in perspective, if the US S&P 500 index drops by 1% over the course of an entire day’s trading session, this event makes news on the headlines of every mass media US financial website. Now imagine if the S&P500 lost 1% in less than 1/3 of a second, how widely covered such an event would be? So why did these events in the gold and silver markets receive a total blackout from the US mass financial media? And why would artificial quote stuffing rates of 75,000 quotes per second executed by bankers using HFT algorithms allow the price of silver to be manipulated and suppressed? First, consider if humans, and not supercomputers, provided all trade quotes in the SLV. The quote rate would have been less than one every few seconds, and nowhere close to the HFT program rate of 75,000 per second. So what is the purpose of  HFT algo quote stuffing?  To explain it as simply as possible, bankers that use HFT algos to produce quote stuffing events provide quotes that they never expect to execute. In other words, bankers produce quote stuffing events to serve as exploratory probes to see if anyone reacts to the false quotes they produce that are never even real orders. Since bankers use supercomputers located right next to the stock exchanges to run their HFT programs, their goal of providing fake bids (or asks) is to see if there is anyone trying to sell (or buy) at that price.

As a hypothetical example, if the price of silver were falling on a particular day, and the bankers wanted to see if anyone wanted to sell any silver futures contracts at the silver equivalent price of $20.10 an ounce, they could produce a fake bid that amounts to a price of $20.10 per ounce per futures contract. This fake bid then may produce a sell order for 10 contracts and another one for 20 contracts. Since each futures contract represents 5000 ounces of silver, the notional amounts represented by 10 and 20 contracts are respectively over $1MM and $2MM. So now that the banker run HFT algo knows that a couple of parties are interested in selling a large amount of silver derivatives at $20.10 an ounce for silver, the HFT algo would immediately withdraw or cancel all of its “exploratory bids” and use this information of selling interest in silver futures contracts to immediately re-price its bid to the silver equivalent price of $20.05 per futures contract. The HFT algo can then “see” if sell orders come back on line reduced to a price that amounts to $20.05 per ounce of silver. However, if the HFT algo spots 1,000 silver futures contracts that exist with orders to sell if silver hits $20 an ounce, the HFT algo will attempt to trigger all the stops if the bankers’ aim is to cause a waterfall price decline in the price of silver and will execute the wash, rinse and repeat cycle time and time again.  In other words, once they know the sellers are chasing the price lower, the bankers would program the HFT algo to again immediately withdraw the bid at $20.05 and re-set it at $20 an ounce knowing that 1,000 more contracts will be automatically triggered to sell at this price and consequently  send the silver price plummeting much lower than $20.  How? Because as the stop losses are triggered, the banker programmed HFT algo can play the same game with those 1,000 orders and make every subsequent sell order chase the price of silver lower. Of course, these HFT algos have been programmed to make these decisions  in milliseconds of time, faster than a human eye can see, and do not have a banker literally instructing the algo to pull bid quotes once a sell order that matches that quote comes in.  Still, a real person had to program an HFT algo to make split-second decisions based upon information it gathers with a specific goal in mind, either to ratchet down gold and silver prices or to ratchet them up higher depending on their clients' (the bankers) motives. Furthermore, since HFT algos are quote stuffing at rates in the tens of thousands per second, I realize that the step down increments in reality may be smaller but this is just a hypothetical example to provide an idea of how bankers can use HFT algos to rig gold and silver prices lower.

And the beauty of this entire HFT algo scam? Bankers can create a waterfall decline in the price of silver in the above hypothetical scenario before possibly even having to execute a single trade and trigger massive declines in price just by triggering a couple of trades! Thus, in the above scenario, once the orginal two selling parties take the bait and move their sell orders down to $20 an ounce per contract, the silver rout would be on. Using a poker analogy, trading in gold and silver paper derivatives against bankers that use HFT programs is like showing the bankers all of your cards every hand. You simply cwill not win against such a rigged system as long as you fail to realize that the bankers can see your hand through the use of fake quote stuffing. Or in other terms, the rigging is so egregious in gold and silver derivative markets, that if bankers were rigging a poker game in Las Vegas to the degree that they rig gold and silver futures markets, they would be taken into a back room in Vegas by casino security and well, you know the rest of what would happen next.

I suspect that this method of using HFT algos to quote stuff and pull bids (which is illegal for a human to do, but acceptable for a human employing an HFT algo to do, if that makes any sense) is the primary method by which bankers create vacuums in gold and silver derivative markets to create the types of artificially-induced, non-free-market waterfall price declines evident in the charts I sent to Bart Chilton in 2008, and that have happened every year since, especially with great frequency again in 2013. In fact, prior to last year, 2008 was the last year in which the Western banking cartel interfered with gold and silver markets to an excessive level, as can be seen in the below chart in which daily declines in gold’s paper price over 2% in less than 20 minutes spiked to 12 days (chart courtesy of Dmitri Speck of GATA). Again, this happened a dozen times in 2008 and yet was never covered one time by the mainstream financial media. Imagine if the FTSE 100 or the S&P 500 declined by 2% in less than 20 minutes just one time? This would be the lead story of every financial site around the world (this oddity alone should clue you as to with exactly whom the allegiances of the mainstream financial press lie).


au2in20

So now we know why bankers use HFT algos to create fake quotes in gold and silver derivative markets to artificially move prices, but why would bankers have to create 75,000 fake quotes per second? Think of massive volumes of quotes as traffic on a two-lane highway. If there are not many cars, you can get from point A to point B fairly quickly. However, if I wanted to prevent you from reaching your destination and could re-route 75,000 cars to occupy the lanes in front of you, it would obviously take you much longer to reach  your destination. Bankers that use HFT programs to quote stuff essentially have the same goal, but think of the destination in the stock market as the ability to process information. When bankers use HFT programs to create massive volumes of artificial traffic, not only do they effectively slow down the rate of processing information down for all others, but it also raises the cost to process information as well as masks the fraud committed by the HFT programs as no information can be obtained while they provide tens of thousands of fake quotes per second. Thus, the use of HFT algos to quote stuff makes it much more difficult for competing algos, and certainly human beings, to understand that their buy and sell orders are being skimmed for illicit profits by bankers. In other words bankers can use HFT algos to create waterfall declines in gold and silver prices in a step-down manner when they are buying and likewise, when selling, can use them to get traders to chase prices higher in a step-up manner, all without a single trade even executing before prices have been moved well lower or higher.

I have laid out in the graphs below provided by NANEX, evidence of bankers that have used HFT algos to create a step-down price decline in the price of gold on January 6, 2014   $1245 to below $1215 in less than a minute. In fact, one can clearly see the HFT algos in action in the step-down price action that happened in gold derivative markets this day as the algo was so precise that it caused the exact same number of total trades in each step-down in price. Furthermore, one can clearly see in the below charts that algo quote stuffing can sometimes cause trading platforms to completely breakdown and come to a complete halt in trading.

30inlessthan1min

stepdown

tradinghalt

I want to make it crystal clear to people that the bankers using these algos and the firms employing these algos are the ones that are stealing from people and profiting from the losses they artificially inflict upon their clients. Bankers always try position all blame for all uncovered fraud and immoral activities solely on "out-of-control" technology as if the technology is somehow beyond their control. The meme that all the mass media has used last week when discussing HFT algos is that it is really not that bad because if it were, it would not be “legal”. Forget about the fact that banking and finance industry lobbyists spent nearly a quarter of a billion dollars in 2013 alone to influence law making and that much of this money is spent to make once illegal behavior legal if it benefits the banks.

In the end, it is not the speed of trading that is the problem, but rather how bankers use supercomputers that process and execute information at super speeds to create artificial, fake quotes and steal from people. Thus the problem lies squarely not with out-of-control technology but with out-of-control unethical bankers that are merely crooks in $3,000 Armani suits. Furthermore, it is not the revelation that bankers are using HFT programs to rig stock markets that scares bankers, but the possibility that the current scrutiny on immoral HFT programs may reveal that bankers use HFT programs to rig the prices of gold and silver that truly puts the fear of God in them. For if this revelation goes mainstream and gold and silver prices are freed from banker executed HFT manipulation, every asset bubble that bankers have created since 2008 will come tumbling down as rapidly as their artificially-created waterfall one-minute price declines in gold and silver futures markets. However, as long as scrutiny remains high on the Western banking cartel's use of HFT trading algorithms, their ability to use these algos to slam gold and silver prices may very well be temporarily impeded.

Hopefully, the class-action anti-trust lawsuit against the five international banks that set the London daily gold price fixings that was filed the last week of March, 2014 in the  US District Court of New York by the Philadelphia law firm of Berger & Montague and the New York law firm of Quinn, Emanuel, Urquhart, and Sullivan will shed some light on how big global banks have colluded with Central Banks to additionally use HFT programs to fix gold and silver prices lower.

See the original article >>

Follow Us