Monday, March 24, 2014

The S&P 500 bullish ride could be over

By Gregor Horvat

S&P 500 Daily: Wave five reversing from resistance zone

The S&P 500 has been in bullish mode since February but it looks like that the direction of a trend could be changing now after a rally up to 1880/1920 Fibonacci and channel resistance area, where we see zone for a completed fifth wave in wave 5) of (3). So far, market is reversing nicely down with a weekly close price at 1839 so we suspect that market will continue to the downside now for a three wave pullback down in blue wave (4). We are also looking at the RSI that is reversing from 60/70 area that can be signaling for a bearish pullback, similar like in the past few months.

GOLD Daily: Triangle; now wave C down

On gold, we presented you a triangle idea few weeks back, with wave C rally up to 1380/1400 resistance area. Market sold of sharply from that levels last week and it seems that price is ready to continue lower in the next few days and weeks as current decline looks impulsive on the intraday basis. With that said, we suspect that wave D is now underway that may reach revels even around 1240/1270.

OIL Daily: Wave B at the support zone

Crude oil turned bearish as expected in March after hitting 105.00 level where we see a completed wave A, so current leg down is most likely wave B that may form a new based for this market around 61.8% retracement level. A bounce from that zone, in impulsive fashion, will put wave C in play for rally up to 106.00 area to completed wave 2).

Further weakness from current levels and down to 94.00 in impulsive fashion will suggest an early reversal in trend of crude oil. In that case we would put alternate count in play; completed wave 2) 105.10.

See the original article >>

Ukraine crisis may cause grain export 'bottleneck'

by Agrimoney.com

Ukraine grain exports could face a "bottleneck" next season if Moscow imposes strongarm tactics on a three-mile-wide stretch of water next to Crimea, SovEcon warned, as it forecast further rises in Russian wheat prices.

Russia's annexation of Crimea risks costing Ukraine not only the grain export capacity in the region itself but in its two eastern ports of Mariupol and Berdyansk.

These ports open not directly onto the Black Sea, but onto the Azov Sea, requiring vessels to negotiate the narrow Kerch Strait between Russia and Crimea to reach Ukraine's grain export buyers, largely in the Middle East and North Africa.

'Ukraine bottleneck'

"I hope it does not happen, but now that Russia controls both side of the Kerch Strait, it if wanted to introduce, perhaps, a levy on exports passing through, it could do that," Andrey Sizov Jr, managing director at Moscow-based SovEcon, said.

"That might cause Ukraine some issues.

"Looking longer-term, Ukraine might become a bottleneck for new crop shipments," which would be forced to pass through the western ports, such as Odessa.

Ukraine, with capacity for some 40m-45m tonnes in grain exports, has had more than adequate capacity for its shipments, which the government has pegged at 33m tonnes for 2013-14.

However, it has lost some 4m-4.5m tonnes with the annexation of Crimea, and the loss of Mariupol, with capacity for 12m tonnes of cargos of all varieties, and Berdyansk would curtail further any excess.

Prices to rise

The comments came as Mr Sizov forecast further rise in the price of Russian grain prices, which for benchmark 11.5% protein supplies ended last week at $295 a tonne, up some $10 a tonne week on week and above an early-February low of $270 a tonne.

Prices have been buoyed by, besides stronger international values, a switch by traders to "fulfilling their obligations" for grain deliveries from Russia, rather than Ukraine, for fear of disruption.

With a weakening of the rouble also paying farmers to hold crops, which are denominated in dollar, rather than sell, growers have moved to "suspend" their sales in expectation of better prices ahead.

"Prices will keep rising for the next couple of weeks, at least."

'Hard to maintain positive margins'

Indeed, farmers' reluctance to sell looks likely to keep Russian prices rising for now, even if international values retreat, "whatever happens over Russia and Ukraine, and whether any new sanctions are imposed against Russia", Mr Sizov told Agrimoney.com.

"The market has its own dynamics, momentum."

This could mean traders swallowing losses on Russian exports, which are likely to maintain decent volumes next month because of orders already booked.

"It will be hard for traders to maintain positive margins when exporting grain," he said.

However, prices are approaching the $300-a-tonne level which has represented something of a ceiling to cash values in recent months.

See the original article >>

Gold falls to 4-week low

By Debarati Roy and Nicholas Larkin

Gold (COMEX:GCJ14) futures fell to a four-week low after the outlook for higher U.S. interest rates damped demand for the precious metal as a store of value. Palladium (NYMEX:PAM14) rose to a 31-month high on supply concerns.

Federal Reserve Chair Janet Yellen said on March 19 that that the central bank’s benchmark rate may rise about six months after monetary stimulus ends, expected later this year. Policy makers announced the third $10 billion cut in monthly bond purchases, and gold last week dropped 3.1 percent, the most since November.

“People don’t want gold in a rising interest-rate environment,” David Meger, the director of metal trading at Vision Financial Markets in Chicago, said in a telephone interview. “While concerns about Crimea remain, there has been no escalation in violence for people to jump back into the safe- haven asset.”

Gold futures for June delivery fell 1.4 percent to $1,317.80 an ounce at 10:29 a.m. on the Comex in New York. Earlier, the price touched $1,314.60, the lowest for a most- active contract since Feb. 20. Trading was 42 percent above the average for the past 100 days for this time, data compiled by Bloomberg showed.

Through March 21, gold climbed 11 percent this year on signs of a faltering global economy, while Russian President Vladimir Putin completed the annexation of Crimea.

Fed Stimulus

Gold rose 70 percent from December 2008 to June 2011 as the Fed pumped more than $2 trillion into the financial system and cut interest rates to boost the economy. Jeffrey Currie, head of commodities research at Goldman Sachs Group Inc., said this month that the chances are increasing the metal will drop below $1,000.

“Gold began to move south again as macro funds liquidated what has proven to be a fairly profitable trade in recent weeks,” Morgan Stanley analysts led by Adam Longson said today in a report. “The change in tone from the Fed on the timing of the tightening cycle prompted another leg down.”

Last year, gold fell 28 percent, the most since 1981, as U.S. equities rallied to a record and inflation remained muted.

Palladium rose on concern that the prospect of more sanctions by the U.S. and the European Union against Russia, the world’s top source of the metal, will reduce supplies.

U.S. Sanctions

World leaders gathered in The Hague to discuss Ukraine amid growing concern over a Russian buildup on its neighbor’s border. President Barack Obama authorized potential future penalties on Russian industries, including financial services, energy, metals and mining, defense and engineering.

Palladium futures for June delivery rose 0.3 percent to $791.75 an ounce on the New York Mercantile Exchange. Earlier, the price reached $802.45, the highest since Aug. 3, 2011.

Absa Bank Ltd., a unit of Barclays Plc, plans to list NewPalladium, an exchange-traded fund, in Johannesburg on March 27.

“A perfect storm has been brewing for palladium this month,” UBS AG said today in a report, citing the ETP, a strike by miners in South Africa and Russian concerns.

“If no resolution is found in South Africa in the next few weeks, we think metal tightness will only intensify if producers are forced to source metal in the market,” the bank said.

Silver futures for May delivery fell 0.8 percent to $20.155 an ounce on the Comex. The price dropped for the sixth straight session, the longest slump in almost a year.

Earlier, silver touched $20.01, the lowest since Feb. 11. Last week, the metal dropped 5.2 percent, the most since mid- Sept.

Platinum (NYMEX:PLJ14) futures for April fell 0.1 percent to $1,435 an ounce on the Nymex.

See the original article >>

Cocaine-Filled Condoms Intercepted On Way To Vatican

by Tyler Durden

Despite Pope Francis' recent attempts - mostly for media and public consumption, if not so much in actuality - to clear out decades of corruption at the Vatican including shady financial backroom dealings, involving countless global banks, some very odd things continue floating up to the surface. Like condoms filled with cocaine.

From AP:

German customs officials intercepted a shipment of cocaine destined for the Vatican in January, weekly Bild am Sonntag reported Sunday.

Officers at Leipzig airport found 340 grams (12 ounces) of the drug packed into 14 condoms inside a shipment of cushions coming from South America, the paper, reported citing a German customs report. It said the package was simply addressed to the Vatican postal office, meaning any of the Catholic mini-state's 800 residents could have picked it up.

Not surprisingly, nobody at the Vatican stepped up to laim the 14 condoms. Especially since they appear to have been tipped off.

The paper reported that a subsequent sting operation arranged with Vatican police failed to nab the intended recipient. No one claimed the package, indicating that he or she was tipped off about the plan. The drugs would have a street value of several tens of thousands of euros.

A spokesman for the German Finance Ministry, which oversees the customs office, confirmed the report. Prosecutors in Leipzig planned to issue a statement Monday providing further details, Martin Chaudhuri told The Associated Press.

Vatican spokesman the Rev. Federico Lombardi confirmed that the Vatican police had cooperated with German police in an attempt to identify the traffickers. He said the investigation remained open.

The open question: was the cocaine sent for cardinal consumption, or even worse, for reselling purposes. Sure, the Vatican's finances are hardly as strong as they were when the Vatican Bank was humming along but who knew things were so bad to essentially make the Vatican a Breaking Bad spin off?

See the original article >>

US PMI Tumbles From Record High, Biggest Miss In 13 Months

by Tyler Durden

Last month's exuberance-filled, and instantly extrapolated, Markit US PMI print at the lofty levels of 57.1 (proving that the weather-delayed pent-up-demand was truly back) has been dashed on the shores of ugly reality. March's print dropped to 55.5, missing expectations by the most since Feb 2013 as jobs grew at a slower pace and factory orders declined. This slowing in the US economy's growth adds to last night's weakness in Chinese growth. Given weather was not a majr issue in March, what excuse can we find for this?

In the detailed report breakdown of components, also notable is the decline in New Orders from 59.6 to 58.0, as well as the Employment index declining from 54.1, to 53.9

What about the weather: after all Markit was so vocal to blame snow in the winter in the last few months, even though the index magically soared to record? Well, apparently, the weather got better in March.

Reports from survey respondents cited improving economic fundamentals and, to a lesser degree, an on-going catch-up effect following weather disruptions earlier in the year.

Wait, the PMI index declined even as the weather got better? Huh? Yup. Commenting on the flash PMI data, Chris Williamson, Chief Economist at Markit said:

“The manufacturing PMI adds to evidence that the sector has shrugged off the weather-related weakness seen earlier the year, with strong demand encouraging firms to expand and hire new staff at a robust pace.

“The buoyant growth in March rounds off the best quarter for three years, indicating that the sector should provide a robust contribution to GDP in the first quarter. Growth was not as strong as February, but that’s in many respects only to be expected after last month’s numbers had been boosted by the rebound from January’s severe weather. The fact that the output and new orders indices remained so strong in March is very encouraging news that the sector has come through the weather-related soft patch and continues to play an increasingly important role in the economic upturn.

“Particularly welcome was the sustained upturn in hiring, adding to evidence to suggest that firms’ retain an upbeat outlook.

“One area of concern is the sluggish growth of exports, but this weakness is being more than offset by strong domestic demand.

”The survey is broadly consistent with manufacturing output rising at an annualised rate of approximately 4% in the first quarter and job creation in the sector running at around 10-15,000 per month. These are encouraging numbers that will no doubt add to the case for the Fed to continue reducing its asset purchases.”

Mmmk then.

Finally, what does this data tell us about the upcoming April NFP:

A solid rate of job creation was sustained across the manufacturing sector in March. Staffing levels have increased in each month July 2013 and the rate of employment growth was stronger than seen on average over this period. Survey respondents widely linked staff recruitment to improving confidence about the business outlook and greater optimism about the prospects for the U.S. economy as a whole.

In other words, it could be better... Or it could be worse than expected.

See the original article >>
Inflection Points for Gold, Silver and the U.S. Dollar

By: Rambus_Chartology

As we all know last week was a tough week in the PM sector. The real question we have to ask is whether this was just a short term correction in the uptrend that started at the December low or is this the end of the three month rally? We’ll look at some charts to see if we can answer this question.
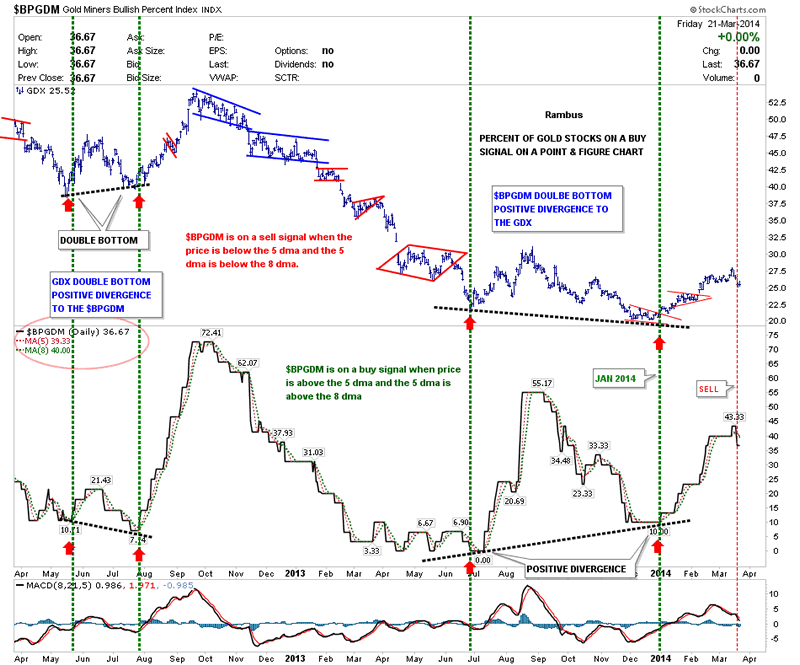
Lets start with the BPGDM chart that I showed you last week which was real close to giving a sell signal. We were just waiting for the 5 dma to cross below the 8 dma to confirm the sell signal. We got that last Friday so it’s officially on a sell signal now. The red circle shows the BPGDM is down to 36.67 with the 5 dma at 39.33 and the 8 dma now the highest at 40. This is the alignment we want to see for a sell signal.


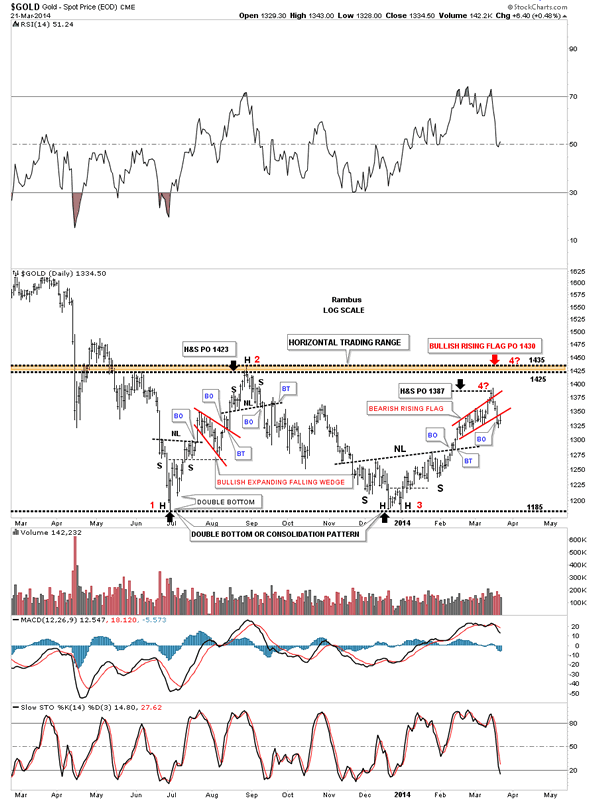
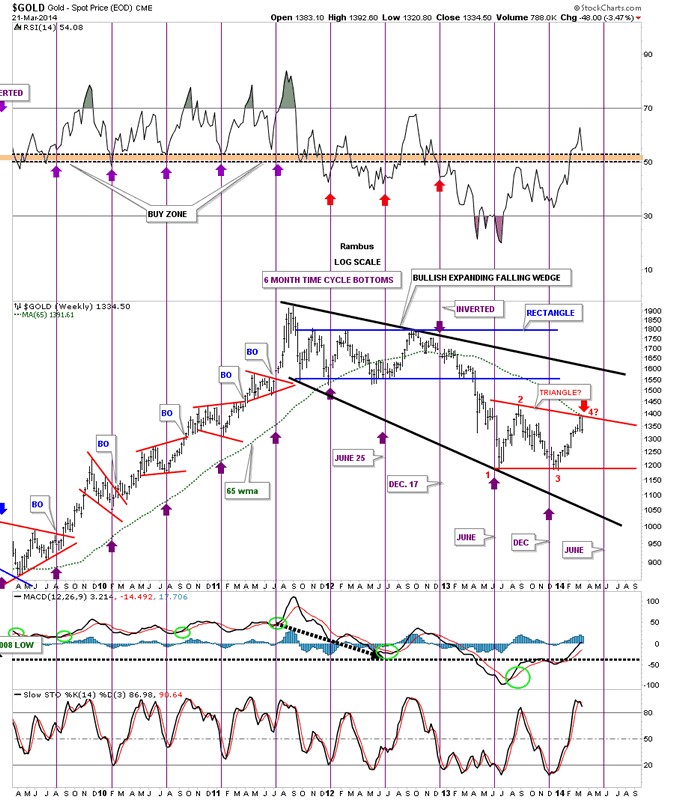
The precious metals complex has been in a trading range since the June low made last year. There is still no confirmation yet if this sideways trading range is a double bottom reversal pattern or just a consolidation pattern. The trading range on gold has had three reversal points so far as you can see on the chart below. I’ve been looking for the price action to reach the August high made last year at the 1430 area where we would then sell regardless if gold was going to move higher. Everybody and their brother knows the 1430 is a hot zone and will be selling. I had originally labeled the red rising flag as a bullish rising flag as it was forming as a halfway pattern with a price objective up to 1430 which fit in perfectly. You can see the red rising flag had a false breakout through the top rail and turned down hard breaking below the bottom red rail. I’ve renamed the red rising flag to a bearish rising flag and moved the 4 with a question mark down to the top of the red rising flag. In these big consolidation patterns you will always see some type of reversal pattern form at the reversal points. As you can see reversal point #1 started out with a little unbalanced double bottom that worked into an inverse H&S bottom. Reversal point #2 built out a H&S top. Our last bottom,#3 started out with another small double bottom that ended up being the head of the inverse H&S bottom. Now here we are back up toward the top of the trading range where the price action has fallen short of reaching the price target of 1430, and has just built a 5 point bearish rising red flag. Is this going to be the reversal pattern that puts in the 4th reversal point in this nearly 9 month trading range?


This next chart shows where the green 65 wma and the most recent high touched, red arrow. That 65 week moving average always worked as support during the bull market years. Is it now going to reverse its role and act as resistance during the bear market? Sometimes it can be too painfully easy not to pay attention to something, as simple as a moving average, that worked miracles during the bull market years. Sometimes it can be that easy. Also if this is the 4th reversal point in the red triangle we are catching it at the optimal time to take advantage of a move down to at least the bottom red rail. If gold can takeout the top red rail and the 65 wma to the topside then we’ll know right away that gold is much stronger than what it appears right now.


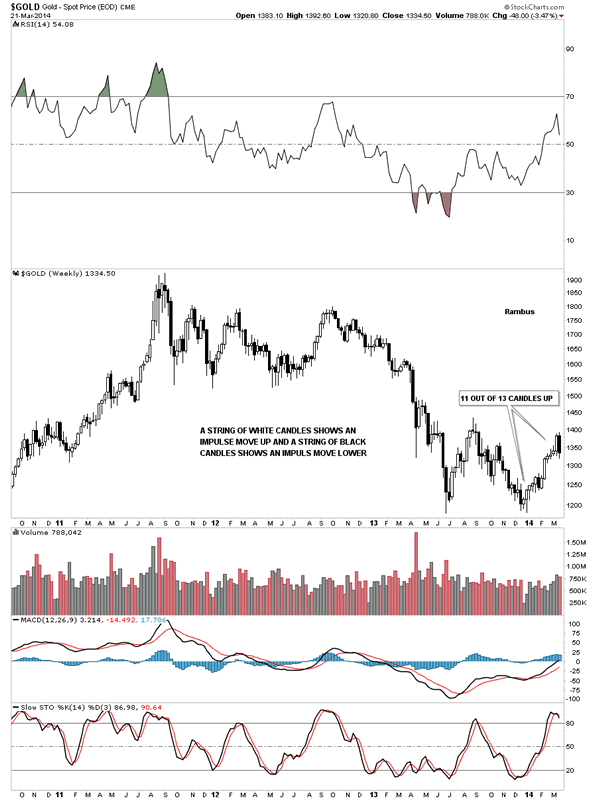
If gold is topping out right here we should see another black candlestick show up this week. There could be some volatility during the week but I would like to see a black candlestick form by the end of this weeks trading to add a little more weight to a downside move beginning.


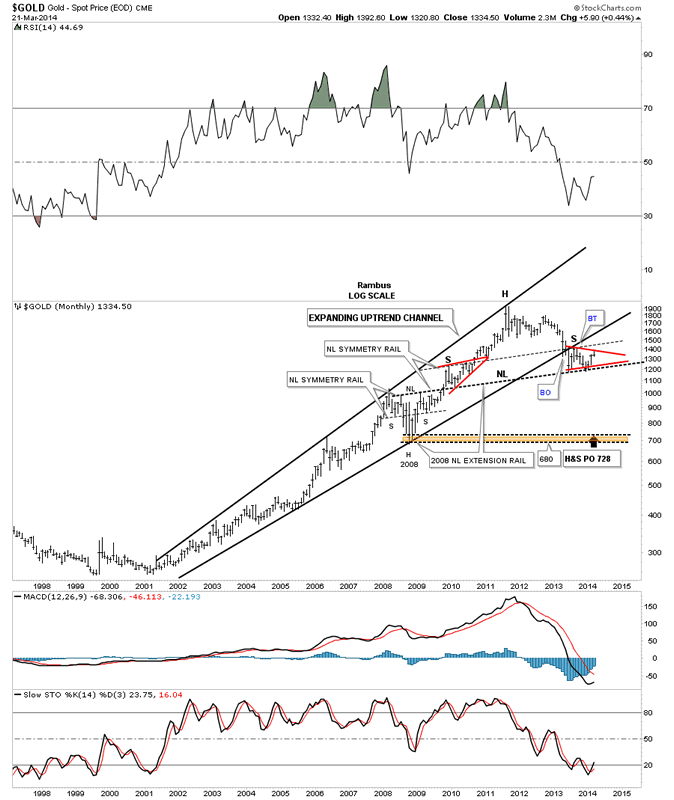
If gold is actually building out a triangle consolidation pattern then that means the neckline of the very large H&S top will be broken to the downside. The neckline is still quite a ways down around the 1200 area so there is plenty of time to watch how things unfold over the coming weeks and months.


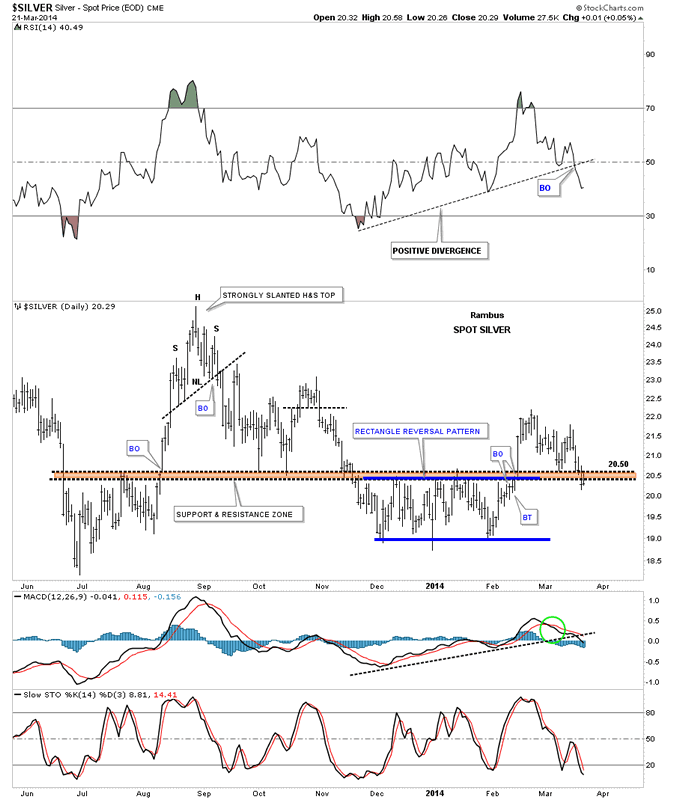
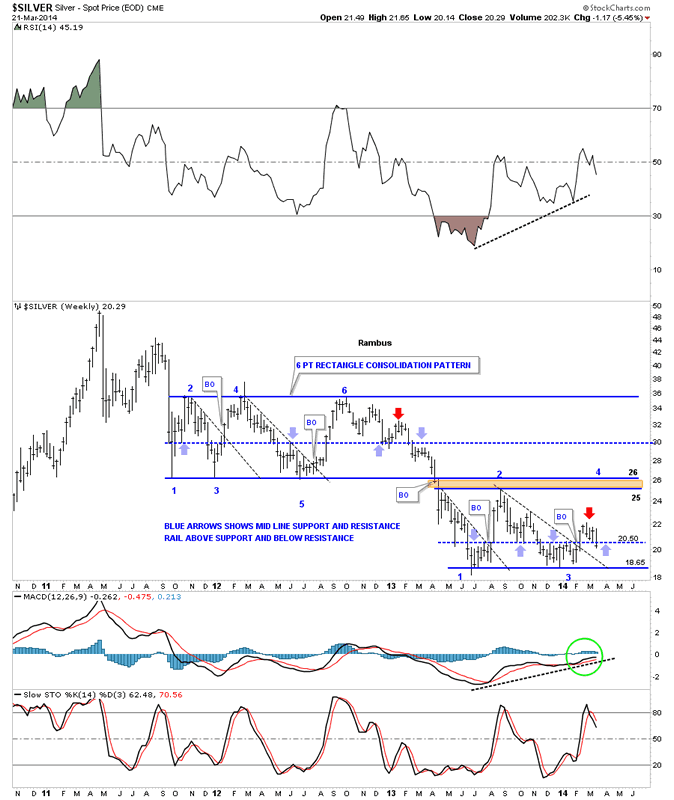
Lets take a look at silver that is starting to crack the strong area of support we’ve been watching at the 20.50 area which is the top of the blue 5 point rectangle reversal pattern. You can see the price action came down to the top of the support and resistance zone and had a good bounce but ran out of steam and now silver is starting to penetrate that brown shaded support and resistance zone which it shouldn’t be doing. The situation can still be saved if silver can start to rally strongly from here but support is starting to crack.


Below is another weekly chart I’ve been showing you that has the lite blue arrows that shows the mid rail support and resistance areas. As you know I’ve been watching that 20.50 area like a hawk hoping it would hold support. As you can see it closed the week below that critical mid line of support. I’ve added a red arrow that shows what happened the last time the center rail failed to hold support on the 6 point rectangle consolidation pattern above. That red arrow, on the blue 6 point rectangle, is the actual spot that began the big impulse leg down to eighteen. Is our current failure to hold support at the center dashed line the actual beginning of the next impulse leg down similar to what we seen on the blue rectangle?


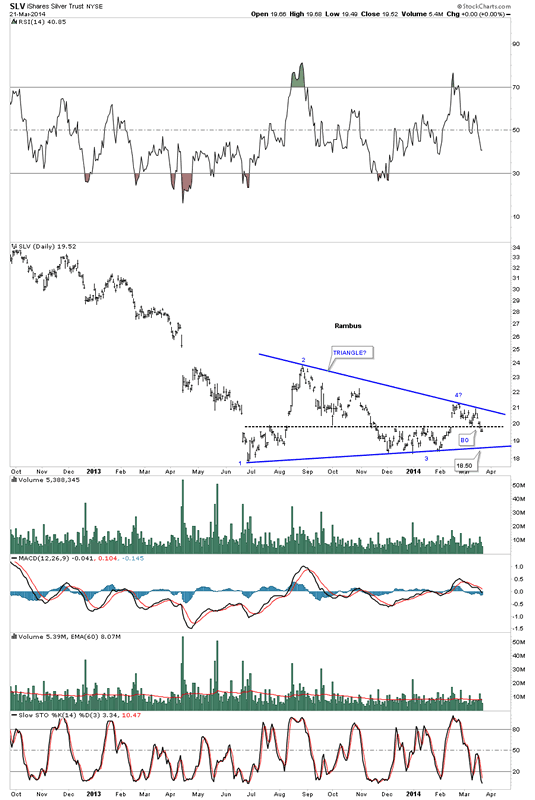
With the potential support rail being violated this sets up the possibility that a triangle pattern is now forming. I can guarantee you that this possible triangle is not on anyone’s radar screen yet. The fourth reversal point is now just beginning to show itself.


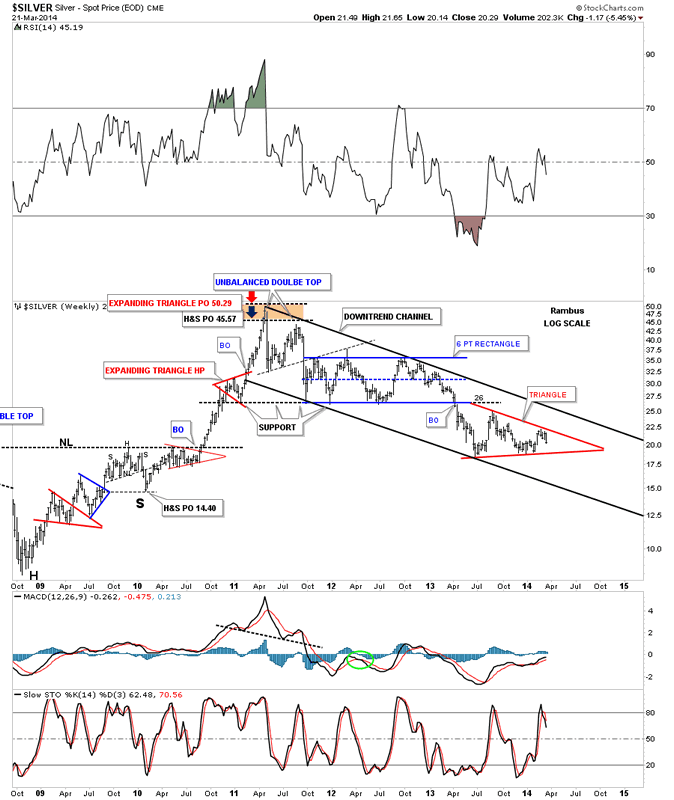
If silver is building out a triangle consolidation pattern lets see how it fits into the big downtrend channel that has been in place since silver topped out in April of 2011 almost three years ago already. As you can see it fits perfectly.


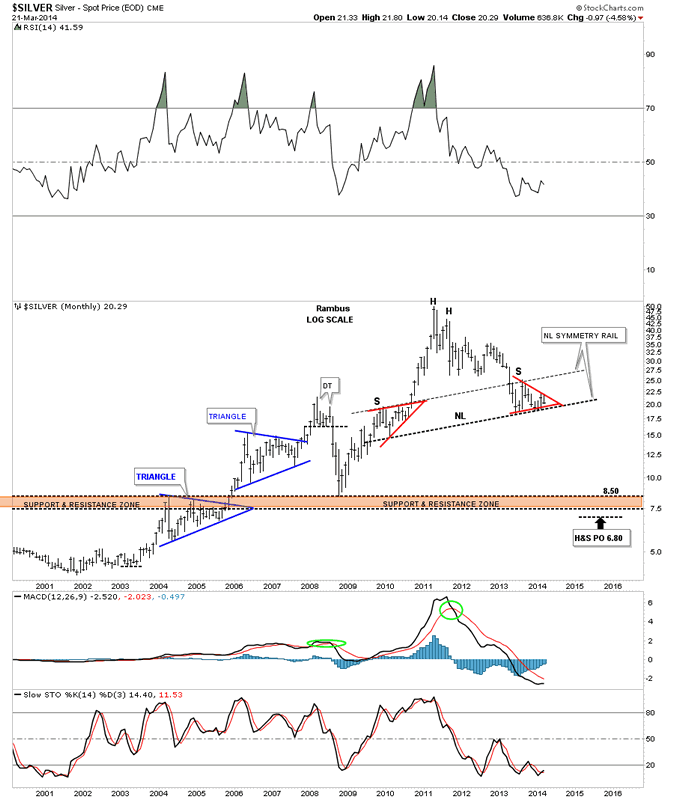
Lets take one last look at silver that shows how our potential triangle, that is now forming, may play out in the very long term look. As I’ve stated several times there is some beautiful symmetry is taking place on the long term monthly chart for silver. As you can see on the chart below the potential triangle is the right shoulder of a very large H&S top. I know it maybe hard to wrap your head around what this means for silver and the precious metals complex in general. If silver along with gold break below their respective necklines, I’ve been showing you, there is going to be one more hard down phase that will virtually wipe out most of the bull market gains off the books. This would then be a round trip from start to finish. How many investors do you think sold all their gold and gold shares in 1980 when gold and silver topped out? I would bet very few actually sold anywhere near the top as the same hype we have heard in this bull market was the same back then. Maybe this time will be different but silver and gold will need to show us some strength by making a new higher high at some point to reverse this downtrend that has been in place for close to three years now.


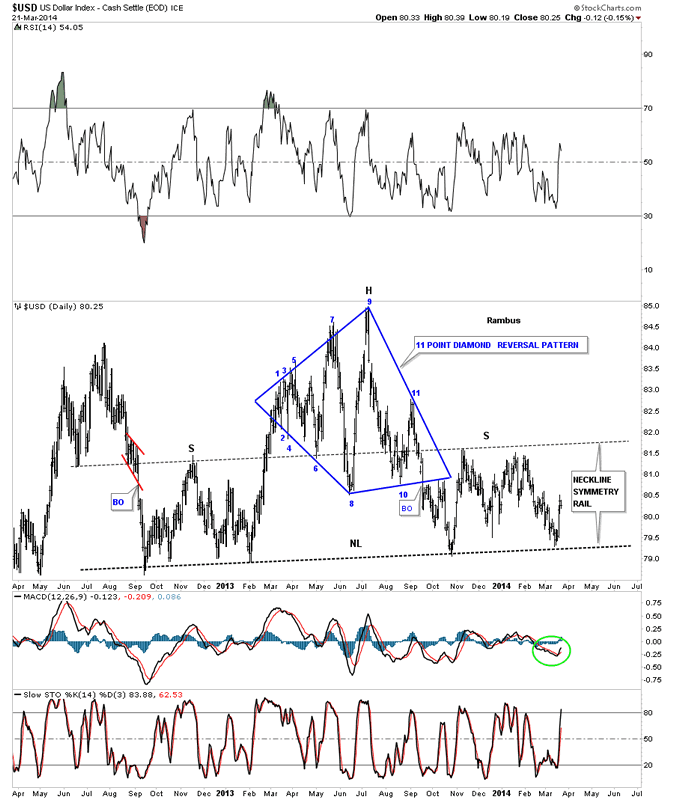
If gold and and silver are going to make new lows we need to look at the US dollar for any clues it can give us. The first chart I would like to show you is the possible H&S top with the Diamond head. As you can see the price action reached the neckline again just recently and has bounced up. We know that is one hot neckline. Still no confirmation that the potential H&S top is valid.


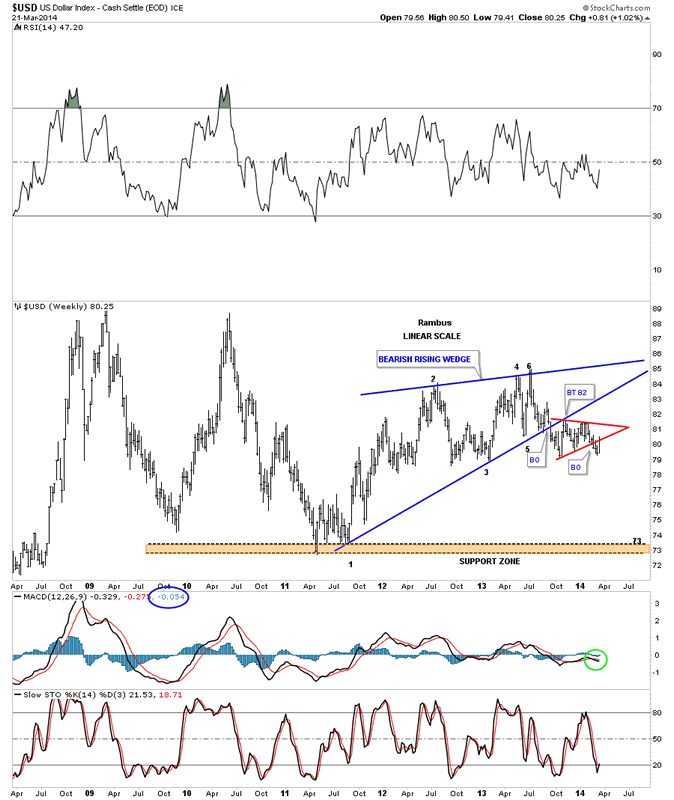
I have many charts for the US dollar that can show either a bullish or bearish outcome. Lets look at one more chart that shows a bearish setup. The US dollar broke down out of a blue bearish rising wedge and then built a red triangle as the backtest. You can see the dollar backtested the bottom rail of the red triangle this week. So far it’s still holding resistance.


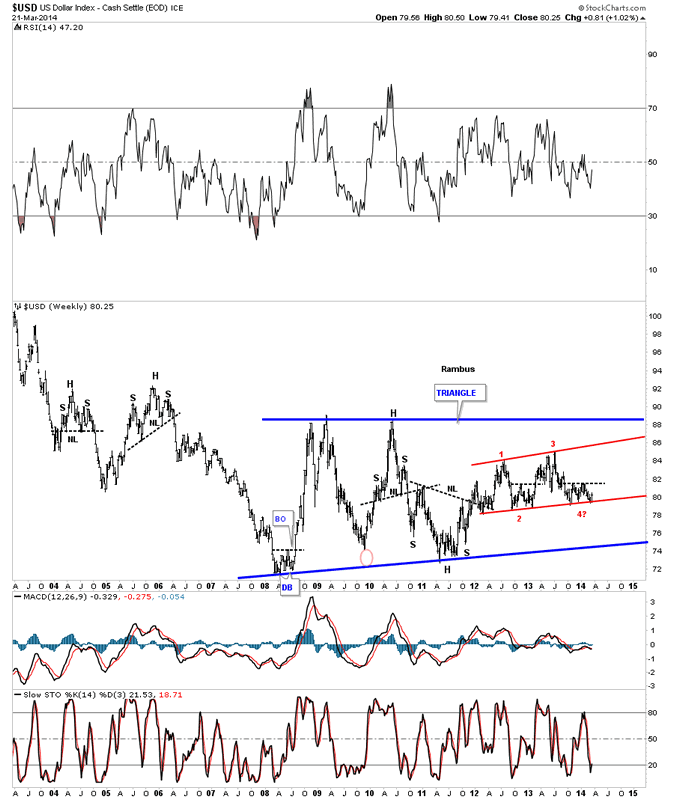
Now lets look at several charts that may show a positive outcome if support can hold. Below is a very long term chart for the US dollar that is showing a possible very large blue triangle forming. If the bottom rail of the red consolidation pattern can hold support, right here, then the US dollar should be able to rally at least back up to the top red rail at a minimum. This is a critical time for the US dollar.


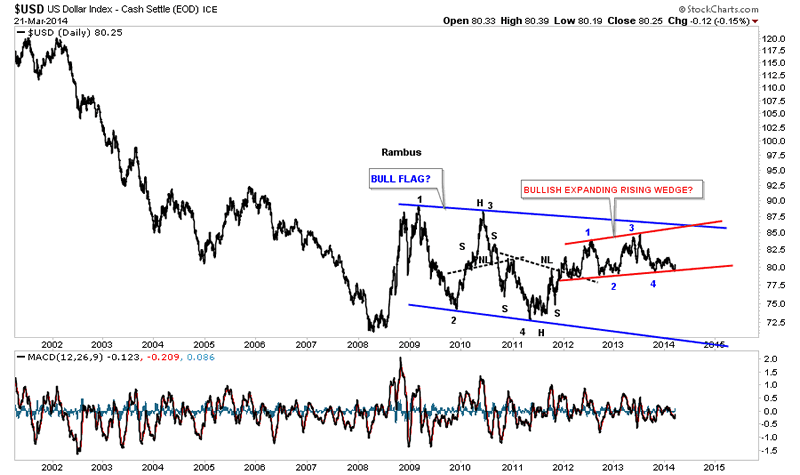
Below is basically the same chart but this time I moved the first reversal point up to the 87 area which gives us more of a bull flag type pattern. The red trading range is still the key as to which way the US dollar is eventually going to break. So far the bottom red rail has been holding strong support.


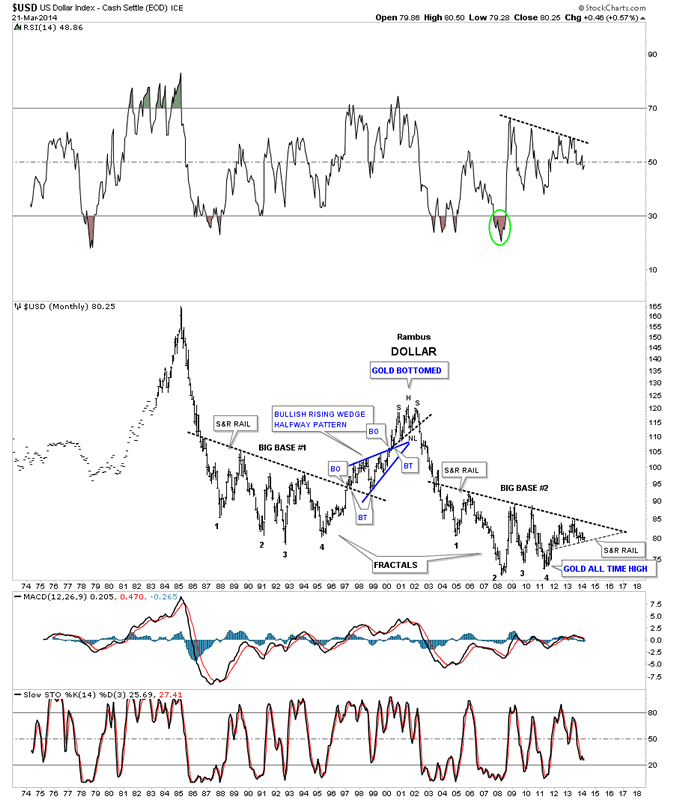
This last chart I would like to show you is one I built quite awhile ago that shows the two fractals or big base #1 and big base #2. The dollar has been moving at a snails pace between the top down sloping rail and the support and resistance rail on the bottom. Eventually it’s going to have to break one way or the other and whichever way it breaks out a good trend should develop.


It looks like the precious metals complex maybe at another inflection point right here and now. Last weeks price action may have ended the three month rally that began at the December low. I think we’ll know shortly if this is indeed the case. Stay tuned as it can get pretty wild at these turning points sometimes. All the best...Rambus

See the original article >>
Follow Us