Wednesday, March 12, 2014

I’m Long Corn and Short Copper So I’m Short China

by Greg Harmon

That is the obvious play right? As China implodes Copper will sell off and the scare will raise Corn prices. Everyone is doing it.

Why is it that traders need to make everything so complicated? The latest story running around is that Copper will sell off because the economy in China is at risk or imploding. And since Copper is used as collateral for loans by some companies in China there will be a mass Copper liquidation. So if you believe that China will falter sell Copper. What? If you think that China will implode why not just sell China? I suspect this course of action has been put forth by the same people that think that they are long on the housing market by buying Ford stock (hey – they make cars and trucks, not houses) and suggest that you hedge your stock portfolio by buying VIX calls (a derivative on the S&P 500 Puts and Calls, which by the way have a higher correlation to those stocks). But I digress.

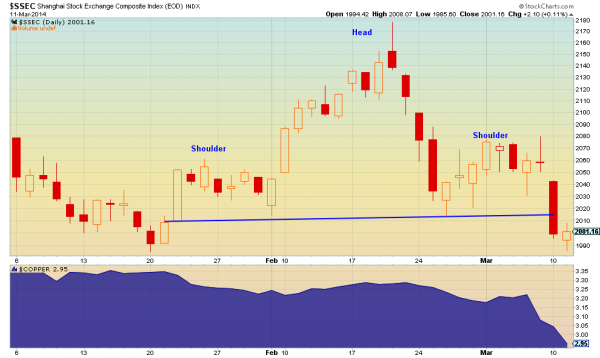
china copper

I understand that it may sound cool to be long VIX Calls or short Copper, but what is the point? I understood the point of trading or investing to be making money. And if you have a well thought out thesis, or from my technical perspective, the price action in a particular, sector, stock or ETF is giving an opportunity, then use that directly. You don’t like China, then sell China. There seems to be a good reason to sell China in the chart above. It broke the neckline of the Head and Shoulders Top on Monday and has a price objective to 1848 below. If you agree then just sell the China ETF $FXI short or buy $FXI Puts (sorry the Shanghai Composite stock can only be traded by Chinese nationals). But there is also the possibility of a Double Bottom and reversal at the 1990 level. Incidentally the purple blob underneath is the price of Copper. It is hard to see the same strong correlation between Copper and China that has existed the last 2 days in the rest of the chart. Maybe because it is not there? Also with the breakdown in Copper there are reasons to short that too. Just don’t claim you are short China if you do.

See the original article >>

Patterns suggests Doc Copper could fall 30% more!

by Chris Kimble

CLICK ON CHART TO ENLARGE

Doc Copper are you feeling ok, you don't look the best! Copper could well be forming a multi-year descending triangle. If this pattern read is correct, should Copper break support, selling pressure should increase.  A support break suggests Copper could trade another 30% lower. 

So far support is still in place....This is important, stay tuned.

My question on a bigger scale is, if Copper does trade lower, what is the macro message it would be sending? Should one construct their portfolios differently if Copper does fall hard?

See the original article >>

Renzi's Day

by Marc Chandler

The Chamber of Deputies approved the electoral reform bill that Renzi and Berlusconi had negotiated before Renzi squeezed out Letta to become Prime Minister of Italy. The bill goes to the Senate now.


That Renzi got the lower chamber to approve the bill is a minor victory, after all he enjoys a majority. There was some fear that, under Letta, the more than 200 amendments would have bogged down the process. In response to the Constitutional Court criticism of the previous electoral system, foisted by Berlusconi a new electoral system was created. It raises the threshold for parliamentary representation by a party and coalitions. Many small parties might not qualify, and this will make parliament less fragmented. It also provides a run-off mechanism that would kick in if no party/coalition secures 37% of the popular vote.


In order to secure approval of the bill, Renzi was forced to decouple it from his other pet political issue--strip the Senate of its legislative authority--turning it into an unelected body with local government representatives.

Assuming that the Senate passes the political reform, the Senate continues to run under the previous electoral law, as the Constitutional Court ruling long applied to the lower house. An election now would be chaotic and it may take a better part of the year before the Senate reform (and the necessary constitutional changes) can be implemented.

Later today in Italy, Renzi is expected to unveil more of his 100-day program. He claims that between spending cuts, lower debt service costs and increased revenue, he has 20 bln euros to fund reforms. There is some skepticism over his figure and the EC warned yesterday that tax cuts should not be predicated on uncertain projections of future revenue. It once again put Italy on its economic watch list (last week), citing Italy's high public debt and weak external competitiveness.

Renzi intends to use half of his calculation of his means. He is expected to announce a cut in the regional social security tax (Irpef) for low wage earners. Business sought a cut in the regional tax (Irap), but the signs from Rome are that the pressure will likely be rebuffed.


The government is expected to make it easier to hire and fire workers in the first couple years of employment and extend unemployment benefits, with some reforms of the program. As part of the labor reforms, Renzi is expected to propose a tax break for new hires.

In addition to labor market reforms, Renzi is expected to unveil new initiatives to pay debts of the central and local governments. Italian governments owe businesses roughly 60 bln euros and have been chastised by the EU for not addressing these quicker. In addition to the lack of access to capital and the economic weakness, the government's lack of payment only exacerbates the pressure on small and medium businesses.

Renzi is also expected to unveil fresh initiatives for schools, proposing to spend some 1.6 bln euros on modernizing school buildings, which can also act as a little stimulus for local economies.


A source of savings for the government is the lower debt servicing costs. As if on cue, today, the Italian government sold one year bills at a record low interest rate of just below 60 bp. It also sold, for the first time in 4-years new 10-year inflation-linked bonds. The break-even was 1.06%.

Many observers, like ourselves, find Renzi's claim to do in three months what Italy has not achieved in 30 years to be incredulous. Yet there is much hope for his success.

See the original article >>

Is the Energy Sector Running Out of Gas?

by Tom Aspray

Stocks absorbed their second day of selling on Tuesday, and the futures are trading lower early Wednesday in reaction to more weak data out of China. The Asian markets were down sharply again with the Nikkei 225 losing 2.60% and the Hang Seng dropping 1.6%.

Most of the Eurozone markets are also down over 1%, but so far, the selling in the US stock index futures is not too heavy as the S&P futures are down just five points. The daily technical studies are declining but the NYSE Advance/Decline did make new highs last week and is still above its WMA.

Therefore, the current pullback is expected to be a buying opportunity as another rally is likely since a more significant top typically would take more time to form. The energy sector, which tried to rally last week, was hit with heavier selling on Tuesday. So what is the technical outlook for this key sector now?

chart
Click to Enlarge

Chart Analysis: The Select Sector SPDR Energy (XLE) is down 1.53% YTD with the 20-week EMA now at $85.94 along with the monthly pivot.

  • There is additionally support in the $85 area and the projected monthly pivot support at $83.46.
  • In early February, XLE had a low of $81.78, line a.
  • The weekly relative performance dropped below its WMA and support last October.
  • The RS line is well below its WMA and the long-term downtrend, line b.
  • There are no signs yet of a bottom, basis the daily RS analysis (not shown).
  • The weekly on-balance volume (OBV) looks ready to turn lower after failing to exceed the previous highs, line c.
  • The OBV has next support at its slightly rising WMA.
  • The weekly OBV did violate a longer-term uptrend, line d, during the January-February correction.
  • There is a resistance now at $88.30-$88.48 and a close above these levels is needed to reassert the uptrend.

The SPDR S&P Oil & Gas Exploration (XOP) has performed better this year as it is down just 0.35% YTD.

  • XOP was down just over 2% on Tuesday with volume 1 1/2 times the average.
  • Prices are now close to the daily starc- band at $67.31 with the 20-day EMA at $67.31.
  • The 50% Fibonacci retracement support of the rally from the February lows is at $67.41, which is very close to the quarterly S1 support.
  • The monthly projected pivot support stands at $65.15.
  • The daily relative performance moved briefly above resistance at line f last week.
  • The RS line has now broken its uptrend, line g, indicating that XOP is acting weaker than the S&P 500.
  • The daily OBV formed lower highs in February and has now dropped below its short-term support.

chart
Click to Enlarge

Exxon Mobil Corporation (XOM), which makes up over 16% of XLE, dropped 1.5% on Tuesday. It is down 6.5% YTD and has next support at $85.94 and the 20-week EMA.

  • XOM is just below the monthly pivot at $94.09 and closed below the quarterly pivot at $95.04 last Friday.
  • There is further support in the $91-$92 area with the February low at $88.76.
  • The pattern in the weekly relative performance looks very similar to that of XLE.
  • It looks ready to make new lows this week and is well below its declining WMA.
  • The weekly OBV has dropped below its WMA with support now at the February lows and the uptrend, line c.
  • The daily OBV (not shown) is also below its WMA so both OBV time frames are negative.
  • There is initial chart resistance at Monday’s high of $95.55 with further resistance at last Tuesday’s doji high of $96.86

Valero Energy (VLO) was recommended in late January’s One High-Octane Pick and has been one of the strongest oil and gas refining stocks. Last week, it broke through resistance at line d.

  • Tuesday’s high at $53.92 tested the daily starc+ band, which is now at $55.07.
  • The 127.2% Fibonacci retracement target is at $55.55 with the weekly starc+ band at $57.34.
  • The daily relative performance has been very strong over the past week as it has surged above its downtrend, line f.
  • The weekly RS line (not shown) is close to its previous highs.
  • The daily OBV confirmed the price action as it broke out of its trading range, lines g and h.
  • The weekly OBV is also above its WMA but is still slightly below the early-2014 high.
  • There is initial support now in the $51.80-$52.20 area with stronger at $50.
  • The monthly pivot is at $48.78 with the quarterly at $44.43.

What It Means: The failure of the energy sector to rally with crude oil, which typically bottoms in February, has kept me from making many recommendations in this sector.

The technicals suggest that a further drop is likely as the RS analysis is leading prices lower. Our long position in Valero Energy (VLO) is up over 11% in six weeks, so it is time to take some partial profits and as I tweeted “sell 1/3 of the position in VLO on the opening.”

How to Profit: No new recommendation

Portfolio Update: Should be 100% long Valero Energy (VLO) at an average price of $48.11. Sell 1/3 on the opening and raise the stop to $48.66 on the remaining position.

Also still 1/3 long Schlumberger (SLB) from $87.13 as I reduced the positions just before it popped to the upside. Use a stop now at $89.23.

See the original article >>

Weekly energy market analysis

By Dominick Chirichella

Since breaching the $100/bbl level yesterday afternoon the spot Nymex WTI (NYMEX:CLJ14) contract has been steadily declining. The spot contract is off another 1.2% so far this morning. The market is finally acknowledging that the destocking of crude oil inventories in Cushing is resulting in a surplus building in the Gulf or PADD 3 region. I have been discussing this issue for several months in this newsletter and in our Energy Insight Blog “The Big Shift”.

As of last week’s EIA oil inventory report crude oil stocks in the Gulf are above last year and the five year average with the spring refinery maintenance season barely getting underway. Last night’s API report showed a larger than expected build in total crude oil stocks of 2.6 million barrels. Later this morning the EIA will release their report with a PADD breakdown. I am expecting another above average build in PADD 3 again this week.

The direction of WTI is primarily driven by the short term fundamentals with more and more market participants starting to recognize that it is not a question as to will a crude oil surplus build in the U.S. Gulf, rather how large will the surplus be and how long will the region remain in a surplus position. As the refining sector moves into the heart of the lower crude oil demand refinery maintenance season the surplus will only grow and likely grow at an accelerated rate.

As I have also warned the Brent/WTI spread is being impacted by the so called “Big Shift” as WTI has been in a downward trending pattern while the Brent contract has been much more stable. Until the refinery maintenance season is over in a few months or so the spread will have difficulty in working its way toward a more normal historical relationship that existed prior to the surplus years in the Cushing region.

The April spread has now breached the $8/bbl technical resistance area that has been in play since the middle of February. The spread is now looking like it will settle into an $8/bbl to $11/bbl trading range for the short term. The direction of the spread has been consistently moving in the inverse direction of the spot WTI contract as the Brent contract has remained relatively stable.

In fact the Brent (NYMEX:SCJ14) contract has been in a technical triangular or consolidation trading pattern while the WTI contract has been in a downtrend over the same timeframe. Brent is garnering support from the ongoing and evolving geopolitical issues in places like Libya, Ukraine and elsewhere in the MENA region as well as market participants starting to look forward to the North Sea maintenance season which will result in reduced supply of North Sea crude oil.

In the short term I expect the spread to remain with a bias toward widening while longer term the narrowing pattern should return.

Global equity markets are continuing to drift lower with the EMI Global Equity Index now at the lowest level of the year erasing all of the recovery gains over the last several weeks. The EMI Index is now showing a year to date loss of 5.9% with seven of the ten bourses in the Index now in negative territory. Although Brazil was the only bourse to add value over the last twenty four hours it is still the worst performing exchange in the Index. Canada remains on top of the leader board but if oil prices continue to slide Canadian equities are likely to get hit. Global equities have been a negative price driver for the oil markets as well as the broader commodity complex. The US dollar Index continues to move higher and is also acting as a negative price driver for oil and commodities.

The EIA released their latest Short Term Energy Outlook yesterday. Following are the main oil highlights from the report. In this month’s report they lowered their forecast for global demand by 100,000 bpd but also lowered their global supply projection by 300,000 bpd.

  • EIA projects world petroleum and other liquids supply to increase by 1.3 million barrels per day (bbl/d) in both 2014 and 2015, with most of the growth coming from countries outside of the Organization of the Petroleum Exporting Countries (OPEC). The Americas, in particular the United States, Canada, and Brazil, will account for much of this growth.
  • Harsh winter conditions over the past few months negatively affected well completion activity in the northern U.S. plays. As more evidence of this seasonal slowdown has appeared in the data, EIA has revised downward initial estimates for December 2013 and January 2014 U.S. crude oil production. Because the weather effects are temporary, much of the production slowdown is expected to be made up by accelerated completion activity over the next few months.
  • EIA expects strong crude oil production growth, primarily concentrated in the Bakken, Eagle Ford, and Permian regions, continuing through 2015. Forecast production increases from an estimated 7.5 million bbl/d in 2013 to 8.4 million bbl/d in 2014 and 9.2 million bbl/d in 2015. The highest historical annual average U.S. production level was 9.6 million bbl/d in 1970.
  • Projected world liquid fuels consumption grows by an annual average of 1.2 million bbl/d in 2014 and 1.4 million bbl/d in 2015. Countries outside the Organization for Economic Cooperation and Development (OECD), notably China, drive expected consumption growth. Non-OPEC supply growth contributes to an increase in global surplus crude oil production capacity from an average of 2.1 million bbl/d in 2013 to 3.9 million bbl/d in 2015.
  • EIA estimates that global consumption grew by 1.2 million bbl/d in 2013, averaging 90.4 million bbl/d for the year. EIA expects global consumption to grow 1.2 million bbl/d in 2014 and 1.4 million bbl/d in 2015. Projected global oil-consumption-weighted real GDP, which increased by an estimated 2.3% in 2013, grows by 3.1% and 3.5% in 2014 and 2015, respectively.
  • EIA estimates that OPEC crude oil production averaged 30.0 million bbl/d in 2013, a decline of 0.9 million bbl/d from the previous year, primarily reflecting increased outages in Libya, Nigeria, and Iraq, and strong non-OPEC supply growth. EIA expects OPEC crude oil production to fall by 0.5 million bbl/d and 0.3 million bbl/d in 2014 and 2015, respectively, as some OPEC countries, led by Saudi Arabia, reduce production to accommodate the non-OPEC supply growth in 2014.
  • EIA expects that OPEC surplus capacity, which is concentrated in Saudi Arabia, will average 2.6 million bbl/d in 2014 and 3.9 million bbl/d in 2015. This build in surplus capacity reflects production cutbacks by some OPEC members adjusting for the higher supply from non-OPEC producers. These estimates do not include additional capacity that may be available in Iran but is currently offline because of the effects of U.S. and European Union sanctions on Iran's oil sector.
  • EIA estimates that OECD commercial oil inventories totaled 2.59 billion barrels by the end of 2013, equivalent to roughly 56 days of consumption in that region. Projected OECD oil inventories rise to 2.61 billion barrels at the end of 2014 and 2.62 billion barrels at the end of 2015.

Wednesday's API report was neutral to bearish as total crude oil stocks increased more than the expectations while refined product inventories were declined mostly within the expectations. The build in crude oil is primarily related to the an increased in crude oil imports as well as the shifting of crude oil from Cushing down to the Gulf. The API reported a slightly larger than expected draw in gasoline and an expected draw in distillate fuel. Total inventories of crude oil and refined products were slightly lower on the week.

The oil complex is mostly lower as of this writing and heading into the EIA oil inventory report to be released at 10:30 AM EST today. The market is usually cautious on trading on the API report and prefers to wait for the more widely watched EIA report due out this morning.

Crude oil stocks increased by 2.6 million barrels.  On the week gasoline stocks decreased by about 2.2 million barrels while distillate fuel stocks decreased by about 0.8 million barrels. Refinery utilization rates decreased by 0.3% suggesting the spring maintenance season may be starting to get underway.

The API reported Cushing crude oil stocks decreased below the expectations by 1.3 million barrels for the week. The API and EIA have been very much in sync on Cushing crude oil stocks and as such we should see a similar draw in Cushing in the EIA report. Directionally it is neutral for the Brent/WTI spread.

My projections for this week’s inventory report are summarized in the following table. I am expecting a modest build in crude oil stocks as the restocking process continues for the eight week in a row. I am also expecting a modest draw in gasoline inventories and in distillate fuel last week with refinery run rates starting to decline.

I am expecting crude oil stocks to increase by about 2.4 million barrels. If the actual numbers are in sync with my projections the year over year comparison for crude oil will now show a deficit of 15.2 million barrels while the overhang versus the five year average for the same week will come in around 12.1 million barrels.

I am expecting crude oil inventories in Cushing, Okla., to show the seventh weekly stock decrease in a row as the Keystone Gulf Coast pipeline is continuing to slowly ramp up its pumping rate. I would expect the Cushing stock decline to be in the range of around 2 million barrels based on the fact that more oil was moved out of Cushing to the USGC on Keystone last week.

In fact the Keystone Gulf Coast line increased its pumping rate for the fifth week out of the last six weeks. Genscape reported an average flow of 308,751 bpd for last week (report period for this week’s inventory report) as the line continues to work its way up to full operating capacity. The Keystone Gulf Coast Line is impacting the crude oil storage levels in Cushing and should result in Cushing stocks consistently declining going forward. Last week alone the Keystone line moved about 2.2 million barrels of crude oil out of Cushing. This will be bearish for the Brent/WTI spread this week. I am also expecting an above normal build of crude oil stocks in PADD 3(Gulf) of over 2 million barrels.

With refinery runs expected to decrease by 0.2% and wit the industry working down its stocks of winter grade gasoline I am expecting a modest draw in gasoline stocks. Gasoline stocks are expected to decrease by 1.8 million barrels which would result in the gasoline year over year surplus coming in around 0.7 million barrels while the surplus versus the five year average for the same week will come in around 1.6 million barrels.

Distillate inventories are projected to decrease by 1 million barrels as exports of distillate fuel out of the US Gulf continue while heating demand last week was above normal on cold winter weather along the east coast. If the actual EIA data is in sync with my distillate fuel projection inventories versus last year will likely now be about 6.9 million barrels below last year while the deficit versus the five year average will come in around 28.5 million barrels.

I am adjusting my oil view and bias to cautiously bearish but I am still flying the caution flag as the situation in the Ukraine continues to unfold. Most of the commodities in the oil complex have breached their respective technical support levels and are moving into new, lower trading ranges.

I am maintaining my Nat Gas (NYMEX:HPJ14) view and bias at neutral as the market sentiment seems is shifting away from the winter weather trading mode. The Nat Gas market is exhibiting all of the signs of a market establishing yet another market top.

See the original article >>

Yuan Dive?

by Barry Eichengreen

BERKELEY – Since December, when the US Federal Reserve began tapering its monthly purchases of long-term assets, emerging-market currencies have fallen across the board.

The main exception, until recently, was China’s indomitable renminbi. But now the renminbi, too, has been falling against the dollar. So is this more evidence of the disruptive impact of the Fed’s policy?

The renminbi’s decline is not large, and whether it will continue is uncertain. But the movement is striking by the standards of what is still a heavily managed currency. And it is in the opposite direction from what everyone has come to expect.

Certainly, the Fed’s tapering of its quantitative-easing policy has had some effect. A standard money-making strategy for investors with access to Chinese financial markets has been to borrow dollars at low interest rates and buy high-yield Chinese assets. But tapering, by auguring higher US interest rates, makes it more expensive to borrow dollars and invest in Chinese assets. As “the carry trade” falls out of fashion, demand for the renminbi declines and its exchange rate depreciates.

But, while the Fed has been tapering since December, the weakness of the renminbi materialized only in February. Evidently, something else is going on.

The reality is that China’s tightly controlled currency falls only when the People’s Bank of China wants it to fall. The PBOC, not the Fed, calls the tune to which the renminbi dances.

So why has it been singing the depreciation song?

One possibility is that a weaker renminbi is, paradoxically, part of the Chinese government’s strategy for encouraging its wider international use. China is committed to broadening the renminbi’s role for foreign trade and investment-related purposes. Ultimately, it would like to see the renminbi achieve an international status comparable to that of the dollar.

To do that, China will have to develop its financial markets and open them to foreign investors. But opening those markets is feasible only if the authorities eliminate the perception that exchange-rate movements are a one-way proposition. So long as investors believe that the renminbi can only appreciate, opening the country’s markets will cause it to be flooded by foreign money, with unpleasant financial consequences, not the least of which is inflation.

Foreign investors therefore need to be reminded that the renminbi can fall as well as rise. Some observers regard the renminbi’s recent slide as an attempt to squeeze the speculators and signal the advent of a more flexible exchange rate. They believe that the PBOC is about to widen the currency’s trading band.

If so, the PBOC’s recent market moves are a good thing. If there is one clear lesson from history, it is that the combination of open financial markets and a rigid exchange rate is a disaster waiting to happen. China has already begun opening its financial markets. Thus, greater exchange-rate flexibility is overdue.

A second, less positive interpretation is that the PBOC is weakening the renminbi in order to boost Chinese exports. Reacting against excesses in the country’s property markets and shadow banking system, the PBOC has moved, not unreasonably, to limit the availability of cheap credit. But this may have caused domestic demand growth to slow more rapidly than expected. And boosting exports is, of course, China’s customary response to weaker domestic demand.

This less encouraging interpretation of the renminbi’s recent weakening suggests that official efforts to clamp down on the shadow banking system are not going well, and that the effort to engineer a soft economic landing is not on course. If this view is correct, efforts to rebalance the Chinese economy could now be put on hold, which would not bode well for future economic and financial stability.

Moreover, if China is pushing down the renminbi in order to goose its exports, its policy will not sit well with its foreign competitors, be they the United States or Japan. Complaints about currency manipulation and the associated diplomatic tensions will quickly return.

China is sufficiently opaque that it is hard to know from the outside which interpretation is correct. Future renminbi movements will tell the tale. Mainly up-and-down fluctuations would be a sign that the policymakers’ goal is to eliminate one-way bets and advance the cause of renminbi internationalization. A secular decline, by contrast, would indicate that demand in China is weakening and rebalancing has been suspended.

For now, the only thing observers can do is to watch closely and hope for the best. And it is the PBOC they should be watching, not the Fed.

See the original article >>
Follow Us