Monday, December 9, 2013

Positive news brings bullish reaction despite taper threat

By Jeff Greenblatt

Was it a surprise the jobs number came in at 203,000 and unemployment rate at 7%? I thought everyone was worried about the taper. It didn’t look that way as futures and then the market surged on Friday. For once this number was decent, not because it was consistent with the monthly average but the biggest gains came in professional and business services (35,000), manufacturing contributed 27,000, health care 28,000 while retail was only 20,000. If they anticipated 180,000, the overage is attributed to retail and finally we have an economy that might begin to create jobs other than retail and food/beverage.

That’s a good thing because fast food workers in 100 cities walked off the job on Thursday seeking a minimum wage of $15 per hour. See what happens when one community (Sea-tac) makes it a law? We’ve discussed why they can’t make a $15 minimum wage; it’s absurd. I go into Burger King here and there to get a couple of hamburgers for a buck each. But there’s no way people will pay an extra 50 cents to a dollar for a tiny hamburger. If they don’t do that, they have to start laying off people.

The problem isn’t so much the fast food workers want more money as it is there are skilled jobs sitting wanting because people aren’t qualified. You can’t get a raise just because you want one; the marketplace sets the price on a worker. That’s how our system works. I understand Obama wants to raise the minimum wage to $10.10 an hour. This is what any Democratic President will attempt to do. I’d much rather see some leadership to get the infrastructure working again. These are themes we’ve covered in this space for the past three years. What bothers me is I have to write about it again and again because nothing ever seems to get done in this country.

The other big news of the week was the GDP coming in for the third quarter at 3.6%, nearly half of which was a buildup of inventories that will challenge these companies in the fourth quarter. This is especially troubling because we don’t usually see the buildup of inventories until the end of a prosperity business cycle. Inventories are built up for one reason, an overly optimistic view of the economy. You never see a buildup at the end of a recession when people have an overly pessimistic view of things. We’ve had a weak recovery for the past four years where GDP has come in across the board in the 2’s and high 1’s. On another note, new orders for factory goods fell in October as demand for aircraft and capital goods weakened. The number dropped 0.9 percent after rising 1.8 percent in September. See what I mean?

This is December, and that means the seasonal aspect is highly favorable to bulls. Nevertheless, after three strong months, traders don’t get a free pass. For the most part, it was a down week. What I can’t abide is how one day good news is bad news and the next good news becomes good news again. On the one hand, good news means the taper must be coming quicker. Then when they actually get a good jobs report, there is no word on the taper and the market surges. The fact of the matter is the Dow E-mini showed elements of a bottom by Thursday evening, and they were looking for an excuse to buy.

To the uninitiated, we teach clients to look for the relationship between the first F and last L leg of a pattern. Many times it will have a golden spiral or Fibonacci relationship. In this case the F and L were 61/161 to each other.

The surge was actually a lower probability and while they didn’t get a new high in the Dow due to activity in the financial arena the NDX and NASDAQ did hit new highs even as the NASDAQ was marginal and now is still setting its sights on the big 4100 target we’ve discussed for the past three years.

If you get nothing else out of this report the takeaway is NASDAQ 4100. That should make life simple enough. But here are two other conditions to be concerned about. For the most part, last week the equities were down as was the Greenback. We like seeing a currency appreciate with a stock market because it represents the culture becoming wealthier. Obviously the flip side is when the currency declines with the stock market. That’s not good. If it’s just a few days, no big deal. But if it becomes a trend, it means there’s some underlying problem. To me the fact that fast food workers in 100 cities could cause such a stir is problematic. You look at every recovery we’ve ever had from deep recession and I guarantee you the solution wasn’t overpaying people who work for McDonalds.

Then we had a down week in Europe which is fine but by Friday the DAX needle didn’t move much but the FTSE did. If you’ve noticed the Brits have a great sense of humor in addition to being highly pragmatic. The FTSE held 61% and the 200dma so I’d go with it. Since nobody should’ve expected these markets to go straight down during December we should see some element of the Santa rally this week. Right now it’s the FTSE leading to the upside in Europe which also might mean whatever bounce is developing will not sustain. I can’t remember the last time we had the FTSE leading a rally. Recall earlier in the year it was the CAC that was leading which surprised just about everyone and especially the folks in France.

With the next Fed meeting coming up next week, we should see them float a couple of trial balloons, but I doubt anything happens that would interfere with the holiday shopping season or Ben Bernanke’s legacy. He’s got another month to go, and there’s plenty of time for the "T" word under Janet’s watch. But that won’t stop the insanity of media hordes that have nothing better to hype this week.

Finally, the biggest story of the year is the peace deal lifting sanctions against Iran. I’ve been racking my brains trying to figure out the real reason why such a deal materialized. Someone may have figured it out. If you’ve never checked out the Debka.com website, you should. There are a couple of very interesting stories there. First of all, the United States and Iran are planning to carve up Syria as each has one key goal in mind, to block the influence of Al Qaeda. They are also attempting to keep Assad in power after the civil war ends. Now a new spectacular story surfaced today as Russia believes Al Qaeda in Syria has sarin gas and may have a plot to attack the Winter Olympics coming up soon in Sochi. Iran is still a hotbed for terrorists, but it appears to be of the Hezbollah variety. This doesn’t excuse it but it does explain at least part of the thawing between the West and Iran. I’m sure you’ll sleep much better knowing all of this.

See the original article >>

Banks outperform the market, with regional banks pulling ahead

by SoberLook.com

The US banking sector continues to outperform the broader market. Furthermore, for the first time this year, regional bank shares are outperforming the overall bank index, which is driven primarily by the largest banks.

Red = S&P500; Green = S&P total banking sector index ETF; Blue = S&P regional banks index ETF

The key reason for the strong performance among US banks remains the steepening treasury curve. Banks pay next to nothing on deposits while charging a rate that is often linked to treasuries on the loans they make. The steeper the curve, the wider the "margin". And given the leverage inherent in the banking system, even a small margin increase materially improves the return on equity.
The treasury curve has been steepening sharply in recent weeks - as seen from the spread between the 10y and the 2y yields (as well as 30y and 2y).

What's driving this steepening? Historically, rising longer dated bond yields were caused by higher inflation expectations. That's not the case this time around. In fact as the chart below shows, longer-term inflation expectations have been declining.

Dow Jones Credit Suisse 10-Year Inflation Breakeven Index

The rise in yields is instead mostly driven by higher expectations of earlier and faster reductions in securities purchases by the Fed. In particular, some at the Fed have been happy to see a bit of stabilization in monthly payrolls growth (at around 200K).

The sustainability of this trend is yet to be proven, but combined with better GDP figures (see chart) and improved new home sales (see chart), these data may be sufficient to push even this dovish FOMC into launching its exit sooner than expected. The fact that corporate spreads are at the levels not seen since 2007 (see post) doesn't help the case for maintaining the current pace of QE either.

At the same time, Bernanke was quite clear that it will be some time before the Fed will begin pushing up short-term rates - even after QE ends. We therefore have the short-term rates (and therefore bank deposit rates) remaining near zero, while longer term rates rising due to expectations of taper. This is resulting in significant curve steepening, a great environment for banks.
The next question is why all of a sudden we are seeing regional banks outperforming the overall banking sector. The answer has to do with the changing regulatory landscape, as the Volcker Rule is about to go into effect.

WSJ: - Barring a last-minute surprise, the votes will result in tighter restrictions on certain trading activities that go beyond what regulators had agreed to just a few weeks ago, according to people familiar with the matter. Since then, regulators have been locked in tense negotiations that threatened to upend the provision.
Under the final rule, regulators are expected to closely track trading activities with an eye on whether certain trades known as hedges are designed to post a profit rather than offset risks that accompany trading with clients. The finished version of the Volcker rule is likely to require that hedges be designed to reduce specific risks, according to a portion of the proposed rule reviewed by The Wall Street Journal.
Hedging activity should shrink or alleviate "one or more specific, identifiable risks" such as market risk, currency or foreign-exchange risk, and interest-rate risk, the language says.
"This is the new era of Big Brother banking," said Michael Mayo, an analyst with CLSA Americas. "Now banks' fortunes are more closely tied to the government."
This "Big Brother banking" will have a far greater effect on the largest financial institutions than on the regional or smaller banks. The inability to trade in "prop" accounts is already resulting in reduced liquidity and weaker market making capability among the larger banks. As a result, in the US bond markets for example, banks often do little more than act as "introduction brokers" for a quarter-point spread. In some instances this is far cry from the high volume market-making activities banks used to be involved in. All this is resulting in declining "sales & trading" revenue for the largest banks.
Bloomberg: - The $44 billion at stake represents principal trading revenue at the five largest Wall Street firms in the 12 months ended Sept. 30, led by New York-based JPMorgan, the biggest U.S. lender, with $11.4 billion. An additional $14 billion of the banks’ investment revenue could be reduced by the rule’s limits on stakes in hedge funds and private-equity deals. Collectively, the sum represents 18 percent of the companies’ revenue.

Not facing these same headwinds, regional banks are now outperforming.

See the original article >>

Why We're Stuck with a Bubble Economy

by Charles Hugh Smith

Inflating serial asset bubbles is no substitute for rising real incomes.

Why are we stuck with an economy that only generates serial credit/asset bubbles that crash with catastrophic consequences? Ths answer is actually fairly straightforward. Let's start with the ideal conditions for an economy that depends on consumer spending.
1. Rising real income, i.e. after adjusting for inflation/currency depreciation, wages/salaries have more purchasing power every year.
2. An expanding pool of new households, i.e. young people who move away from home or graduate from college, get a job and start their own household. New households buy homes, vehicles, furniture, appliances, kitchenware, tools, etc., driving consumption far more than established households.
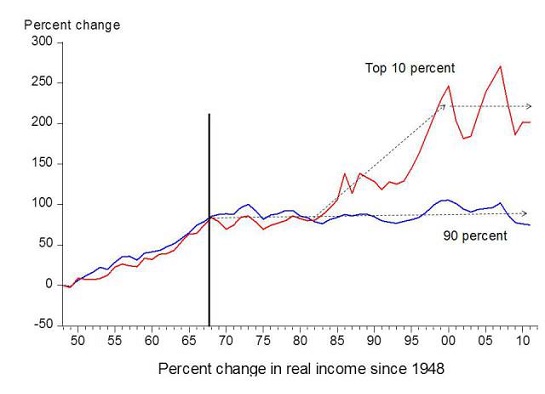
Neither of these conditions apply to today's economy. Income for the bottom 90% has been stagnant for forty years, and has declined 7% in real terms since 2000.

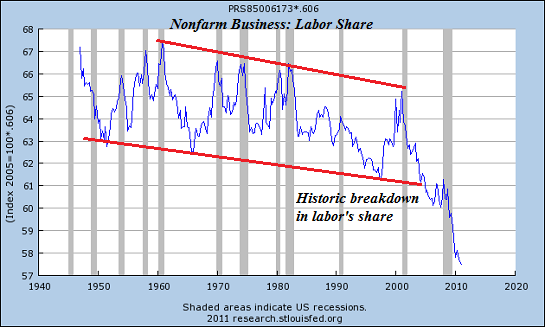
This stagnation is not the "new normal": the new normal is much worse, as labor's share of the national income has fallen off a cliff:


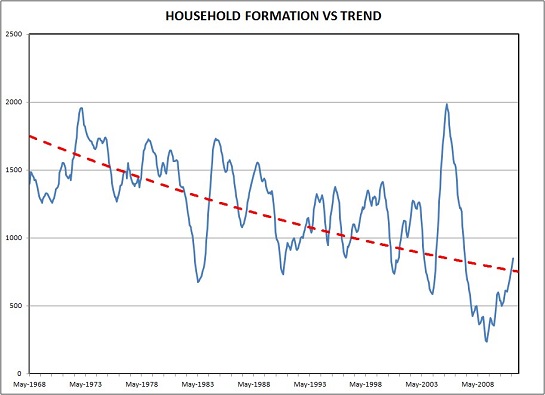
Household formation has also stagnated. That spike circa 2004-07 was caused by the housing bubble, which created new jobs and collateral that could be leveraged into new home purchases.

Since 2008, the Federal Reserve has bought $3.2 trillion in mortgages and Treasury bonds, and the Federal government has borrowed and blown $7 trillion in deficit spending. That $10 trillion in stimulus (not counting $16 trillion in Fed loans to banks and trillions more in other loans/subsidies), household formation has only recovered to the sub-1 million a year level.
In an economy of 316 million people, that isn't enough to generate "growth" in a $16 trillion economy.
With these organic sources of growth moribund or declining, the Fed and Federal government have resorted to other ways of stimulating more borrowing and spending, the sources of leveraged, high-risk "growth":
1. Lower interest rates so stagnant income can leverage more debt (and thus more spending)
2. Generate asset bubbles in stocks and housing that boost "the wealth effect," i.e. the emotional sense of being wealthier as a result of one's assets rising sharply in value, and the collateral available to support more debt.
If a house rises by $100,000 in value in a few short years, the owner has $100,000 more collateral to support new debt. The gargantuan expansion of home equity lines of credit (HELOCs) as the housing bubble expanded was the goal of the status quo, as asset bubbles create collateral that supports new borrowing and spending.
Now that interest rates are near-zero and mortgage rates are rising from historic lows, there is no more juice to be squeezed from low rates.
As for asset bubbles, they always burst, destroying collateral and rendering borrowers and lenders alike insolvent.
Without organic demand from rising real income and new households with good-paying jobs and low levels of debt, the consumer-debt based economy stagnates.This has left the economy dependent on serial asset bubbles that create phantom collateral that can support new debt, albeit temporarily.
Inflating serial asset bubbles is no substitute for rising real incomes and new households that aren't burdened with high levels of debt from student loans.

See the original article >>

Gold COT Data Again Proclaiming a Price Bottom

By Tom McClellan

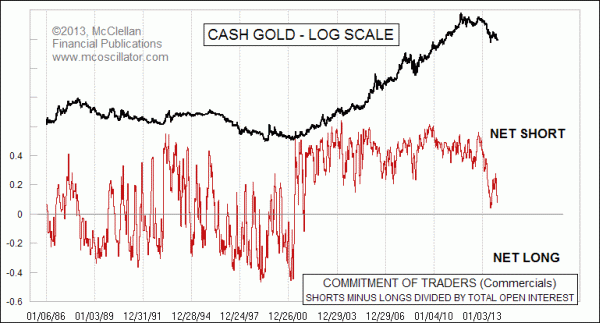
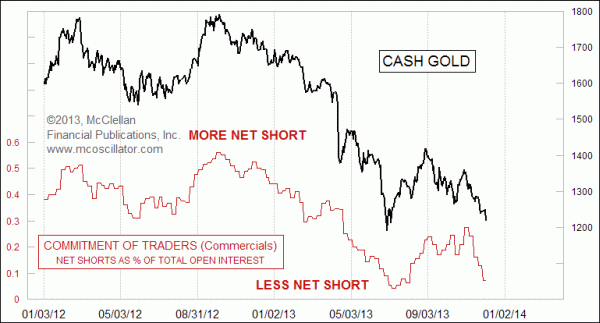
Back in June 2013, when gold was making its lowest price low since early 2011, I pointed out that commercial gold futures traders were at a really low net short position according to the Commitment of Traders data, and that this was a meaningful sign of a price bottom.  Now we are seeing a similar condition in the commercial traders’ net position, which is conveying a similar message.

The Commitment of Traders (COT) Report is published each Friday by the CFTC, showing traders’ positions as of the preceding Tuesday, and broken down into 3 groups: Commercial traders (big/smart money), non-commercial traders (large hedge funds), and non-reportable traders (small-time traders who as a group typically do the opposite of what ends up being a good idea).  The commercial traders are generally the ones to bet with, but there is a big fat caveat: often the commercial traders will get to a big skewed condition early, and so while they may end up being right in the long run, betting with them too early can get expensive.

Commercial traders' net position in gold futures

The last time that commercial gold futures traders were actually net long at all was back in late 2001.  Since then, they have been continuously net short to varying degrees, and so the game consists of evaluating their comparative net short position.  The reason for that bias to the short side is that a lot of the commercial traders are the major gold producers who use the futures market to sell forward their future production.  Selling what you don’t have yet makes you a “short” trader.

When the commercial traders were at this same sort of low net short position back in June 2013, that marked a nice price bottom for gold prices.  Now we are seeing the same sort of sentiment condition, and with gold prices retesting that June low.  Gold stock prices (XAU and GDM) have already broken below their June 2013 lows, as stock traders seem to be uniformly pessimistic about the future for gold.

One of the big fears that is voiced about gold is that the presumptive end to QE will be bad for gold prices because the Fed will stop printing excess money.  But what those voices seem to forget is that QE has not been all that helpful to gold over the past couple of years.  Gold topped at $1900/oz in 2011 when the Fed’s balance sheet was smaller than it is today, and that increase in the balance sheet since then has not stopped gold from falling.  So if the end of QE is really a bad factor for gold, then why was the continuation of QE since 2011 not helpful for gold?

Zooming in closer, we can see the comparison between the current condition in the COT data and what we saw back in June 2013:

Gold COT data

The recent drop in gold prices has had the commercial gold traders paring their collective net short position, perhaps due to hedging less of their future production, or perhaps out of outright smart-money speculation on a bullish outcome.  We cannot know which motivation is the operative one, but we are able to say that the last time the commercials were at a similar level, it marked a pretty decent bottom for gold prices.

Sentiment readings like this represent potential energy; when they get skewed in a big way, they show us how much potential there is for a big move the other way, but they don’t tell us when the avalanche is going to cut loose.  For that we have to turn to other tools to tell us when a move is actually getting going.  But seeing the skewed sentiment conditions tells us which way to start leaning, and which directional signal to start looking for.

COT Report data are reviewed every Friday in our Daily Edition, since Fridays are the day each week when these data come out.  These data do not always have a big message to convey, but when they do, it is usually worth listening to.

See the original article >>

Silver Price Letting The Market Speak

By: Michael_Noonan

We are not a source for or fans of endless statistics, like the number of ounces purchased from one period over another, how many ounces are available at the Comex, how many ounces have been mined, the demand for v the production of silver, etc, etc, etc. Too boring.
It may satisfy many to know this information, but we are more interested in what translates into results, where can a market turn be determined, where price is likely to go, etc, etc, etc? This is where the challenge lies, for it comes down to timing in order to enter or exit a market, seeking profit opportunity in the process.

Knowing the exact number of ounces that stand for delivery says nothing about when to act on that information. The numbers have been low for some time, and bullish, as well, but if one went long on that concrete factual information, one could have sustained some hefty losses, at least in the futures market. Buying and holding the physical is a different matter and done for materially different reasons.
We prefer to follow what the market has to say about what all others are saying about the market, and opinions on the market are boundless. The actual number of participants who make an active buy or sell trade decision is what can be read from a chart, in the form of price and volume. It is the language of the market and how it speaks.
For all of the discontinuity between unprecedented demand and artificially suppressed "supply," the charts have been the most accurate barometer, as price rallied to the highs of $50, as well as back down to the $18 area.
Will silver lead gold in the next rally, or not? Which will bottom first? In some ways, it does not matter because the turnaround time factor will be very close. Here is how we read current price conditions in silver and what the market is saying about them.
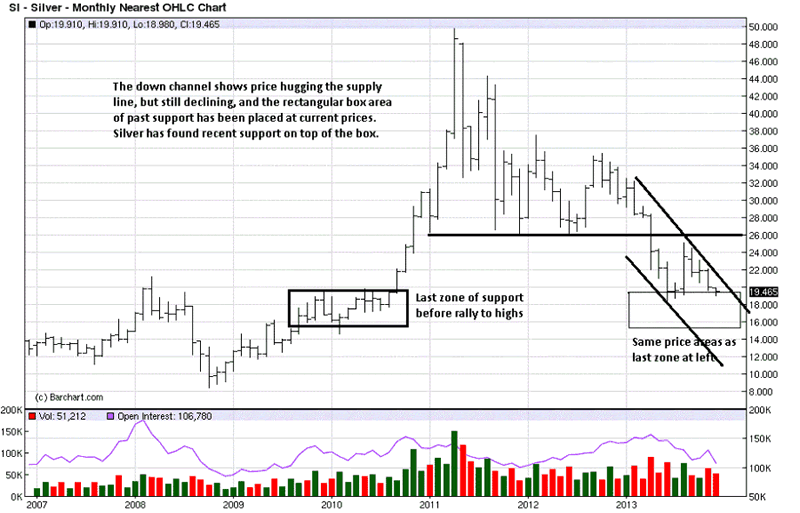
The higher time frames are more controlling and take more effort to turn. The monthly is great for establishing a context, and it is the preferred chart for smart money movers. They are not interested in day-to-day, and especially intra day activity, where the public spends most time and effort. In fact, not many traders ever look at a monthly chart.
By adding what may be some of the most important lines to capture and define developing market activity helps formulate knowledge of the trend and even its character, strong or weak, trending or moving sideways. The objective is to find any existing synergy between different time frames, which does not always happen.
The horizontal line at 26 was important support, and once broken, it has now become important resistance, whenever price returns to it. The next step was to draw a channel to see how the decline is developing within the obvious down trend. Concurrent with price location in the down channel, we see it is also returned to what was a base from which price rallied to the high at $50.
Two factors stand out. 1. price is staying close to the upper channel line and not the lower channel one. In a weak market, expect price to be near or exceeding the lower line. 2. The lows of the decline are staying above the previous support area, denoted by the rectangular box. It is a relatively positive sign when support is found atop a previous trading range.
Looking at the bar activity alone, the strong rally bar, 5th from the right, is being corrected by 4 months to retrace what 1 month accomplished to the upside. Wide-range bars tend to offer support. In a weak market, support tends to be at the lower end of the bar, and that is where price is, as of the week just ended.
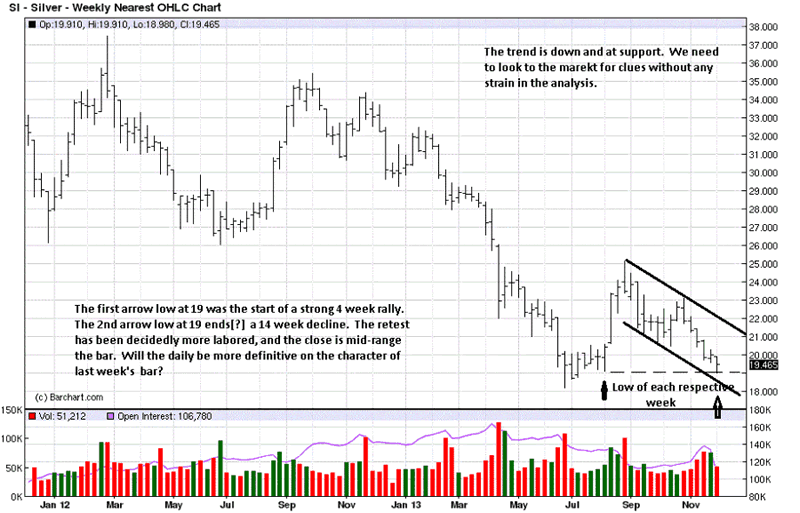
To get a better handle on what it may mean, we next look at a weekly chart. The month is still early, so no weight can be placed on it with 3 more weeks to go, although the last time price declined to this level, 6 months ago, the range was small and led to the rally just mentioned.


The focus is going to be current price activity, and not past. The first arrow, on the left, is the low for the month of August and the start of a strong 4 week rally. It has taken all of 14 weeks to retrace the 4 week gain. In a down market, you would expect the reverse, 4 weeks down and a labored 14 week rally, so this is a subtle message of which to be aware.
Last week being the 6th straight bar down, most of the closes were on the lower end of each bar. This last one has a close at mid-range. What that suggests is the presence of buyers overcoming sellers, at the low. A look at the daily will provide more confirmation or denial of that conclusion.
You can at least see a degree of harmony in activity between the two higher time frames.


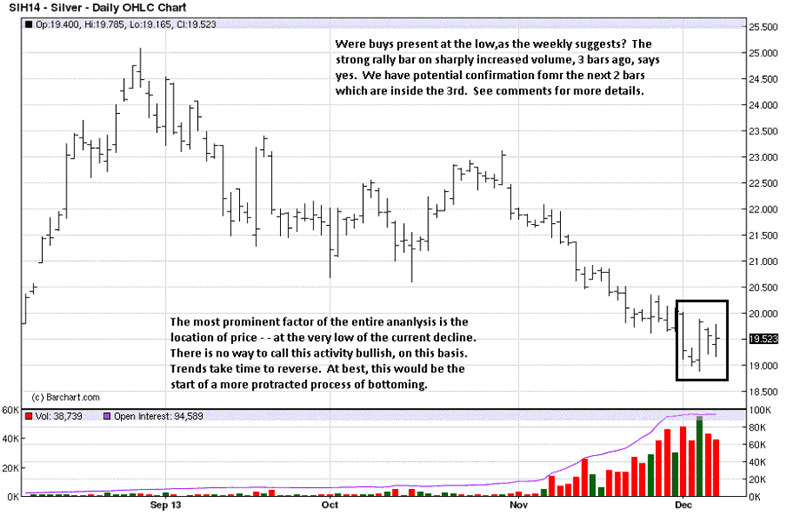
The chart comments address how support did indeed come into the market, strongly from the lows, 3rd bar from right. The next two bars were inside bars. What we take away from Friday's activity, the last bar, is a lower open and lower low from Thursday, but an ability to rally and close above the opening and just above mid-range the bar, a sign that buyers were more in control than sellers. Otherwise, price would have closed lower.
The conclusion to be drawn is respect for the trend, clearly down. Where we have shown a positive "spin" on the character of price behavior at the current lows, that is still where price is, at the lows. One can not be bullish here by any stretch of the imagination.
If silver is to find a bottom, whether current levels hold or not, it will take months for a base to develop from which price can launch a sustained rally. The one exception would be a "V-Bottom" rally where price simply takes off without building a base and accelerates higher. That is always a possibility.
As for taking a position in the futures, it cannot be from the ling side, for it would be against the prevailing trend in all time frames. As to buying physical silver, we are likely looking at a price level that will not be revisited in the next few generations. Price may still go lower, to some degree, but what the Federal Reserve is doing to destroy the fiat currency and the economy makes asking the question of to buy physical or not a superfluous one.
We cannot state strongly enough to buy, and personally hold as much silver as you can. The stage is set. Do not be fooled by the suppressed price of silver. Common sense says it will not last. No one knows how long it will take to end. Be prepared, for it is likely to get uglier than most expect, but the rewards will be great. Silver buyers already know that.

See the original article >>

Saturday, December 7, 2013

Buy Low And Sell High? Our Super Commodity System Do This For You

The system allows to take position on the market well in advance of traditional methods and greatly benefit the investor in the subsequent management of the open positions. Super Commodity works with simple and effective rules and with fixed and not optimized parameters.

Test and evaluate for free our Super Commodity system


Top 10 rules of portfolio diversification
If there is one thing the 2008 financial meltdown taught us, it is the value of a properly diversified portfolio. The second thing is that if you think you are diversified, you may need to check again. At the time, many thought they were, only to see losses across the board as assets that previously were uncorrelated moved together and sunk many a portfolio.
Today, figuring out what constitutes a diversified portfolio and, more importantly, how to actually assemble one can be a difficult and at times frustrating ordeal; every analyst and investment advisor has a different idea. To help you navigate these treacherous waters, we offer the following 10 rules of portfolio diversification.

1. Start with the end in mind. A diversified portfolio is not a one-size-fits-all product. Instead, it should be personalized, focusing on your personal long-term investment goals while considering your current personal circumstances. According to Michael Loewengart, senior investment strategist at E*TRADE Capital Management, your personal circumstances should take into account your current financial situation, expected future expenses and how far away from retirement you are. "The goal of asset allocation is to make sure the level of volatility in your portfolio is in line with your goals, personal circumstances and tolerance for risk," he says. Additionally, consider your temperament. If high-risk assets make you overly stressed, perhaps it would be better to stick with comparably low-risk alternatives.
2. Aim to reduce overall risk. Portfolio diversification has two goals, this being the first and what most people associate with diversification. If you have multiple assets in your portfolio, even if one is not doing well, you have others that are outperforming. As such, this reduces the overall volatility of the portfolio. "[Diversification] reduces your risk. Instead of being stuck in just one sector that may not do well at times, a diversified portfolio can sustain you and keep you in business," Michael Clarke, CEO of Clarke Capital Management, says.
3. Aim to enhance overall returns. Being able to capitalize in markets that are outperforming and adding to your bottom-line is the second goal of a diverse portfolio. Not only does owning a range of assets protect you in the event that one does poorly, but it positions you to take advantage of ones that perform exemplarily. "We try to have a finger in each of the different sectors because in our experience usually something is working and that one may save the bill," says Clarke.

4. Invest in multiple asset classes. Traditionally, a portfolio was considered diverse if it had a mixture of equities and bonds. As investors are becoming more sophisticated, other assets such as commodities, real estate and foreign currencies are receiving more attention. In order to reduce risk and enhance returns, investments in numerous asset classes help keep correlations among assets in check. Each class has its own drivers and its own speed bumps. Taken together, they help smooth out the ride.

5. Invest in multiple sectors within the asset classes. Just as investing in multiple asset classes reduces risk and enhances returns, so too does investing in multiple sectors within those asset classes. Just including equities, bonds and commodities is not enough as equities have sectors reaching from healthcare to industrial metals, bonds have a variety of maturations and commodities include energies, metals and foods. "You want to be allocated amongst the various market sectors and industries. Across asset classes, you want to have further diversification into the different segments," Loewengart says.

6. Own assets that do well in bull, bear and sideways markets. This point really stresses the need for owning a diverse array of assets. You do not want to place all your eggs in a basket that does well when the stock market is moving up, because that also means your portfolio will do very poorly when that bull market turns into a bear. Instead, it usually is advisable to own assets with a negative correlation in which one asset moves higher while the other moves lower. Examples of this relationship include the U.S. dollar and crude oil as well as stocks and bonds. It is often true that in times of crisis all correlations go to 1.0, but some strategies are more resistant to this. It is wise to look broadly at how various assets perform in different environments.
Commodity Trading Advisor Salem Abraham pointed out following 2008 that nearly all asset classes were long the economy. Managed futures, which are diversified in their own right through being long or short disparate sectors like agriculture, metals, energies, interest rates and currencies, also perform well in periods of high dislocation. Other diversified asset classes had the same negative response to the economic crisis but managed futures did well by taking advantage of fat tail events rather than being punished by them.
7. Have a disciplined plan for portfolio rebalancing. If you have constructed your portfolio properly, it is to be expected that some assets will outperform others and over time begin constituting a larger percentage of your portfolio. That is the time to rebalance and bring your investments back in check with one another. "If you have a disciplined plan for rebalancing in place, then you can capitalize on the different movements that will take place from the different assets in your portfolio," Loewengart says.
He explains that that discipline will enable you to automatically sell out of your outperforming assets and buy into those underperforming. Consequently, you will naturally be selling high and buying low.

8. No "borrowing" among classes except during rebalancing. Trading can become emotional and that can cloud your judgment. It may seem like a good idea to abandon an investment decision that is not immediately paying off or to bolster ones that are doing well. Proceed with caution, because that is a move that catches many investors. The reason for having a rebalancing plan is to remove that emotional element. "When you look at your portfolio, rebalancing with a stated framework is going to give you the discipline that many investors inherently lack," Loewengart says. That discipline helps you do the things that you may not want to do, but are in your best interest.

9. Backtest your portfolio, but consider current market conditions. Backtesting can help you see correlations that exist in your portfolio and can allow you to see how it would stack up in various market conditions. There is a reason, though, that investment advisors are required to say, "Past performance is not indicative of future results." Also, remember there will be periods in the past in which your portfolio would not have fared well.
Past events can provide a framework, but also consider current market conditions to better position your portfolio for future events. We can learn a lot from the past, but current events are shaping
tomorrow’s markets.

10. Test asset correlations periodically. If there is one thing we can count on in the markets, it’s that they will never stay exactly the same. What was negatively correlated one year can move lock-step the next. Consequently, it is not enough to simply rebalance from time to time; you also need to test the asset correlations in your portfolio periodically to see if anything has changed. As markets change, you need to make informed decisions as to how you need to alter your portfolio to counter those changes. You can’t expect your portfolio allocation decisions to be a one-and-done event; as markets change, so to must your portfolio.

These rules leave a lot to personal judgment and that is the key to success. One additional item to point out is that any allocation to a less liquid asset should calculate that liquidity risk in addition to other risks to achieve the proper allocation.
Your portfolio should fit your needs. Unfortunately in the past not all potential asset classes were available to retail investors. Today, thanks to innovative exchange-traded funds (ETFs) and mutual fund structures, nearly every investor can access commodities, currencies, short and leveraged strategies as well as active strategies including managed futures. Now everyone truly can be diversified.

Should You Still Use Commodity to Diversify Investment Portfolio?
A new study from the Bank of International Settlements (BIS) raises doubts about the value of commodities as a tool for enhancing portfolio diversification. The paper’s smoking gun, so to speak, is that “the correlation between commodity and equity returns has substantially increased after the onset of the recent financial crisis.” Some pundits interpret the study as a rationale for avoiding commodities entirely for asset allocation purposes. But that’s too extreme.
In fact, this BIS paper, although worth a careful read, isn’t telling us anything new. That said, it’s a useful reminder for what should have been obvious all along, namely: there are no silver bullets that will lead you, in one fell swoop, to the promised land of portfolio design. The idea that adding commodities (or any other asset class or trading strategy) to an existing portfolio will somehow transform it into a marvel of financial design is doomed to failure. Progress in the art/science of asset allocation arrives incrementally, if at all, once you move beyond the easy and obvious decision to hold a broad mix of the major asset classes.
Correlations are a key factor in the design and management of asset allocation, but they’re not the only factor. And even if we can find assets and strategies with reliably low/negative correlations with, say, equities, that alone isn’t enough, as I discussed last week. You also need to consider other factors, starting with expected return. It may be tempting to focus on one pair of assets and consider how the trailing correlation stacks up today. But that’s hardly the last word on making intelligent decisions on how to build a diversified portfolio.
Perhaps the first rule is to be realistic, which means recognizing that expected correlations, returns and volatility are in constant flux—and not necessarily in our favor, at least not all of the time. Bill Bernstein’s recent e-book (Skating Where the Puck Was: The Correlation Game in a Flat World), which I briefly reviewed a few months ago, warns that the increasing globalization of markets makes it ever more difficult to earn a risk premium at a given level of risk. As “new” asset classes and strategies become popular and accessible, the risk-return profile that looks so attractive on a trailing basis will likely become less so in the future, Bernstein explains. That’s old news, but it’s forever relevant.
As more investors pile into commodities, REITs, hedge funds, and other formerly obscure corners, the historical diversification benefits will likely fade. Granted, the outlook for expected diversification benefits fluctuates through time, and so what looks unattractive today may look considerably more compelling tomorrow (and vice versa). But as a general proposition, it’s reasonable to assume that correlations generally will inch closer to 1.0. That doesn’t mean that diversifying across asset classes is destined to become worthless, but the expected payoff is likely to dim with the passage of time.
The good news is that this future isn't a total loss because holding a broad set of asset classes is only half the battle. Your investment results also rely heavily on how and when you rebalance the mix. Even in a world where correlations are higher and expected returns are lower, there’s going to be a lot of short-term variation on these fronts. In other words, price volatility will remain high, which opens the door (at least in theory) for earning a respectable risk premium.
Still, it’s wise to manage expectations along with assets. Consider how correlations have evolved. To be precise, consider how correlations of risk premia among asset classes compare on a rolling three-year basis over the last 10 years relative to the Global Market Index (GMI), an unmanaged market-weighted portfolio of all the major asset classes. As you can see in the chart below, correlations generally have increased. If you were only looking at this risk metric in isolation, in terms of history, you might ignore the asset classes that are near 1.0 readings, which is to say those with relatively high correlations vis-a-vis GMI. But by that reasoning, you’d ignore foreign stocks from a US-investor perspective, which is almost certainly a mistake as a strategic decision.

Nonetheless, diversifying into foreign equities looks less attractive today compared with, say, 2005. Maybe that inspires a lower allocation. Then again, if there’s a new round of volatility, the opportunity linked with diversifying into foreign markets may look stronger.
The expected advantages (and risk) with rebalancing, in other words, are constantly in flux. The lesson is that looking in the rear-view mirror at correlations, returns, volatility, etc., is only the beginning—not the end—of your analytical travels.
Sure, correlations generally are apt to be higher, which means that it’s going to be somewhat tougher to earn the same return at a comparable level of risk relative to the past. But that doesn’t mean we should abandon certain asset classes. It does mean that we’ll have to work harder to generate the same results.
That’s hardly a new development. In fact, it’s been true all along. As investing becomes increasingly competitive, and more asset classes and strategies become securitized, expected risk premia will likely slide. But what’s true across the sweep of time isn’t necessarily true in every shorter-run period. The combination of asset allocation and rebalancing is still a powerful mix—far more so than either one is by itself. And that’s not likely to change, even in a world of higher correlations.

Follow Us