Saturday, July 13, 2013

Another entrant into currency wars? China halts the yuan appreciation

by SoberLook

China's policy of gradual appreciation of its currency has been put on hold. Since the currency is not freely convertible, the authorities generally have a great deal of influence over the exchange rate. Typically when China's growth was deemed to be at risk, such as during bouts of Eurozone-driven financial stress, the renminbi would flat-line or even depreciate against the dollar. Given that the renminbi strength puts China's exporters at a disadvantage, particularly when Japan has been in a devaluation mode, the authorities are probably somewhat concerned. The fact that China's exports have stopped growing (see discussion) is clearly not helping.

Reuters: - An unexpected slump in exports in June marked the latest worrying sign of a slowdown in the world's second-biggest economy and raised the prospect that regulators may be forced to drag the yuan back down after a massive rally this year.
Unfortunately for policymakers, while a weaker yuan might improve the price of Chinese goods sold abroad, it will not be the cure all for exporters. Other factors are driving up production costs at Chinese companies and undermining their competitiveness abroad.
Still, economic reformers at the People's Bank of China (PBOC) will come under pressure to use brute-force exchange rate manipulation to stave off a potentially destabilizing round of factory layoffs.
Liu Ligang, Greater China chief economist at ANZ bank in Hong Kong, said some sort of adjustment - including pushing the currency lower - was likely since policymakers were behind the curve in dealing with a longer downturn in exports demand than expected.
"PBOC policy needs to be corrected according to the changed external environment," he said.
Of course this could further irritate a number of US politicians who are likely to raise the issue of China's controlled currency. Recently a number of US senators introduced legislation to allow the US Department of Commerce to impose tariffs on those nations who are labeled a "currency manipulator". And there will definitely be calls to include China in this camp. The US Administration is also uneasy with the situation. Yesterday for example, the US Treasury Secretary Jacob Lew suggested that China should let its currency appreciate further.
Jacob Lew: - "We have acknowledged that there has been progress in closing the gap, but we've also made it clear that there's still more progress that needs to be made in order to reach the point where there's truly a market-determined rate."
While halting the appreciation would be unwelcome in the US, a depreciation, as suggested by the Reuters story above, would certainly heighten tensions between the two nations. But China has its domestic priorities, and unless exports improve soon, currency "adjustment" could become China's tool of choice.

CNY per one dollar (lower level indicates stronger yuan; source: Investing.com)

See the original article >>

Gold market report: a far better tone to precious metal markets

by Alasdair Macleod

This week bullion prices began to rise in quiet conditions, with gold rising over 6% and silver by slightly more. Trading patterns have changed, with much of the rise coming during US trading hours, confirming that the short positions on Comex are being squeezed.

These shorts are at record levels, as shown in the chart below of Managed Money shorts.

Managed Money short position

And it is not just Managed Money: the Swaps are now nearly in balance, as are ”Other Reported Positions” (i.e. large speculators) courtesy of their near-record shorts. And as we know, the bullion banks are now prepared for a price rise, having gone net long. But the most interesting development this week is Gold Forward rates (GOFO) turned negative.

When GOFO goes negative it indicates that the cost of leasing gold is greater than LIBOR. The normal condition is for gold leasing rates to be less than dollar LIBOR, giving a positive GOFO figure. Admittedly, one could argue that with LIBOR reflecting the Fed’s zero interest rate policy this is no big deal. However, it does reflect a shortage of gold liquidity.

We have to consider this in context. I have managed to establish beyond doubt that central banks have been supplying the market with physical gold for the price to remain near current levels in the face of high global physical demand. The link to the relevant article is here. Therefore, GOFO turning negative is a sign that central banks are at least reducing the pace of their gold leasing, and might even be withdrawing from the market altogether.

It is against this background we need to also consider the very low levels of liquidity indicated by the dealers’ bullion held in Comex-registered vaults, which has fallen to less than 31 tonnes (representing settlement for only 10,000 contracts). Interestingly, few days pass without an exchange-for-physical settlement in the active August contract, totalling 45,305 contracts this week alone. Furthermore, not all of the expired May contract appear to have been settled.

Therefore we must conclude that liquidity in both physical and paper markets from all sources has dried up.

The lack of supply, including liquidity provided by central bank leasing, tells us gold is simply priced at the wrong level, and needs to adjust upwards at least to the $1,550-1,575 level established before the market was driven lower in early April.

A move of this magnitude is completely unexpected in the market, except perhaps by the bullion banks which have transferred their shorts to hapless hedge fund managers, reflected in the chart above. But this is what bear squeezes are all about: the last seller has sold, the stock has disappeared and there is none now available. Prices in these conditions usually rise very rapidly.

See the original article >>

Gasoline Futures Market Rises 45 Cents in 10 Days

By EconMatters

Price Gouging?


Gasoline RBOB futures closes Friday above 40 cents from the price on July 1st which was $2.70 and even reached a high of $3.15 on July 12, without any major news like 5 refiners exploding, a major hurricane demolishing energy infrastructure, or supplies being really scarce.


Supplies Higher Than Last Year


It isn`t due to real demand as gasoline supplies are actually 221 million barrels in storage versus last year when they were 207 million barrels. And to further point out the absurdity in the gasoline market, RBOB futures prices were $2.71 a year ago at this time. So we have more supplies and higher prices from a year ago. Shoot just a couple of days ago RBOB Futures were $2.86. These moves are ridiculous, and they might make sense if Israel attacked Iran, Unemployment was 2% overnight, the US was using more gasoline than usual by a factor of 10, or there was a shortage of oil.

Further Reading: Gold Sitting at Ledge of 2-Year Support Cliff

Less than 1% of Paper Markets Take Delivery


None of these things have occurred and the real ramp in gasoline prices which are going to hit the pump this weekend to the shock of consumers is pure speculators pushing the prices up in paper markets where nobody actually takes delivery of said products. Less than 1% of all energy paper market transactions are ever physically delivered to buyers, and unfortunately for consumers the prices in the physical market are set by the paper/electronic futures markets.

Further Reading: The Stock Market is a Giant Ponzi Scheme

So regardless if JP Morgan has no intention of actually taking physical delivery of gasoline, i.e., they have no use for it as a bank/hedge fund, and as their earning`s point out they make a whole lot of money from running up the paper markets, consumers get stuck with the bill of higher prices at the pump.

Artificial Prices


How do you know these prices are artificial? Easy, do you honestly think there was a massive run on gasoline during the last two weeks? Just look at supply levels versus last year! Look at prices versus last year. It is all a scam by the players involved. Another reason you know prices are artificial is because if the president merely discussed that he was going to release the SPRs to counter higher oil prices, gasoline prices in the RBOB futures market would drop 45 cents in 3 days. If it was true market forces prices would stay high, or only moderate slightly after the threat or release of the SPRs.

SPR`s Threatened Last Year


How do we know because the very thing happened last year, which by the way was an election year, and the president thought that higher gasoline prices would be harmful to his campaign so he made the threat, and prices dropped like a rock last summer. He didn`t have to actually release any supplies, just the threat made energy prices drop like a rock, i.e., oil dropped over $25 a barrel last summer.

There wasn’t true demand last year, and there sure isn`t true demand this year. Americans basically have been using less gasoline, and trending down the last five years as we are a mature gasoline consuming market with higher fuel efficiency standards, newer vehicles replacing old vehicles, and prices have been relatively high despite the weak economy, so consumers have started using fuel more efficiently, i.e., one large trip to the mall or store versus 5 smaller trips.

Further Reading: Lumber Prices near the Top of their Historical Range

I Guess It Was All About the Election


Frankly the president to be consistent (if this wasn`t a political ploy for votes last year like most critics stated at the time) needs to threaten the release of the SPRs next week if he gives a damn about thestruggling middle class in this country. The last thing poor people, citizens on fixed incomes, or just economic growth in general for a 1.8% GDP growth rate economy needs is a 45 cent per gallon tax increase in two weeks.

Criminal Activity?


The fact that a business through the help of the speculators, without any market supply disruptions can get away with this activity ought to be criminal. The general public should be outraged! This is like gouging consumers for batteries and generators during a hurricane, and we have laws against this activity. But yet this crap goes on all the time in the gasoline and oil markets.

Further Reading: Is Inflation really a Problem?


The Reason SPRs Work Is Because It Is All Manipulation to Begin with…


I realize the SPRs weren`t meant to be used to control speculators but it sure works, and has for the last three years. Every time prices spike the president either threatens or actually release the SPRs, and like magic the speculative cockroaches run for the hills, and in the end nobody really wanted the gasoline and oil after all, even at much reduced prices. 

A Rigged Market Requires Governmental Oversight


The oil industry is a monopoly, and consumers rely on the product to go to work, so without government intervention in a rigged market built around speculators with a high utilization of carry trades and QE funds at their disposal, we get a 45 cent price hike in 10 trading days without any supply disruptions.

Take Physical Delivery, Then We Have a Legitimate True Energy Market

There are two solutions: Make everybody who buys or sells a futures contract take or provide delivery, and prices would drop by 50% easily, or when speculation gets out of hand use the SPRs to say enough is enough of this ridiculous price gouging as this is hurting consumers and our economy. So where are you Mr. President Obama? This is where leadership steps up to the plate, not just during election years.

See the original article >>

The Week Ahead: What's An Investor Tto Do Now?

by Tom Aspray

The stock market has been on a tear since the June 24 lows as last week’s gains surprised even the most bullish analysts. The S&P 500 gained 3% for the week and over 6% since the June lows.

The comments last week by Fed Chairman Ben Bernanke fueled a new round of optimism as we entered earnings season. He appears to have silenced concerns that the Fed would cut back on its stimulus. It has been a global affair as the world stock markets are on track to have their best weekly gain in eight months.

The strong earnings from both JPMorgan Chase (JPM) and Wells Fargo (WFC) Friday were a pleasant surprise as heading into earning’s season the consensus estimates was for them to be a fraction lower than the 1st quarter.

A report from Citigroup (C) said that preannouncements on earnings were the most negative since 2009. An early example of this may be United Parcel Service (UPS) as they missed their quarterly earnings and lowered the yearly forecast on Friday. Their stock was down over 5%

The forecasts for earnings growth are the best for the financial sector, which is expected to show a 16% gain this quarter. This is consistent with the technical outlook that I reviewed in last week’s trading lesson, as the monthly, weekly, and daily analyses are positive for the Select Sector SPDR Financial (XLF).

chart
Click to Enlarge

Many investors are trying to determine how they should be investing as the sharp drop in many bond funds has made them question the wisdom of having a large percentage of their portfolio in bonds.

This table from the WSJ shows some of the bond market’s best and worst performers relative to their benchmarks. At the top of the list is the Loomis Sayles Bond Fund (LSBNX), which was down 1.4% beating its benchmark’s 2.5% loss. The DoubleLine Total Return Bond (DLTNX) also beat its benchmark and was the first recommendation in my Eyes on Income column.

On the other end of the spectrum was the 12.4% drop in the Pimco Total Return Asset Institutional (PTTRX) and the 14.3% loss in the DMS India Bank (DAIBX). For those who bought bond funds for safety, these kind of results have been an unpleasant wake-up call.

Two weeks ago in Will the Rates Rally Fizzle or Sizzle? it was my view that the rise in yields was close to a short-term top and that bond holders would get another chance to adjust their bond portfolios this summer.

chart
Click to Enlarge

The daily chart of the 10-year T-note yields shows that yields hit their highest level five days later on July 5. The short-term top has not been confirmed yet but a drop in yields below 2.460% will signal a further decline.

One of my favorite momentum indicators, the MACD, did form a divergence at the recent highs and is negative, consistent with a short-term top. It is quite normal after the completion of a reverse H&S bottom to see a retest of the neckline, which is at 2.278%. This is just below the 38.2% Fibonacci retracement support with the 50% support at 2.173%.

Therefore, a further pullback in yields is still likely this summer but that should be followed by another rally in yields and a further drop in bond prices. This raises the question of what percentage you should have in bonds and what percentage in stocks?

chart
Click to Enlarge

The answer, of course, depends on the individual’s age, as well as other factors, though I have always favored a higher concentration in bonds than stocks. The table above shows how an $100,000 investment would have performed over the past ten years given different portfolio mixes.

The all stocks (represented by the S&P 500) would have grown to $202,249 which is an annualized return of 7.3%. The all bond (using the Barclays US Aggregate Bond Index) would have grown to $155,585 for an annualized return of 4.5%. The performance of the 50/50 mix was in the middle.

I have been recommending since the end of May (4 Ways to Summer-Proof Your Portfolio) that those in bonds should shorten the maturity of their bond portfolio and to gradually build a stock portfolio in the summer months.

It’s important not to chase the market; concentrate on the entry as well as the risk. This should be done in the framework of an overall plan of how much you want to have in each asset class by the fall.

If you have multiple accounts, it is important to be sure you know what percentage is really in each asset class. Next week, I will look at the alternatives that you might consider for shortening the maturity of your bond portfolio.

Though the current data suggests a continually improving economy, there will be some hiccups along the way as the summer months are known for their sharp drops. If the economy is significantly stronger by year end, which is what the stock market is suggesting, I expect to see a low in some of the beaten-down emerging markets.

From a technical standpoint, the correction in the Japanese stock market appears to be already over as new positions were added on the recent drop. I think we are likely to see more problems arise from the Eurozone this summer as their bond yields have also turned higher. This could be a problem for the weakest Eurozone countries. There will also be pockets of strength for new buying opportunities.

The economic calendar was light last week, though on Friday, the Producer Price Index came in at 0.8%, a bit higher than expected while the mid-month University of Michigan Consumer Sentiment was slightly lower.

There is a full slate of data this week as Monday we get Retail Sales, the Empire State Manufacturing Survey, and Business Inventories. Then on Tuesday, there is the Consumer Price Index, Industrial Production, and the Housing Market Index.

On Wednesday Housing Starts will be released with jobless claims and the Philadelphia Fed Survey on Thursday.

What to Watch
The positive divergences in the McClellan oscillator that I discussed in my trading lesson were confirmed on June 27, which was three days after the lows. By early last week, the A/D lines had broken out to the upside confirming that the correction was over.

The rally has been spectacular but this is not a market where you want to chase the indices as most are already close to their starc+ bands. There are many industry groups and stocks like the homebuilders that appear to have just completed their corrections, which will set up good opportunities on a pullback.

Instead of a significant market correction in the S&P 500, we may see more of rolling corrections where strong sectors take a breather and drop back to support. This is what I think we are now seeing in the regional banks as the SPDR S&P Regional Banking ETF (KRE) is down 3.4% from the July 8 highs.

The sentiment did turn more bullish last week as the number of bulls in the AAII survey jumped to 48.9%, up from 42% the previous week, and 29.5% on June 6. The percentage of bears is at 18.3%, which is the lowest reading since January 2012. The financial newsletter writers were also a bit more optimistic as 46.9% are bullish with 22.9% bearish.

The bottom formation I pointed out in the number of NYSE stocks above their 50-day MAs has been confirmed as it dropped below 26 at the market lows on June 24 and has now risen to 66.

The NYSE Composite came very close to its daily starc+ band last Thursday before Friday’s quiet session. The NYSE is still over 2% below its May high at 9705. The correction held between the 38.2% and 50% Fibonacci retracement support levels from the November lows, which is quite typical.

The McClellan oscillator formed two bullish divergences in June (line b) that were confirmed on June 27 when it moved above the zero line and its previous peak. It turned lower Friday consistent with a short-term pullback.

chart
Click to Enlarge

The NYSE Advance/Decline line moved back above its WMA on the same day and now shows a clear pattern of higher and higher lows. It should hold near its rising WMA on a pullback.

There is first support at 9267 and the 20-day EMA. The quarterly pivot is at 9251 with the monthly at 9143. In a daily column last week, I provided a table with quarterly pivot levels for the key ETFs, which I suggest you keep for reference.

S&P 500
Even though the rally over the past six days has been impressive and the Spyder Trust (SPY) made a new closing high, the intra-day high at $169.24 has not been reached. The decline in June just barely dropped below the 38.2% support level.

The daily OBV lagged prices for the first few days after the low but picked up strength this week. The downtrend, line b, has been overcome and the WMA is now rising. Look for a drop to WMA and then a resumption of the rally.

chart
Click to Enlarge

The S&P 500 A/D line has accelerated to the upside since it moved above its WMA on June 26. The A/D line moved above the May highs (line c) early last week, which is a bullish sign. The WMA of the A/D line is now clearly rising and should provide first support. The A/D line held well above its long-term uptrend on the correction

There is initial support in the $166 area and then at $164.27. The rising 20-day EMA is at $163.41 with the quarterly pivot at $161.01.

Dow Industrials
The SPDR Diamond Trust (DIA) came close to the old highs at $154.98 to $155.14 (line d) but also made a new closing high last Thursday. DIA tested the uptrend from last November’s low but held well above the 38.2% support at $143.47 on the correction in June.

The daily Dow Industrials A/D line broke out of its trading range, line f, last Tuesday and has been acting very strong as it made convincing new highs. The uptrend in the A/D was slightly violated on the correction.

There is initial support at $152.40-$153 with the rising 20-day EMA at $151.19. Additional support is at $150 with the quarterly pivot at $149.52. DIA did trigger an HCD the day after the lows as I noted last time and it turned out to be a very good signal.

chart
Click to Enlarge

Nasdaq-100
The PowerShares QQQ Trust (QQQ) has led the market on the upside as it has gained over 8% from the June lows. It made convincing new highs last week as it gapped sharply higher last Thursday. On the June decline, it broke the 38.2% support intra-day but did not close below it.

QQQ finished the week near its daily starc+ band as it came very close to the quarterly R1 resistance at $75.19. The weekly starc+ band is at $76.67.

The Nasdaq-100 A/D line moved through its resistance on June 28, and then after a slight pullback to the breakout level (line c), accelerated to the upside. The A/D line moved to new highs a couple of days before prices

There is initial support now at the gap between $73.62 and $74.25 with further at $72.70 (line a) and the rising 20-day EMA. The quarterly pivot is significantly lower at $71.13.

Russell 2000
The iShares Russell 2000 Index (IWM) also had a great week, up over 3%, and after closing above the resistance at line d, it really took off. It has already exceeded the 127.2.% retracement target at $102.27 and the quarterly R1 resistance with the R2 at $106.65.

The daily OBV confirmed the breakout in prices by moving through its resistance at line e. It is acting very strong.

The Russell 2000 A/D line caught up with prices after moving to new highs and overcoming the resistance at line f. It is well above its rising WMA so a pullback would not be surprising.

There is initial support at $99.80 to $101.20 with the rising 20-day EMA at $99.20.

See the original article >>

HY outflows hit record. Outperformance narrowing

by SoberLook

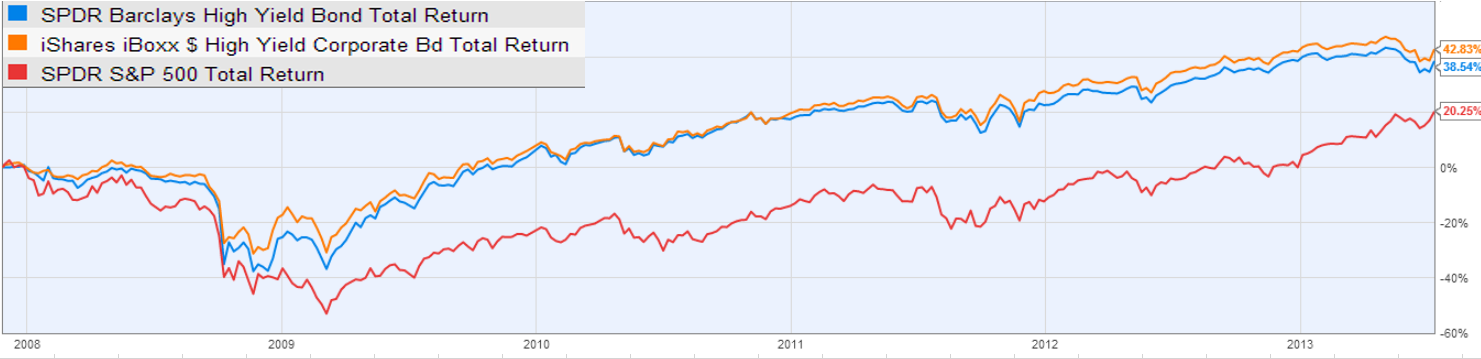
An investment in the S&P500-indexed portfolio right before the financial crisis and held through today would certainly outperform an investment into junk bonds, right? Wrong. The chart below shows the returns of two major HY ETFs (blue and orange) and the largest S&P500 ETF (red). Since the end of 2008, junk bonds have consistently outperformed. As one HY trader pointed out "all of you stock pickers were in the wrong asset class".

Total returns (source: Ycharts; click to enlarge)

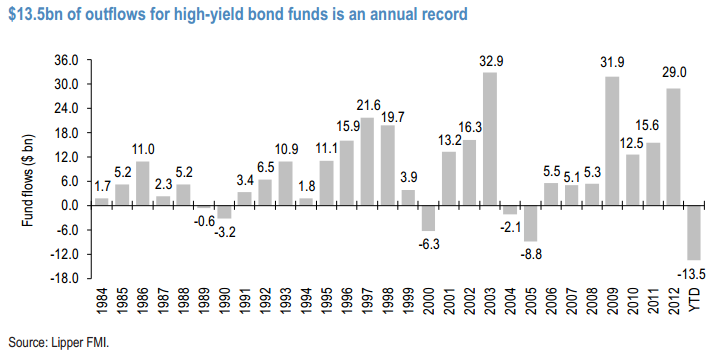
But now, with interest rates on the rise and fixed income markets out of favor, that gap has been narrowing. Relative to other fixed income products junk bonds have held up quite well - so far (see post). What worries some HY investors is that junk bond pricing is very dependent on fund flows. Equities are also impacted by money moving in and out of ETFs and mutual funds, but not nearly to the same extent as corporate bonds. And the recent trend in HY bond flows is alarming. The outflows hit an annual record recently.

Source: JPMorgan

It remains to be seen when and if equities ultimately catch up to HY bonds. But if these outflows continue, it won't take long.

See the original article >>

Currency Positioning and Technical Outlook: Consolidative Phase Ahead

by Marc to Market

The recent US dollar uptrend began in mid-June, encouraged by anticipation of Fed tapering and the resulting wider interest rate differentials. Comments by Federal Reserve Chairman Bernanke last week were interpreted by market participants as indicating that the reduction of asset purchases in the Sept/Oct period, which had solidified as the consensus view, was not a done deal. This sparked a sharp dollar sell-off.

Most of that sell-off took place in thin market conditions, after the NY session ended but before the Asian session began in earnest. Leaving aside the Australian dollar, the other currencies have held in better than one might have expected given the lack of participation. This is illustrated, for example, by the Dollar Index which has thus far not even retraced the minimum 38.2% of the nearly 2.8% Bernanke-induced slide, which is found near 83.30.

Bernanke delivers the first leg of the Fed's semi-annual report to Congress Thursday July 18.  Given Bernanke's recent track record for injecting volatility into the foreign exchange market, we suspect that the dollar is likely to broadly consolidate as participants await clearer signals of the Fed's intent.  The price action suggests that the short-term market positioning is not as extended  now and this may mean it is less vulnerable to another Bernanke shock.

Our longer term bullish dollar outlook has not been impacted by the near-term volatility or the possibility that the Fed's exit strategy is more prolonged than the market had come to anticipate.  We have argued that the tapering may begin later than the consensus expected.  This view was based on 1) ideas that the economy would stay weak in Q3 and that underlying employment growth was not accelerating; 2) that low core inflation might not be able to be ignored if there is no serious pick up in the coming months, and 3) that game theory insight suggests the Fed has more to gain in terms of anti-inflation credentials by creating the conditions for the next Fed chairperson to pullback from the full throttle monetary policy.

The $1.2930-80 area may be the key to the euro's technical outlook.  A break through here and it would suggest that the upside correction was sharp but brief and that the downtrend is set to resume. On the upside, a move back above $1.3100 would suggest another upleg is likely.  that could extend toward $1.3400. 

Sterling was squeezed nearly 4 cents higher in response to Bernanke. It has retraced almost 38.2%, which comes in near $1.5065.  Below there are the 50% retracement around $.15020 and the 61.8% retracement near $1.4970.  A break of these areas is needed to signal the resumption of the bear tend.  On the upside, resistance is see near $1.5200 and then $1.5280. 

The dollar's dropped more than three yen to about JPY98.25.  This represents a little more than 38.2% retracement of the dollar advance from mid-June (~JPY93.80) to the July 8 high just above JPY101.50.  The JPY100.00-25 area is likely to cap greenback gains until at least the US 10-year yield stabilizes.    Some of the technical indicators are generating conflicting signals.  The Relative Strength Index is dollar supportive, while the MACDs are warning of dollar weakness.    The contradiction is likely to be resolved in consolidative trading. 

The Australian dollar had a more muted reaction to Bernanke's comments, failed to sustain even minimal upticks and recorded new multi-year lows before the weekend, dipping briefly and slightly through the $0.9000 level.   The weight on the Aussie comes from rising expectations of a rate cut in August and as a proxy for Asia and in particular China.  China's GDP (and other data) are to be reported before the markets open on Monday and there is concern about softer data.  There is also some talk of sovereign supply.  The Aussie can recover into the $0.9100-50 area without really improving the technical tone. 

It appears Bernanke's comments helped the greenback complete a downside correction against the Canadian dollar, which had actually began a few days before the Chairman spoke.  In the sell-off in response to Bernanke, the US dollar cam within a whisker of the 61.8% retracement of the gains score since mid-June.  That area, around CAD1.0320, should offer the greenback support and we envisage a near-term test on the CAD1.0450-CAD1.05 area. 

The Mexican peso finished last week near its best levels since mid-June.  The overcrowded positioning has been alleviated and we suspect short and medium term participants are getting back involved.   We see scope for further dollar slippage toward MXN12.60-MXN12.70 in the days ahead.  Resistance is seen near MXN12.90. 

Our trade of the year is long Mexican pesos against the Australian dollar.  At the end of last week, it recorded a fresh three year low.  The rationale for the trade remains valid.  It seems that trade strategies can be put into three bucket:  trend following, mean reversion and carry.   This trade can be seen as all three.  It presently enjoys good momentum (trend following).  It is mean reversion in the sense that the OECD's PPP model still have the peso as the most under-valued currency (~67%).  The Australian dollar has depreciated, but by the OECD's reckoning, it is still 25% over-valued.   Mexican interest rates are above Australia's, giving the trade a (modest) carry component as well. 

The Aussie finished last year near MXN13.36.  It slipped below MXN12.00 by the end of May and generally traded between MXN12.00 and MXN12.50 through the end of June.  It briefly traded below MXN11.60 before the weekend.  Bounces toward MXN11.80 may offer a new opportunity to participate tin the trend move that we now project can extend toward MXN11.15. 
Observations on the speculative positioning in the CME currency futures:
1.  The net position swung from long to short in the euro and Swiss franc in the reporting week ending July 2.
2.  The general pattern was for the gross long positions to be reduced and the gross short positions to increase.  There were a few exceptions.  Speculators slightly added to their long Swiss franc, Canadian dollar and Mexican peso position.    Short Australian dollar and Mexican peso positions were reduced.
3. In the five sessions prior to Bernanke's speech on July 10, there were minor position adjustments in the currency futures (less than 10k contract adjustment in gross positions).  The only exception was 17.7k contract expansion of gross short euro position.  Nine of the 14 gross positions we review here changed by 5k or few contracts.
4.  However, this obscures the large change in positions over the past few weeks.  The late shorts were in weak hands.  We suspect that Bernanke's remarks triggered a short squeeze, which, coupled with the thin markets at the time helps explain the dramatic price action.    Gross euro shorts had grown by more than a third over the past two reporting periods.   Gross yen shorts had expanded by 25%.  Gross short Canadian dollar futures rose by two-thirds.

See the original article >>

Follow Us