Tuesday, June 18, 2013

Pessimism Creates Buying-on-the-Dip Opportunity

By Rodney Hobson

Rodney Hobson had felt it was difficult to find opportunities in the UK stock market, but the recent reaction to economic news has allayed his concerns.

Back to Front
Markets have taken fright at the prospect of various governments, most notably in the United States, bringing economic stimulation to an end. This should be a cause for rejoicing and the latest falls in the London stock market present a buying opportunity that I feared might not occur until much later in the year, if at all.
It is a well known phenomenon that the same economic measure can have opposite effects on the stock market at different times. If a government takes measures to help the economy, that can be taken either as a signal that things will start to get better or a warning that the economic situation is worse than we thought.
Similarly when the government tightens up, that can be taken to mean either that things are getting better or that we should all start to batten down the hatches. The problem is that you never know how market sentiment will react to the news.
Hints that the US government will let its economic stimulus program tail off later this year, plus the reluctance of the Bank of England’s monetary policy committee to indulge in more quantitative easing, has caused a sharp fall in the FTSE 100 index. The inability of the European Central Bank to come up with any new ideas on ending recession and severe unemployment on the Continent has made matters worse.
Let us take them one by one. The reaction of markets to developments in the US is, in my view, particularly irrational. The US economy has come out of the financial crisis reasonably well, indeed exceptionally well considering that it all started with the collapse of the US housing market and the stand-off in Washington between Republicans and Democrats rumbles on.
We should be pleased that the Fed feels it is now in a position to let the US economy stand on its own two feet. The sooner that happens, the less difficult and painful it will be to unwind all the support dished out so far. In any case, the Fed is not proposing a sudden lurch from one extreme to another but a gradual tapering of economic stimulus, sensibly weaning the economy off its life support.
Similarly, the sooner the MPC brings quantitative easing to an end in the UK the better. Its reluctance to indulge in more buying of gilts reflects a belief that the economy is improving, albeit slowly. Latest indications of growth in services, manufacturing and construction support this view.
The eurozone is the most problematic area. As a whole, the continuing recession on the Continent is far worse than in the UK (new readers please note, I do not accept the ludicrous notion that a recession is two consecutive quarters of contraction and that one quarter of growth ends recession). While it is worrying that the ECB feels unable to do anything more at this stage to rescue the situation, I take a little comfort from the absence of any rash, knee-jerk measures. At least the ECB has been able to put off panicking for another month.
I believe that the fall in share prices has more to do with the fact that the bull run this year had gone too far and that good value was becoming very difficult to spot. The latest setback is merely an overdue correction waiting for an excuse to happen. I still have part of my ISA entitlement for this year to invest and was despairing of finding an opportunity. Shares have become worth buying again.


Spare Us the Truth
The truth always hurts more than lies. The IMF has declared that the rescue of Greece was more about saving the euro than about saving the Greek economy. Whoever thought it was otherwise?
This speaking of the unthinkable has naturally provoked outrage in Brussels because it comes uncomfortably close to the truth. There are many criticisms that can be launched against the European Union, and I have mentioned quite a few in this column over the years, but you cannot fault the EU on its determination to defend its dreams.
That is one reason why I remain reasonably optimistic that, in the short to medium term, there is little likelihood of the eurozone falling apart with the disruption that would inevitably cause.


Testing Times
News that AstraZeneca (AZN) is shelving a treatment for rheumatoid arthritis following disappointing trial results is a warning of the dangers of investing in pharmaceutical companies. Look at the share price table and you will see little evidence of decent yields in the sector, while price/earnings ratios are generally alarmingly high.
It is true that an ageing population should increase the demand for drugs but there are many hurdles for drugs to overcome before they are accepted and, at the other end of their lives, the most successful ones come under attack from generic copies.
Astra shares had almost reached an all-time high above £33 before falling back this week. The surprise to me is that the reaction was so mild, presumably because projected sales of the drug were less than 1% of forecast sales so the blow is not seen as too heavy.
Even so, I feel that Astra is overvalued. Sales and profits fell last year and are projected to continue on a downward path this year and possibly next. It is more lowly rated than GlaxoSmithKline (GSK), a key component of my portfolio, and rightly so. Glaxo has moved into consumer healthcare as a backstop in case its drug development programme falters. Astra has no such fallback.

See the original article >>

Quantitative Cocktails

by Marketanthropology

Picking up where we left off last week - here's another look at the latest "Quantitive Cocktail" to explode.

"It's safe to say that both silver and the Nikkei were THE risk cocktails for each periods pronounced gains; whereas, the markets monetary handlers had brought participants noses back to the trough to feed (through a perceived weakened currency) - then gallop, in the asset meadows that would most benefit its yield."

Click to enlarge image

Click to enlarge image                                                Click to enlarge image

As was the case in 2011 with silver and the commodity led risk drive, the impetus for these pronounced periods of boom and bust were largely psychologically driven phenomenons, motivated by what initially was perceived as radical central bank interventions. Should the rally in the Nikkei meet the same fate as silver, the weakness in the targeted currency will prove to be ephemeral as well as its primary benefactors.

See the original article >>

U.S. Treasury Bond Market Sell Signal

By: Brian_Bloom

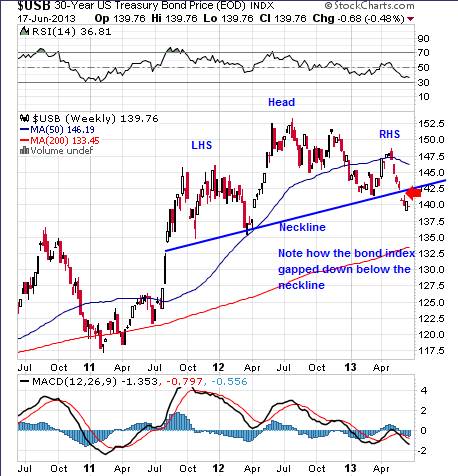
On reflection, the two weekly charts below should have been included in the equity market overview that I sent out yesterday (http://www.beyondneanderthal.com/equity-market-risks-are-rising-3/ ).

A significant “sell” signal has been given on the weekly bond price chart.

Theory says that the index should consolidate before heading down in earnest. Minimum target move is 152.5 - 137.5 = 15 points. Minimum target destination is 142.5 + 15 = 127.5 – which is where the index first gapped up in August 2012.

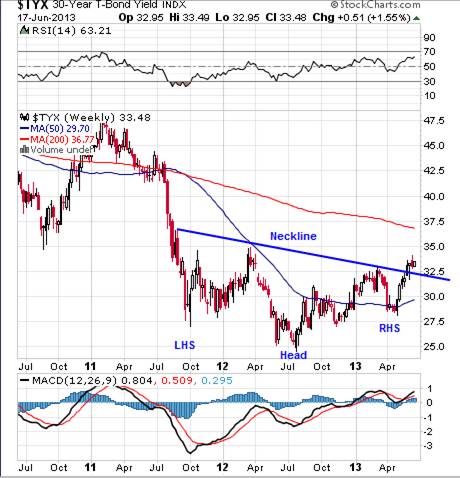
Looking specifically at the yield chart below, we see a mirror image, but without the gaps:

Target move is 34.5 - 25 = 9.5

Target destination is 32.5 + 9.5 = 42 (4.2%)

Note that a move to 4.2% will take the yield above its 200 week moving average.

Conclusion: The market is calling and end to the Fed’s game playing in respect of yields. Regardless of what Mr Bernanke may be saying, fundamental factors are now beginning to prevail. We can expect a 15/142.5 = >10% fall in the long bond price, which will translate to significant capital losses in the long bond market. In principle, the direction of bond prices in general is likely be down and capital shortages will be the likely result as lenders become risk averse. For various reasons the general rise in cost of capital will weigh heavily on the equity markets.

BB Comment: There are those who will argue that a rise in yields will evidence a coming era of price inflation and that, therefore, we can expect this inflation will drive equity and gold prices “up”. Yesterday’s equity market overview was intended to emphasise the dependence of corporations on rising sales volumes to drive rising profits on a sustainable basis. At this point in history, if corporations raise prices faster than they raise wages, then consumers will have less disposable income to afford to buy the goods and services that drive the economy. Therefore, if corporations raise prices they will likely experience falling sales volumes and the economy as a whole will contract. We are too early in the Kondrat’eff up-cycle for emerging technologies to drive “green shoot” revenues. The debt bubble needs to deflate as a condition precedent to future economic stability. Alternatively, a replacement “artificial” economic driver needs to be introduced. The last time that happened was in the 1930s, leading up to World War II. Time will tell whether humanity has evolved beyond reaching for the Neanderthal option of beating your enemy over the head with a club to get what you want. The evidence suggests not, but the optimists live in hope. They point to the tsunami of emerging technologies that has been building. They point to the Gross National Happiness Index in Bhutan and hope that it is the first emerging sign of a possible shift in human values. (See: http://www.grossnationalhappiness.com/ and http://www.grossnationalhappiness.com/wp-content/uploads/2012/04/Short-GNH-Index-edited.pdf )

See the original article >>

Too tough of a nut to crack for the Fed?

by Chris Kimble

CLICK ON CHART TO ENLARGE

Two of the U.S. broadest index's (NYSE Composite & Wilshire 5000) are both facing a series of resistance lines that so far stopped them on a dime towards the end of May. Could the confluence of resistance lines at this time become important since they took place in May (Sell in May and go away)?

The Fed is to announce its thoughts on QE to infinity & beyond tomorrow, can the action they take push these key index's past resistance? A breakout above these lines would be a positive for sure.

Is this resistance "too tough of a nut to crack right now?" Stay tuned, these are important levels for Ben and the Fed to break!

See the original article >>

U.S. to buy domestic sugar to ease glut after prices plunged

By Marvin G. Perez and Alan Bjerga

The U.S. Department of Agriculture plans to spend about $38 million to buy domestic sugar in a bid to ease a glut that sent prices plunging this month to a four- year low.

The surplus will be reduced by 300,000 short tons (272,155 metric tons) as the government buys sugar and then gives it to U.S. refiners in exchange for credits normally used to import cheaper raw sugar from overseas, the USDA said today in an e- mailed statement. The refined sugar would then be exported, the agency said.

Record production from cane and beet growers, who are supported by government restrictions on imported sugar, and duty-free supplies from Mexico left the biggest inventories in more than a decade and sent domestic prices tumbling 34% in the year ended June 14. The drop in value threatened to force growers to forfeit $110 million to $320 million of sugar to the USDA to avoid defaults on government loans.

“Most traders believe that there would’ve been some defaults in the fourth quarter without pre-emptive action from the USDA,” James Cassidy, head of the sugar trading desk at Newedge Group in New York, said in a telephone interview. “This won’t be enough to remove all excess supply, but it’s a start.”

Domestic-sugar futures for September delivery rose 2.4% to 19.35 cents a pound on June 14 on ICE Futures U.S. in New York. Prices reached 18.85 cents on June 11, the lowest for a most-active contract since March 2009. Raw sugar for October delivery, reflecting world prices, rallied 3.4% to 17.09 cents a pound on June 14. The contract was up 0.5% at 1:36 p.m.

Cheaper Alternative

“Today’s notice is estimated to cost approximately two- thirds less than not taking action to prevent forfeitures” on crop loans, Brian K. Mabry, a USDA spokesman, said in an e-mail. “USDA will continue to monitor market responses and determine if additional action is necessary.”

The U.S. limits sugar imports and sets prices for about 5,000 growers, raising consumer costs by $3.5 billion a year, according to an Iowa State University study. Because it helps farmers by setting artificially higher prices rather than with direct payments, government spending is minimal.

While sugar is the only major agricultural commodity grown in the U.S. in which the government actively manages imports, Mexican product can access the country without restrictions under the Nafta free trade agreement. Mexico’s production will be a record in the year ending Sept. 30, the USDA estimates.

Sugar Loans

Under the U.S. sugar program, processors can take out loans from the government, pledging the sweetener as collateral. Borrowers are guaranteed a minimum of 20.9 cents a pound for unrefined sugar. If it drops below that level, processors who get the credits can repay their debt by selling the sugar to the USDA by the end of the market year, which coincides with the fiscal year ending Sept. 30. Default notices could come as early as Aug. 1.

While “this might provide some relief to the domestic sugar glut, the market has been anticipating something like this for some time,” Sterling Smith, a futures specialist at Citigroup Inc. in Chicago, said in a telephone interview. “It’s already baked in the cake.”

Production in the 12 months that end Sept. 30 will jump 6.2% to a record 9.015 million tons, the USDA said in a June 12 report. Global production will exceed demand for a third year in row in the 12 months started Oct. 1, according to the London- based International Sugar Organization.

See the original article >>

Just how high above $100 will oil go?

By Gary Kamen

An interesting question from yesterday’s Father’s Day BBQ from non-traders.

First, last week’s price action on August 2013 Crude Oil opened the week at $96.36 and closed the week at $98.07, with the biggest moves coming Thursday and Friday. The media spin on the $1.97 move up was the unrest in the Middle East, more specifically the Syrian crisis. Now, last time I looked Syria is not a huge oil producing country, but the media said the unrest there could cause a problem for shipments. Exactly how much crude oil does the United States receive from the Middle East? See the 2013 graph below. I think you can see if we angered Canada that that would be a much more serious crude issue.

NOTE: Keep an eye on the U.S. dollar — as it drops crude will rise.

COT Data

Of course on the weekly chart we see how “big” money is posturing. From the COT-Disaggregated Swap Dealers (now the sell side of crude) increase their net shorts from -277,940 contracts to -290,115 contracts. Managed Money increased net longs from 199,735 contracts to 215,957 contracts and Producers (the past sell side) dropped their net longs from 30,522 contracts to 22,249 contracts. If Producers once again become net short and add to these, that will help push the price of crude oil up. And at the same time, if Swap Dealers continue adding to net shorts, there is a very good chance we see the break over $100 and retest $110, which we have not seen crude trading at since February 2012. OPEC seems to like the price of crude oil at $90-$100. That is clearly reflected in the price action since the beginning of 2013.

If you need help understanding how to understand how to use the NEW COT report to your benefit get instant access to my new e-book "What Lies Beneath ALL Trends". It is filled with eye opening information.Commercial Net Tracker instructions: This form tracks the Commitment of Traders (COT) data for the commodity futures market. This form "looks" at the most recent five weeks of COT data and provides visual indications of the data. A) If the current value is at a 12-month low, the cell will display a red/burgundy background. B) If the current value is at a 12-month high, the cell will display a green background. C) If the current value went from net negative to net positive, the cell will display a blue background (indicating a bullish condition). D) If the current value is both a 12-month high and also went from a net negative to a net positive, the background will be green. You should view the data with green backgrounds to determine if they also went from net negative to net positive.

Technicals

On the daily chart below, you can see ADX at 23.6 and rising, reflecting strength developing to what is still a weak trend. We see Stochastics now in deep overbought territory, which does have this trader a bit concerned, and MACD is bullish with increasing divergence from above the signal line. I will be watching DI Differential very closely now.

Click to enlarge.

On the weekly chart we see ADX at 23.7 and rising telling me the weak trend is starting to show signs of strengthening. Weekly Stochastics are in deep overbought territory like on the daily chart. On the weekly chart you can see the price action has not closed below the 20-period EMA (94.35).

Have a prosperous trading week.

See the original article >>

Follow Us