Tuesday, June 18, 2013

Markets seek reassurance from Fed over stimulus

By John Caiazzo

Overview and Observation;

"Grasping at straws." Investors spent market session hours searching frantically for a reason to buy or sell equities, Treasury bonds, currencies and other dollar and interest rate based criteria on which to develop a trade. Technicians got "whipsawed" as they had to quickly maneuver to expand their projected "range" and determine where their "stops" should be. The "program" of "buy high, sell low, or sell low then buy back high" apparently did not work well for account valuations. Without definitive direction by the U.S. Federal Reserve, frequent "comments" by some of the Fed area Presidents move markets and until which time as Fed Chairman Bernanke makes that "definitive" statement on his economic projection and subsequent rate decision we will continue to experience wide price swings. Now for some actual information to help my readers "navigate" through the "jungle" of news and reports…

Interest Rates:

September 30-Year Treasury bonds closed at 140 07/32nds up 16/32nds on Friday as the money made the "trip" from equities back to the "safe haven" of Treasuries. The University of Michigan/Thomson Reuters index showed a decline to 82.7 from the May 84.5. Once again analyst expectations were incorrect as they projected a reading of 84.7. That, as well as the flat May U.S. industrial production lent concern about the so called "economic recovery" and prompted the selloff in equities and the rally in Treasuries with the corresponding decline in yields. The U.S. Federal Open market Committee scheduled for June 18 and 19 should emphasize a "calming effect" but with the expected reduction in the bond buying program could produce additional market activity. Fed Chairman Bernanke is expected to indicate that any reduction in bond buying would not necessarily mean the Fed is ending the quantitative easing program. We expect the weak U.S. economy to impact yields and produce further price gains in bonds. Hold those calls we recommended recently and add on any further price decline.

Stock Indexes:

The Dow Jones industrial average closed at 14,070.18, down 105.90 down 0.7% and for the week lost 1.16% even against the triple digit gain on Thursday. The S&P 500 closed at 1,626.73, down 9.63 or 0.59% and for the week lost 1.01%. The tech heavy Nasdaq closed at 3,423.56, down 21.81 and for the week lost 1.32%. The Thursday rally was prompted by the better than expected first time unemployment number but at over 330,000 still remains a problem. Once again the concept of a "jobless recovery" is a fallacy in my opinion since an unemployed "consumer does not consume." The producers of those "unconsumed products" will be next to lay off workers. As I have been stating for some time, any reduction in the first time unemployment number is not a sign of recovery, but merely an indication that companies have no more employees to lay off without "shutting their doors." I would not take solace in any reduction in the weekly number on that basis. I reiterate, implement hedging strategies for holders of large equity positions. The use of futures and options can provide some protection against what I see as a 2008 type decline. Don’t get "caught again."

Currencies:

The September U.S. Dollar Index basket of currencies closed at 8082.5, down 13.7 points tied to the weaker than expected University of Michigan/Thomson Reuters index of 82.7 against expectation of 84.5. The dollar lost 3.4% against the Japanese yen for the week as the yen recovered from its weakness over prior sessions. The Bank of Japan’s massive stimulus program provided some recovery for the dollar but the yen still managed a gain of 53 points to close at 0.10601. Other currencies posted gains with the euro 4 points to $1.3356, the Swiss franc 2 points to $1.0861, the British pound 10 points to $1.5697, and the Canadian dollar 11 points to .9809. The Australian dollar closed at .9528c down 13 points. We have been in favor of the dollar and continue to feel that relative to its trading partners, the U.S. will fare better. Stay with the dollar

Energies:

July crude oil closed at $97.85 per barrel, up $1.16 tied to Middle East tensions with the U.S. As far as crude prices, we may see further price gains tied to geopolitical events but our overall view remains unchanged that supplies are adequate, and demand is declining. Stay with the puts but do not add for now.

Copper:

July copper finally staged an "anemic" correction of 1.3c per pound on Friday closing at $3.1980. Copper remains under pressure from adequate supplies at warehouses and the recent decline in demand by China. We have been bearish on copper for some time and have suggested taking some profits off the table from short positions. Hold put positions for now.

Precious Metals:

August gold closed at $1,387.60, up $9.80 for a gain of 0.92% and a weekly gain of a mere 0.3%. The short-covering in front of the weekend after recent heaving long liquidation from the December 2012 $1,700 level was feeble and not a sign of "recovery." The "collapse" mid-April from $1,570 to $1,390 in two sessions appeared to be a "washout" of weak longs but indicative of a bear market. We have been on the sidelines in metals for some time and while some "bargain hunting" can be expected, any rally should provide for an opportunity to move, with us, to the sidelines. July silver closed at $22.00 per ounce, up 41.70c following the gold bounce and remains our favorite if investors must have a precious metal in their portfolio. Otherwise I see no reason to expect a major recovery for metals at this time. July platinum closed at $1,450, down $2.10 while September palladium gained 95c to close at $732.00. Our long time preference of palladium over platinum remains unchanged.

Grains and Oilseeds: July corn closed at $6.54 ¼ per bushel, up 10 3/4c on short-covering after recent weakness tied to an expected record U.S. crop. We prefer the sidelines. July wheat closed at $6.81 per bushel, down 4 1/2c tied to hedging pressure but with the storms in the growing areas, I would not want to be short wheat even though I see no definitive export demand and increased production from Russia. Stay out for now. July soybeans closed at $15.16 per bushel, up 5 3/4c on continued reports of farmers withholding supplies from the market and weather providing ideal growing conditions. We have preferred soybeans in this group but with no new fundamentals we are on the sidelines for now.

Coffee, Cocoa and Sugar:

July coffee closed at $1.2215 per pound, down 1.55c on continued speculative selling and tied also to the weak Brazilian Real. Large supplies from producers such as Vietnam as well as good growing condition in Colombia and Central America should continue to pressure prices. We are on the sidelines. July cocoa closed at $2,240 per tonne, down $68 on long liquidation and a lack of fresh fundamentals from West Africa. Weak demand also a factor as a global recession is evident. We favor the sidelines here as well. July sugar closed at 16.75c per pound, up 51 points on short-covering but remains mired at the lows. We are on the sidelines here as well.

Cotton:

July cotton closed at 90.21c per pound, down 1.51c on profit-taking after recent sharp gains from early June lows around 79c. Poor weather in the Delta and Southeast have impacted production and reduced estimates. We think cotton may have further gains but would take some profits off the table here.

See the original article >>

End of easing spurs S&P 500 gains of 16% as economy expands

By Whitney Kisling

More than $500 billion wiped off the value of U.S. stocks is providing opportunities for investors who remember that equities tend to rise when the Federal Reserve begins reducing efforts to stimulate the economy.

The Standard & Poor’s 500 Index, which has fallen 2.5% from its May 21 record, rallied an average 16% over two years the last four times the central bank started raising interest rates, according to data compiled by Bloomberg. While the 87% gain since December 2008 is the biggest following Fed reductions, the advance hasn’t pushed valuations above historical averages.

Bears say this time is different amid mounting pressure on the government to reduce spending and on the central bank to cut bond purchases that pump funds into the financial system even as the economy expands at the slowest rate following a recession since World War II. Bulls say a decision by the Fed to reduce stimulus would be proof the economy can expand on its own and that valuations are low enough to spur more share gains.

“The Fed tightening, that’s good for stocks,” John Canally, investment strategist at Boston-based LPL Financial Corp., which has $373 billion in advisory and brokerage assets, said in a June 12 phone interview. “You have to remember why they’re doing this, because they think the economy is in a self-sustaining phase, which ultimately is good for profits, which is good for stocks.”

Weekly Decline

Stocks fell for the third time in four weeks, with the S&P 500 losing 1% to 1,626.73, after Chinese industrial production rose less than forecast and investors awaited a meeting of the Federal Open Market Committee starting tomorrow. The retreat cut 2013’s gain to 14% and the increase since shares bottomed in March 2009 to 140%. The S&P 500 rose 0.9% to 1,641.02 at 9:40 a.m. New York time today.

Swings in prices have jumped since May 22, when Fed Chairman Ben S. Bernanke suggested the central bank could begin to reduce, or taper, its $85 billion in monthly mortgage bond and Treasuries purchases. The potential for a change in policy has increased the conflict between bulls and bears who say the stock market has been artificially inflated by the Fed.

The value of all American equities has contracted to $19.3 trillion from $19.8 trillion at the peak, according to data compiled by Bloomberg. Capitalization of shares on global markets is $55 trillion, down from $58 trillion four weeks ago.

Utility Yields

The S&P 500’s decline since reaching a record has been led by utilities, whose dividend yields lured fewer investors as Treasury 10-year rates climbed above 2%. Oneok Inc., the Tulsa, Oklahoma-based power provider, lost 10% and FirstEnergy Corp. in Akron, Ohio, slid 13% since May 21.

Equities usually gain when the Fed reverses course and starts to make money more expensive, signaling the economy is strong enough for policy makers to place inflation-fighting above growth concerns.

U.S. gross domestic product has expanded an average of 3.8% in years when the Fed began tightening, compared with an annual rate of 2.8% since 1971, according to data compiled by Bloomberg. Profits will jump more than 10% in each of the next two years after almost doubling since 2008, more than 11,000 analyst estimates show.

The S&P 500 gained 10% over two years starting in 1983 and 7.4% in 1987 after the Fed reverses policy. It jumped 35% between February 1994 and February 1996 and 11% two years after the Fed started raising rates in June 2004, according to data compiled by Bloomberg.

Stock Prices

Bears say history is no guide now because stock prices already rallied too much, given the state of the U.S. economy. The S&P 500’s 87% advance since the rate on overnight loans between banks was pushed to zero in December 2008 is more than five times the average advance in periods following monetary easing, data compiled by Bloomberg show.

Stock market volatility has been higher this year than during past periods when the Fed reversed policy. Daily moves for the S&P 500 have averaged 0.68% since March, compared with 0.48% for the first quarter, according to data compiled by Bloomberg. In the month before the Fed tightened in 1994 and 2004, daily price changes averaged 0.44%.

The S&P 500 plunged 1.4% on May 31 as better-than- forecast data on business activity and consumer confidence led to concern the Fed would pare its stimulus measures. The index gained 1.3%, the most in about seven weeks, on June 7 after the Labor Department said American employers added 175,000 jobs in May, exceeding economists’ forecasts.

‘What If’

“People are playing the what-if game on whether the Fed will taper,” Dan Veru, chief investment officer at Palisade Capital Management LLC, said in a June 12 phone interview. The Fort Lee, New Jersey-based firm manages $4.2 billion. “That’s why the market’s been so choppy. When investors don’t know what’s going on, they get out of all risk assets until they understand what’s happening.”

The employment report showed the automatic across-the-board federal spending cuts, or sequestration, that began in March are having an impact on government payrolls. Jobs created by the whole economy, including federal agencies, averaged 155,300 the last three months, compared with 170,500 from 2002 to 2007 and 1990 to 2000, data compiled by Bloomberg show.

Sequestration Risk

“I think what we’re realizing is sequestration is going to last a little bit throughout the year, it wasn’t all concentrated in April, May,” Adam Parker, chief U.S. equity strategist at Morgan Stanley, said in a June 4 Bloomberg Television interview. “That’s probably a risk to the downside in the second half.”

Removing Fed stimulus at the same time the government is cutting spending will hurt stocks, according to Bruce McCain, who helps oversee more than $20 billion as chief investment strategist at the private-banking unit of KeyCorp in Cleveland. The U.S. budget deficit widened in May to about $138.7 billion from a year earlier on a 10% increase in spending, according to Treasury Department figures June 12.

“If the Fed cuts back what they’re buying more rapidly than the deficit declines, then they would effectively be drawing liquidity out of the markets and that would weigh on prices,” he said in a June 13 phone interview. “If we are as extended as we have been, as they begin to withdraw their stimulus that would lead to perhaps a fairly nasty correction.”

Mutual Funds

Even with the advance, mutual-fund customers have retained their preference for fixed income, sending $18.3 billion to bond managers in May and withdrawing $5.4 billion from U.S. stock funds, data from the Investment Company Institute show.

“If you want to see the impact of tapering you only have to look back to the last couple of weeks,” Lawrence Creatura, a Rochester, New York-based fund manager at Federated Investors Inc., which oversees about $380 billion, said in a June 13 phone interview.

More than $11 trillion has been added to American share values over the last four years as Bernanke held interest rates near zero and carried out three rounds of bond purchases to stimulate growth, a program known as quantitative easing. The S&P 500’s advance since March 2009 is bigger than in every developed country except for Denmark.

Even with the rally, earnings have risen so much that valuations remain below historical averages. Stocks trade at about 15.9 times reported operating earnings, compared with the mean of 16 in data going back to 1954. The S&P 500 traded at about 10.5 times annual earnings when it reached a 12-year low in March 2009.

on twitterShare on facebookShare on emailShare on printMore Sharing Services0

More than $500 billion wiped off the value of U.S. stocks is providing opportunities for investors who remember that equities tend to rise when the Federal Reserve begins reducing efforts to stimulate the economy.

The Standard & Poor’s 500 Index, which has fallen 2.5% from its May 21 record, rallied an average 16% over two years the last four times the central bank started raising interest rates, according to data compiled by Bloomberg. While the 87% gain since December 2008 is the biggest following Fed reductions, the advance hasn’t pushed valuations above historical averages.

Bears say this time is different amid mounting pressure on the government to reduce spending and on the central bank to cut bond purchases that pump funds into the financial system even as the economy expands at the slowest rate following a recession since World War II. Bulls say a decision by the Fed to reduce stimulus would be proof the economy can expand on its own and that valuations are low enough to spur more share gains.

“The Fed tightening, that’s good for stocks,” John Canally, investment strategist at Boston-based LPL Financial Corp., which has $373 billion in advisory and brokerage assets, said in a June 12 phone interview. “You have to remember why they’re doing this, because they think the economy is in a self-sustaining phase, which ultimately is good for profits, which is good for stocks.”

Weekly Decline

Stocks fell for the third time in four weeks, with the S&P 500 losing 1% to 1,626.73, after Chinese industrial production rose less than forecast and investors awaited a meeting of the Federal Open Market Committee starting tomorrow. The retreat cut 2013’s gain to 14% and the increase since shares bottomed in March 2009 to 140%. The S&P 500 rose 0.9% to 1,641.02 at 9:40 a.m. New York time today.

Swings in prices have jumped since May 22, when Fed Chairman Ben S. Bernanke suggested the central bank could begin to reduce, or taper, its $85 billion in monthly mortgage bond and Treasuries purchases. The potential for a change in policy has increased the conflict between bulls and bears who say the stock market has been artificially inflated by the Fed.

The value of all American equities has contracted to $19.3 trillion from $19.8 trillion at the peak, according to data compiled by Bloomberg. Capitalization of shares on global markets is $55 trillion, down from $58 trillion four weeks ago.

Utility Yields

The S&P 500’s decline since reaching a record has been led by utilities, whose dividend yields lured fewer investors as Treasury 10-year rates climbed above 2%. Oneok Inc., the Tulsa, Oklahoma-based power provider, lost 10% and FirstEnergy Corp. in Akron, Ohio, slid 13% since May 21.

Equities usually gain when the Fed reverses course and starts to make money more expensive, signaling the economy is strong enough for policy makers to place inflation-fighting above growth concerns.

U.S. gross domestic product has expanded an average of 3.8% in years when the Fed began tightening, compared with an annual rate of 2.8% since 1971, according to data compiled by Bloomberg. Profits will jump more than 10% in each of the next two years after almost doubling since 2008, more than 11,000 analyst estimates show.

The S&P 500 gained 10% over two years starting in 1983 and 7.4% in 1987 after the Fed reverses policy. It jumped 35% between February 1994 and February 1996 and 11% two years after the Fed started raising rates in June 2004, according to data compiled by Bloomberg.

Stock Prices

Bears say history is no guide now because stock prices already rallied too much, given the state of the U.S. economy. The S&P 500’s 87% advance since the rate on overnight loans between banks was pushed to zero in December 2008 is more than five times the average advance in periods following monetary easing, data compiled by Bloomberg show.

Stock market volatility has been higher this year than during past periods when the Fed reversed policy. Daily moves for the S&P 500 have averaged 0.68% since March, compared with 0.48% for the first quarter, according to data compiled by Bloomberg. In the month before the Fed tightened in 1994 and 2004, daily price changes averaged 0.44%.

The S&P 500 plunged 1.4% on May 31 as better-than- forecast data on business activity and consumer confidence led to concern the Fed would pare its stimulus measures. The index gained 1.3%, the most in about seven weeks, on June 7 after the Labor Department said American employers added 175,000 jobs in May, exceeding economists’ forecasts.

‘What If’

“People are playing the what-if game on whether the Fed will taper,” Dan Veru, chief investment officer at Palisade Capital Management LLC, said in a June 12 phone interview. The Fort Lee, New Jersey-based firm manages $4.2 billion. “That’s why the market’s been so choppy. When investors don’t know what’s going on, they get out of all risk assets until they understand what’s happening.”

The employment report showed the automatic across-the-board federal spending cuts, or sequestration, that began in March are having an impact on government payrolls. Jobs created by the whole economy, including federal agencies, averaged 155,300 the last three months, compared with 170,500 from 2002 to 2007 and 1990 to 2000, data compiled by Bloomberg show.

Sequestration Risk

“I think what we’re realizing is sequestration is going to last a little bit throughout the year, it wasn’t all concentrated in April, May,” Adam Parker, chief U.S. equity strategist at Morgan Stanley, said in a June 4 Bloomberg Television interview. “That’s probably a risk to the downside in the second half.”

Removing Fed stimulus at the same time the government is cutting spending will hurt stocks, according to Bruce McCain, who helps oversee more than $20 billion as chief investment strategist at the private-banking unit of KeyCorp in Cleveland. The U.S. budget deficit widened in May to about $138.7 billion from a year earlier on a 10% increase in spending, according to Treasury Department figures June 12.

“If the Fed cuts back what they’re buying more rapidly than the deficit declines, then they would effectively be drawing liquidity out of the markets and that would weigh on prices,” he said in a June 13 phone interview. “If we are as extended as we have been, as they begin to withdraw their stimulus that would lead to perhaps a fairly nasty correction.”

Mutual Funds

Even with the advance, mutual-fund customers have retained their preference for fixed income, sending $18.3 billion to bond managers in May and withdrawing $5.4 billion from U.S. stock funds, data from the Investment Company Institute show.

“If you want to see the impact of tapering you only have to look back to the last couple of weeks,” Lawrence Creatura, a Rochester, New York-based fund manager at Federated Investors Inc., which oversees about $380 billion, said in a June 13 phone interview.

More than $11 trillion has been added to American share values over the last four years as Bernanke held interest rates near zero and carried out three rounds of bond purchases to stimulate growth, a program known as quantitative easing. The S&P 500’s advance since March 2009 is bigger than in every developed country except for Denmark.

Even with the rally, earnings have risen so much that valuations remain below historical averages. Stocks trade at about 15.9 times reported operating earnings, compared with the mean of 16 in data going back to 1954. The S&P 500 traded at about 10.5 times annual earnings when it reached a 12-year low in March 2009.

‘Significantly Oversold’

“Although the market has significantly appreciated, it was significantly oversold heading into that rally,” Eric Teal, chief investment officer at First Citizens BancShares Inc., which manages $5 billion in Raleigh, North Carolina, said in a June 13 phone interview. “Corporate earnings have really been the drivers of higher stock prices up to this point, and if we anticipate economic growth then the market can continue to do well.”

Utilities, which have dividend payouts about twice as high as the S&P 500, slumped 5.8% since May 21 as rates on 10- year U.S. notes rose as high as 2.29% on June 11. Oneok, which yields 3%, plunged 10% since May 21. The stock trades at 35 times reported earnings. FirstEnergy, a nuclear power plant owner, has a dividend yield of 5.7% and is down 13% since Bernanke’s comments to Congress.

Phone Companies

Phone stocks, which also pay high dividends, are the most expensive industry in the S&P 500. Windstream Corp., the landline telecommunications company that has the highest dividend yield of the S&P 500, has lost 5.5% since May 21. The Little Rock, Arkansas-based company is 33% more expensive than the S&P 500, with a price-earnings ratio of 21.1, according to data compiled by Bloomberg.

Stocks whose earnings are most tied to economic growth have led gains this quarter, with financial shares up 7.1%, a sign investors are betting on more growth and consumer spending. Morgan Stanley, in New York, advanced 18%, while Fifth Third Bancorp., Ohio’s largest lender, rallied 12%.

Economists are more optimistic about the economy in the next two years, with the median forecast at 2.7% for 2014 and 3% for 2015. GDP has expanded an average of 2.1% a quarter since the recession ended in June 2009, less than half the average in recoveries since 1945, according to data compiled by the Commerce Department and Bloomberg.

“The Fed is clearly going to wait and gauge the sustainability of the economic recovery,” Teal said. “And the improving economic growth signs outweigh the monetary tightening impact. That will likely be the case this time.”

See the original article >>

The Real Story of the Cyprus Debt Crisis (Part 2)

by Charles Hugh Smith

Not only is the bail-in a direct theft of depositors' money, the entire bailout of Cyprus is essentially a wholesale theft of national assets.


Here is Part 2 of our comprehensive account of the banking/debt crisis in Cyprus.As noted yesterday, the debt crisis in Cyprus and the subsequent "bail-in" confiscation of bank depositors' money matter for two reasons:

1. The banking/debt crisis in Cyprus shares many characteristics with other banking/debt crises.

2. The official Eurozone resolution of the crisis may provide a template for future resolutions of other banking/debt crises.

It also matters for another reason: not only is the bail-in a direct theft of depositors' money, the entire bailout is essentially a wholesale theft of national assets. This is the inevitable result of political Elites swearing allegiance to the European Monetary Union.

History, geography and economy of Cyprus (Wikipedia)

I am honored to present Part 2 of Cyprus resident John H. Morgan's report.


The Cyprus Bank Deposit Bail-in
On 16 March 2013, the noose was tightened around Cyprus. Emergency Liquidity Assistance (ELA) was cut off. Banks remained closed while the Government negotiated with the Eurogroup of European finance ministers to save the Cyprus banking system. President Anastasiades announced the first proposal to the nation: he would tax all bank deposits in Cyprus to fund the recapitalisation of Laiki Bank. This plan was rejected by the Cypriot Parliament as it infringed the guarantee on all insured deposits up to €100,000. The Minister of Finance visited Russia to ask for financial assistance, to no avail.
On 25 March 2013, as Greece celebrated Independence Day, it was announced that Laiki Bank would be wound up and Bank of Cyprus would be restructured. All Cypriot depositors in Laiki Bank and Bank of Cyprus who held more than €100,000 would be forced to pay for Cypriot bank losses and withdrawals, mostly sustained in Greece (the so-called “bail-in” of depositors). Bank of Cyprus would be responsible for paying back Emergency Liquidity Assistance provided by the European Central Bank to Laiki Bank. It would also assume liability for all Laiki insured deposits up to €100,000.
The value of uninsured deposits over €100,000 held by Cypriot Banks came to €38bn (billion) out of a total €68bn in deposits. The governor of the Central Bank of Cyprus stated that 70% of all uninsured deposits were held by foreigners. There are an estimated 60 000 British citizens, 30,000 Russian citizens and 10,000 other European nationals living in Cyprus. Together with Cypriot-domiciled foreign firms (such as German shipping companies), they had deposited €30bn in Cypriot banks.
Cypriot Banks were closed for 10 days to prevent a bank-run. Their overseas branches stayed open to preserve a semblance of normality and avoid triggering a bank-run on Greek banks. Cash was rapidly withdrawn from the British, Greek and Russian branches of the Cypriot banks. The value of the assets held by the Greek branches of the Cypriot Banks was €23bn. These assets received huge haircuts as they were traded for €9.2bn of Emergency Liquidity Assistance (ELA). The ELA was provided by the European Central Bank to replace money withdrawn from Cypriot Banks via their Greek branches. To prevent further losses in Greece, the Central Bank of Cyprus was ordered to sell the Greek operations of the Cyprus Banks in a fire-sale.
Piraeus Bank of Athens paid €524m (million) for the remaining Greek assets of Laiki Bank, BoC and Hellenic Bank. The purchase was funded by the European Central Banks’ European Financial Stability Fund (EFSF), using Piraeus shares as collateral. The boards of Laiki Bank and BoC resigned immediately as they had been kept out of negotiations. The governor of the Central Bank of Cyprus confirmed that the deal was stitched together by the Cypriot and Greek governments and the Eurogroup of finance ministers. Piraeus Bank of Athens was even awarded a €3.1bn write-back on the purchase price for buying impaired assets. It recorded its first profit in years.
This massive mark-down of assets owned by Cypriot bank shareholders and bondholders (worth 75% of Cyprus’ annual GDP), was hushed up. Once again, Cyprus banks had been forced to make crippling sacrifices to support Greece’s ailing economy. Within weeks of the deal, the CEO of Piraeus Bank of Athens was in Cyprus touting for business.
In a radical departure from accepted practice, two major groups of creditors, financial institutions and government agencies, were exempted from the bail-in haircuts. This meant that Central Banks were refunded their liabilities ahead of uninsured depositors. The ECB would get 100% of its €9.2bn ELA and the Bundesbank would get 100% of its €7bn TARGET2 liability.
These loans had been given to Cypriot Banks to replace the cash withdrawn when depositors moved their money elsewhere, especially to Germany. Technically, ELA is no different from a bank bailout, apart from costing 4% interest compared to 2.5%. The TARGET2 component of the Eurosystem shifts Euros back to European banks whose deposits have been depleted by interstate transfers, in effect giving them a loan.
Under the Troika deal, the liquidity provided by the European Central Bank and Bundesbank would be refunded first. Uninsured depositors would receive worthless bank shares to replace the cash and assets confiscated to cover Central Bank liabilities. It would have caused massive scandal in the EU if Cyprus commercial banks defaulted on the liquidity assistance provided by European Central Banks. Politically, it was much easier to raid the uninsured deposits of Cyprus account-holders after accusing them of money-laundering.
This ruthless action by the Eurogroup reassured taxpayers of Germany, Finland, Netherlands and Austria, who saw Northern economies carrying ever-increasing risks of default by Southern European banks and governments. Currency controls were put in place to staunch the movement of capital out of Cyprus. Nevertheless, billions of Euros are leaving Cyprus on a monthly basis.
As a reward for its compliance with the conditions set by the Troika of lenders, the government of Cyprus was granted a soft loan of €10bn by the European Stability Mechanism and IMF. €4.1bn was made available to roll over Cyprus external sovereign debt; €3.4bn was given to President Anastasiades to spend on governance; €2.5bn could be used to re-capitalize Cyprus’ smaller banks, Hellenic Bank and the Co-op Bank.
The Cyprus government must start repaying the loan and interest back after 10 years. The interest bill will exceed €3bn. This will be enough time to fund loan repayments from offshore gas revenues, expected to be earned from 2018 onwards.
External bond-holders of Cypriot Government debt will be repaid 100% of their investment, courtesy of Cypriot taxpayers. This vindicates the promise made by EU Economic and Monetary Affairs Commissioner Olli Rehn of Finland. In a January 2013 interview with Handelsblatt daily, Rehn reassured financial markets that there would be no haircuts on Cyprus Government Bonds.
However, President of the European Central Bank, Mario Draghi, announced in May 2013 that Cyprus banks may use Cyprus Government Junk Bonds “guaranteed by the Cyprus Government, with the agreed haircuts” as collateral for ECB funding.
This means that uninsured depositors will pay off much of the Cyprus Government debt as the value of Cyprus Government Bonds has been written down. The ECB has agreed to accept lower quality Asset-Backed Securities as collateral. Uninsured depositors will lose yet more of their funds in order to pay out the billions of Euros of insured deposits that are being painstakingly withdrawn within the constraints of capital controls.
Slowly, brick by brick, the last remaining wealth of Cyprus is being wrung from its soil and auctioned off. Central banks are extracting every ounce of gold from an island that was once renowned for its copper in Roman times.
*********************************************************

Economic Effects of the Cyprus Bank Deposit Bail-in

Cypriot businesses have seen their working capital plundered. The country is increasingly reverting to a cash-economy with a consequent dive in tax revenues. Provident funds, including those of bank-employees, have been severely impaired.
Most companies have cut wages, leading to severe distress among families who are paying off housing loans. This is intended to achieve the Troika’s goal of “internal devaluation”. By cutting labour costs, it is hoped to make Cyprus as competitive as countries like Germany.
Cyprus Airways is undergoing restructuring. Half of its staff have been retrenched. €20m in severance pay will be paid out of future airline revenues as the European Commission has barred the state from subsidising a commercial airline. The three Lufthansa consultants in charge of the restructuring are set to receive €1.3m. The remaining staff will suffer a 25% salary cut.
Even charities have not been spared a deposit haircut. Soup-kitchens for the legions of unemployed rely on constant donations of food from the public. The Cyprus Olympic Committee has lost €600,000 from the bail-in.
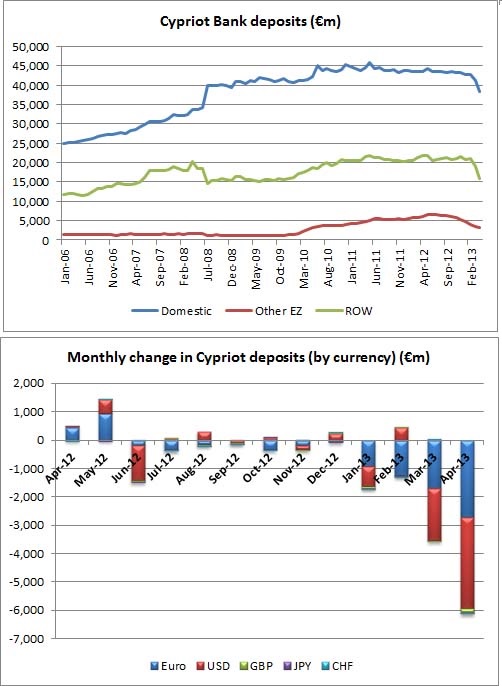
In an act that beggars belief, the Cypriot Parliament has levied a 30% tax on the interest earned from bank deposits. This has made Cypriot banks totally uncompetitive and deposits are tapering off. Money is being deposited offshore and ELA requirements of the Bank of Cyprus are increasing. The Central Bank of Cyprus announced that €6.34bn or 9.96% of deposits were withdrawn from domestic banks in April 2013. Deposits had dropped by €14.23bn or 19.87% since April 2012. (This fall, in one year, is equivalent to 80% of Cyprus’ annual GDP.)

In another measure which defies logic, a property tax was insisted on by the Troika of international lenders. The government aims to extract maximum tax revenue by inflating property prices by the annual rate of consumer price inflation since 1980. Currently, property prices are at an all-time low. This tax will further depress the property market and withdraw large amounts of liquidity from the battered economy.
The reasons are not hard to fathom. A week after the Memorandum of Understanding was signed with the country’s lenders, President Anastasiades apologised to State employee unions that he had been forced to cut their salaries and pensions. He assured them that there would be no further cuts. The Minister of Finance assured government employees that their benefits would be maintained by reducing state expenditure on infrastructure. The opening of a new medical faculty at the University of Cyprus, costing €100m, would be funded, as it formed part of an election pledge.
Between January and May 2013, unemployment in the Cyprus private sector increased from 52,000 (11.8%) to 71,000 (16.1%), the steepest increase in the European Union. The EU has warned that Cyprus runs the greatest risk of social upheaval of all European countries.
*********************************************************

Economic and Political Prospects for Cyprus post-2013

Unable to devalue its currency to remain competitive, unable to print money to buy its citizens’ assets and stimulate its moribund economy, the Republic of Cyprus has come to realise that membership of the Eurozone is a poisoned chalice. The island has been cast adrift from Europe and left to sink or swim.
NATO continues to frame the geopolitical agenda of the Eastern Mediterranean, as it did when Turkey was allowed to invade the island in July 1974. In May 2013, two months after the Cypriot government had ceded control of its economy to the Troika of international lenders, Prime Minister Erdogan of Turkey listed 5 demands to President Barack Obama of the USA. One of those demands was that none of the estimated €200 billion of Cyprus offshore oil and gas reserves be sold to Russia. A week later, the Secretary General of NATO, Anders Fogh Rasmussen, warned the leaders of Cyprus that the island must settle the Cyprus Problem before it drills for oil and gas.
There is no need to bribe NATO member Turkey with trillions of cubic feet of hydrocarbons from the Levantine Basin to facilitate settlement of the Cyprus Problem. Turkey can use its military superiority to seize the island and its gas reserves. Despite reassuring noises that America will defend American energy companies drilling for hydrocarbons off the Cyprus coast, it is likely America would support its strategic ally Turkey, rather than side with insignificant Cyprus. In a display of solidarity, NATO allies in Europe have moved Patriot missiles to Turkey’s border with Syria.
Europe and Turkey are about to sign the aptly named “European Readmission Treaty” whereby Turkey has agreed to become a dumping ground for illegal migrants who have entered the EU through Turkey from countries to its east. This goes a long way towards reassuring German and French voters that the European Empire is spreading eastwards, rather than the Ottoman Empire spreading westwards.
During 2013, in a sign of Europe’s softening stance on Turkey, the European Court of Justice accorded Turkish Law primacy in settling all land restitution claims on the island of Cyprus.
Greek and Turkish speaking Cypriots have been promised a €200 billion bonanza from the discovery of hydrocarbons off the Cyprus coast. The use of most of the gas revenues to bankroll multinational energy conglomerates and to offset State “borrowings” will go largely unnoticed: a drop in the vast ocean of political corruption.
copyright 2013 by John Henry Morgan; all global rights reserved in all media

John Morgan is the director of a company based in Larnaca, Cyprus. He owns property in Cyprus and has lived there since 2004. He comes from the United Kingdom. He has also worked in Europe, Africa and the Middle East.
*********************************************************

The 2013 Cyprus Deposit Bail-in: POSTSCRIPT

"I run a Cypriot marine & diving company operating in the UAE in the Middle East. We have had €400,000 (a 90% retention) frozen by the Bank of Cyprus which was all the money we had to finish mobilizing for the final stage of a project. We desperately need that money to finish our mobilization and complete the project. We must finish the project in order to receive payment for all the work we have already done. We are now without funds in an Arab country that imprisons debtors and we have debts. We can't pay the salaries and wages of our people, and soon won't have enough money to feed them. We stand to lose our marine and equipment assets if we can't pay our debts. We are in very serious trouble and all the pleading and demands that at least some of our funds are released are ignored. We are desperate. We are the only company in this sort of trouble according to the Cypriot Ambassador. There is no protection for foreign nationals in this country. We need our money, we need help. Can you help us please by investigating or publishing our story?"Christopher M Penny
Bank of Cyprus starts process of turning uninsured deposits into stocks
Dubai Business Directory Listing for COMBINED DIVING & INSPECTION SERVICES

See the original article >>

Risk On or Just Baby Steps to the Sleeping Bear’s Cave

by Greg Harmon

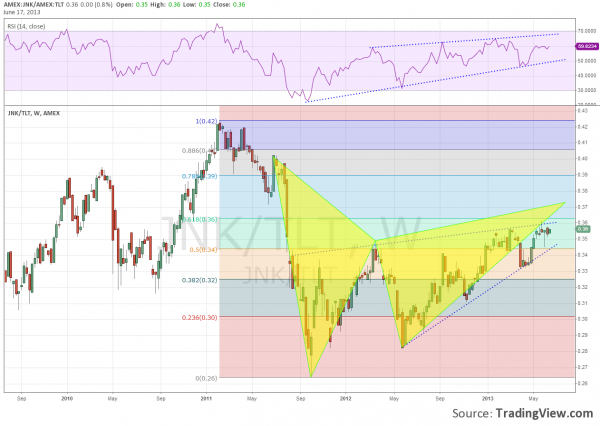
One measure of the direction of risk in the market place used by technicians is the ratio of high yield debt to Treasury debt ($JNK vs $TLT). The chart below shows how this dropped precipitously in 2011 and after a bounce through early 2012 has been moving steadily higher over the last year. And the Relative Strength Index (RSI) is rising in support of more upside. The ratio is approaching a triple whammy now though that could stop it in its tracks. First it is near the top

jnk-spy

of the rising wedge at about 0.36. Second it is nearing the 61.8% Fibonacci retracement of the major move lower. Third it is near the Potential Reversal Zone (PRZ) of the bearish Gartley just over 0.37. How the ratio reacts here could set the course for the broad market. A break above all three converts the Gartley to a Crab with a PRZ all the way up at 0.49. That could be interpreted as very bullish. A failure though and move back below the wedge at about 0.345 establishes a target on the wedge breakdown to about 0.27, or all the way back to the lows of 2011. Like creeping to the entrance to the bear’s cave before turning and fleeing.

See the original article >>

Condition data raise doubts over US wheat revival

by Agrimoney.com

The revival in expectations for the US wheat harvest stalled after winter crops were shown to be deteriorating in many major states, while delays to spring sowings stoked ideas of abandoned acres.

The US Department of Agriculture kept at 31% its estimate of the domestic winter wheat crop rated in "good" or "excellent" health as of Sunday, with the proportion in "poor" or "very poor" condition rising one point to 43%.

While the Michigan soft red winter wheat crop showed a sharp improvement in condition, the hard red winter wheat crops in Colorado - where USDA scouts noted that "conditions have been consistently dry", and that 9% of sowings have been left for pasture - deteriorated by three points to 10% rated good or excellent.

Oklahoma hard red winter wheat dropped by one point in the top two condition categories too, with the crop in Kansas, the top wheat-producing state, remaining stable.

'Truly amazing'

The lack of improvement surprised investors who have marked down wheat prices this month in part on reports of better-than-expected US crops, besides the pressure from harvest, which in ramping up supplies tends to weigh on prices.

In fact, the winter wheat harvest, at 11% complete, was well behind the average pace of 25% by now too, thanks to delays to crop development from a cold spring, but also some rain setbacks even where crop is ripe.

In Kansas, where 21% of wheat is normally already in the barn, farmers are expected to begin harvesting in earnest "within the next three-to-five days", USDA scouts said.

Anecdotal reports so far have been of better-than-expected harvest results.

Oklahoma State University, for instance, reported that yields at its test site in Chattanooga ranged from 12-36 bushels per acre, a result university small grains specialist Jeff Edwards termed "truly amazing" given "the presence of severe drought and three major freezes".

'Surprise disappointment'

Indeed, the USDA last week raised by 23m bushels to 2.08bn bushels its estimate for the domestic harvest saying that "higher yield [estimates] boost forecast production of hard red winter wheat in the southern and central Plains and soft red winter wheat across the South and Midwest".

However, while that upgrade weighed on wheat prices, the overnight crop progress data sparked some recovery, seeing Chicago wheat for July regain 0.9% to $6.86 ½ a bushel as of 06:00 local time (12:00 UK time).

Paris wheat for November, which hit a 13-month low of E195.00 a tonne on Monday, recovered ground to E197.50 a tonne, while the London November contract bounced 1.8% from a 10-month low to hit £168.00 a tonne.

At Phillip Futures, Joyce Liu said that the overnight wheat data were "a surprise disappointment because crop weather has improved substantially since March and the most recent June Wasde report showed higher forecast of winter wheat production".

A UK trader told Agrimoney.com: "It is early days for anyone to be drawing conclusions from the US wheat harvest yet.

"People should not make too much of a few positive results, even if they are from a credible source, which they are often not."

'Many acres won't get planted'

The wheat market gained further underpinning from US data on spring wheat plantings showing that rain-beset US farmers had 8% of their crop yet to plant as of Sunday, compared to a typical 3%, with the ideal seeding window passed

"Many acres won't get planted because of the persistent moisture received the past few weeks," said USDA scouts in North Dakota, the top US spring wheat-growing state, where 86% of crop was sown as of Sunday, 10 points behind the usual pace.

Brian Henry at Minneapolis-based broker Benson Quinn Commodities, said: "I'd be surprised to see much additional progress."

However, the disappointment in area was in part offset by a sharp improvement in the condition of spring wheat, of which 68% was rated in good or excellent health, up six points on the week, if still behind the 76% a year before.

The Minneapolis spring wheat market, where the benchmark September contract was up 0.6% at $7.86 a bushel, is also receiving some pressure from better planting conditions in Canada, a major spring wheat grower.

Indeed, with better harvest prospects, Canadian producers are proving "willing to sell old crop supplies", Mr Henry noted.

See the original article >>

Corn prices 'may correct significantly down'

by Agrimoney.com

Societe Generale, while upbeat on cotton price prospects, warned of a "significant correction" ahead for corn futures, and lower soybean values too, thanks to competition from South American supplies.

The bank, which last week downgraded longer-term price forecast for corn and soybean futures, rated both crops among its top short-term, underweight bets among commodities as well, with copper, gold and silver.

The premium of well over $2 a bushel that old crop July soybean futures are trading at in Chicago, compared with the new crop December lot, seems "excessive", the bank said, given the growing competition from South American supplies.

"The record South American soybean crop is already beginning to displace demand from the US and should continue to be available into September," when the southern US harvest begins.

"So the need to pay a premium for immediate delivery should therefore lessen," Societe Generale said, in comments which contrast with those on Monday from Morgan Stanley.

'Correct significantly down'

However, Societe Generale saved its biggest caution for corn, in which it warned that futures "could correct significantly down" thanks in part to the newly-started harvest of Brazil's so-called safrinha crop, which is planted, typically in January and February, on land vacated by the soybean harvest.

"Brazil's second, or safrinha, corn crop is harvested over the June-August period, which should reduce foreign demand for US corn during this period as most of the safrinha crop is available for export," the bank said.

The bank also cautioned that investors, in keeping Chicago's September corn contract at a premium of some $0.40 a bushel to the December lot, appear to have overestimated the impact of slow US plantings in delaying the harvest this autumn.

The US harvest, which generally begins in August in the South, "is unlikely to be delayed by more than a few weeks… nearly a month before the expiry of the September contract", the bank said.

"Thus part of the new, and large, crop should be available in September or in the weeks following it as the harvest progresses north, which means that the need to pay a premium for immediate delivery lessens."

'Moderately bullish'

However, the bank was more positive on prospects for soft commodity prices, forecasting that arabica coffee futures would find support from the entrance of Colombia into a "smaller harvest period", while raw sugar futures will win backing as Brazilian mills use cane to make ethanol instead of the sweetener.

And it rated cotton as one of its top overweight bets in commodities, along with aluminium, Brent crude, natural gas and nickel, flagging the boosts from Chinese imports and concerns over the impact of on the US crop of "severe drought" in Texas, the top producing state.

US Department of Agriculture data overnight showed just 28% of Texas cotton crops rated in "good" or "excellent" condition, down two points week on week, and below the 31% rated in "poor" or "very poor" health.

Societe Generale said: "We are moderately bullish on cotton, despite the recent rally," which saw New York prices soar 16.7% in the first two weeks of June, before retreating some 8% back to 86,.05 cents a pound in early deals in New York on Tuesday.

"The flat price will trend higher on Chinese demand and worries over crops in Texas.

"Chinese cotton imports remain seasonally strong, spurring ideas of stronger demand throughout the year."

See the original article >>

Follow Us