Friday, September 23, 2011

More Money for the IMF?

By Bob Davis

With the prospect growing that the International Monetary Fund may need to help bail out euro zone countries beyond Greece, the IMF may find itself short of money to handle those crises– and others that may arise elsewhere in the world.

The so-called BRICS countries — China. Russia, India, Brazil and South Africa — are weighing whether to lend the IMF additional funds to quell doubts that fund could get overwhelmed.

The question of whether “I can provide support and some liquidity to the IMF is on my mind,” said Yi Gang, deputy governor of China’s central bank, who is in charge of investing China’s $3.2 trillion in foreign reserves. Mr. Yi was speaking at IMF panel on Thursday during the IMF’s annual meeting

Later in the day, the BRICS issued a joint statement saying they recognize the need for new sources of financing as developed economies struggle.

During the first round of the global financial crisis, when the IMF looked like the IMF might not have enough money, Japan stepped up with a $100 billion loan. That eventually led to other nations reaching deeply into their pockets too. The additional funding helped sooth market apprehensions.
Japanese finance minister Jun Azumi said, in an interview, that japan was again ready to lend to the IMF, if necessary.

“If it becomes inevitable and necessary to provide additional funding then of course we will supportively think about it,” Mr. Azumi said.

The Unwelcome Impact of Interventionist Monetary Policy In The US


A fascinating insight from Graham Giller of Statistical Trader Blog, who analyzes over 55 years of Treasury data to point to what is the crux of the problems of monetary policy since Greenspan took over the Fed. The Greenspan [and Bernanke] era monetary policy has altered the distribution of changes in interest rates in a way that exchanges a reduction in day-to-day 'normal' variability for a considerably higher (perhaps catastrophically higher as we are finding out this week) likelihood of extreme shocks.


I first made the attached chart in 2004 after attending a lecture by Benoit Mandelbrot, and reading his "Fractals and Scaling in Finance." Mandelbrot's argument based on his early research (in the 60's) on financial price data was that the variance of speculative prices was undefined (i.e. infinite). This has profound implications for quantitative finance as a venture since the error on the mean is proportional to the square root of the variance, and for a distribution with an infinite variance the law of large numbers does not apply ---- i.e. you cannot make precise measurements of the mean as there is no convergence of the sample mean towards the population mean. Mandelbrot's research was done before ideas such as stochastic volatility were created, and in a modern context we do find evidence of stable variance.


However, one of the interesting aspects of his work was to pose the question: how does one measure an infinite statistical moment from a finite data sample, since that finite sample will always give a finite answer? Mandelbrot suggested in his early papers looking at the time series of the cumulative sample moments of the data --- i.e. to measure using all data up to some time and to plot that value as a function of each and every time. If the true parameters of the distribution of the data being measured are unbounded (infinite) then this plot will show no signs of convergence --- the measured datum will march steadily away from zero as each additional data point is added.


Mandelbrot's ideas also apply to higher moments: the sampling error of the variance is determined by the kurtosis (degree of "fat tails") and so on. My plot illustrates the cumulative kurtosis, computed after Mandelbrot, of the daily change in US three month treasury bills. Ever since the arrival of Alan Greenspan's post '87 crash crisis management regime, this plot shows a systematic and steady march upwards in the kurtosis of changes in US interest rates. I find this chilling. This means that, if the truth is as the evidence suggests, that it is not possible to accurately determine the risk of a portfolio of bonds because it is not possible to make reliable measurements of the variance of interest rates. i.e. The whole enterprise of bond portfolio risk management is intrinsically unreliable.


The data also tells another story. Also plotted is the cumulative standard deviation of daily changes in rates. This shows a systematic (but slow) decline in the measured value. This indicates that the true value is below the current value of the cumulative measure and that the cumulative measure is slowly decaying towards that value. So a narrative for what the Greenspan era monetary policy has done to the distribution of changes in rates is to exchange a decreased daily variability for a higher (perhaps catastrophically higher as we have found out) likelihood for extreme shocks.


As you can see the Bernanke era has done little to modify the general trend. In 2006 I sent the chart to Jim Grant together with my prediction that something nasty was lurking in the future. I decided to revisit the analysis today and find nothing has changed. Discussions of the long-term consequences of interventionist monetary policy are increasing (though still not in the mainstream) and this plot shows the fingerprints of such policy writ large.


It is this constant papering-over of the day-to-day cracks (and business cycle) that is supposedly so beneficial for our society (and central planners) as a whole that creates a building tension as the underlying causes grow larger and larger and are never purged until in one fell swoop, the market mechanism finds a way.

Occurred breakout in the flag pattern ....


Thursday, September 22, 2011

Bad news on my charts ..


The Fed Disappointed… The Great Collapse Is Here

by Graham Summers

I’ve been warning for weeks now that the Fed would disappoint with its September meeting. And boy did it.

As I forecast, the Fed didn’t announce QE 3. In fact, it didn’t announce any new policy of note. Instead it is simply reshuffling its holdings to focus more on the long end of the bond markets.

On top of this, the Fed announced it will only be moving roughly $400 billion of its portfolio around. This is the smallest major intervention the Fed has announced since it began implementing QE in 2009 (QE 1 was $1.25 trillion while QE 2 was $600 billion). Indeed, this move is on par with the Fed’s implementation of QE lite which to date has been about $300 billion give or take in scope.

Even more striking, while announcing this disappointing move, the Fed downgraded its view of the economy stating, “there are significant downside risks to the economic outlook.”

Previously, any admission of economic deterioration from the Fed resulted in the US Dollar selling off sharply as traders expected additional easing/ printing. This time around, the market senses that the Fed has disappointed and that the Fed’s move is largely symbolic more than anything else.

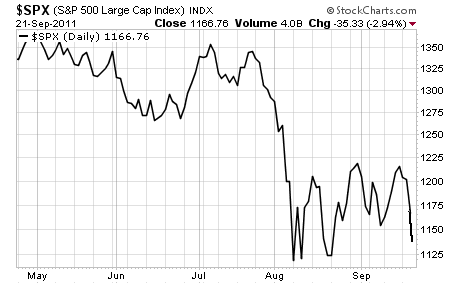
The end result of this: the market is Crashing just as I warned. The S&P 500 has gone from 1,200+ to 1,136, a 6% drop, in the overnight session.

We’re just getting started here. Today we got a confirmed SELL on my proprietary Crash indicator. This is the SAME indicator that registered before the 1987 Crash, the Tech Crash, and the 2008 collapse.

It’s just triggered again… which means that today’s sell off is JUST the beginning of what’s coming.

Yes, the GREAT COLLAPSE has begun. The markets will be going to new lows (below the March 2009 lows) in the coming months.

We’re also going to be seeing major banks go under, market crashes, food shortages, government shutdowns, and SYSTEMIC FAILURE.

Yes, I believe that before this mess ends, the financial system as a whole will have collapsed. What’s coming is going to make 2008 look like a joke.

Many people will lose everything in this mess. Yes, everything. The US is going to be defaulting on its debt, paper currencies around the world will fail. It’s going to be a dark dark time.

Wall Street Rejects Operation Twist

By Jeff Harding

The markets didn’t like the Fed’s announcement today. When the FOMC announcement hit the tape at about 2:21 p.m., the market nose-dived. I think they were expecting more, such as a lower FF rate, or some QE, or reducing interest paid on bank reserves. Alas.

Here is a chart of the S&P 500 today. You can see when the Fed announcement hit the tape:
From Bloomberg:
The S&P 500 Financials Index (S5FINL) fell to the lowest level since July 2009. Bank of America Corp. tumbled 7.5 percent after Moody’s Investors Service downgraded the bank’s long-term debt rating. Wells Fargo & Co. also had its long-term rating cut, wiping out an earlier gain and dragging the stock down 3.9 percent. Citigroup Inc. (C) fell 5.2 percent as Moody’s cut its short-term debt rating. Goldman Sachs Group Inc. closed below $100 for the first time since March 2009.
Costs to protect debt from Bank of America, Citigroup and Wells Fargo rose after the downgrades by Moody’s, which said U.S. support is less likely in an emergency. Credit-default swaps tied to Bank of America added about 40 basis points from yesterday to 375 basis points as of 3:41 p.m. in New York, according to broker Phoenix Partners Group. Swaps on Wells Fargo jumped to the highest since July 2009, climbing 17 basis points to 143 basis points, Phoenix prices show. Contracts on Citigroup rose 19 to 250, according to data provider CMA.
If you were holding long-term bonds, you did great:
This is Operation Twist in action where savers get hammered but speculators do great. At a 3% yield, a 30-year bond holder who is a saver looking for long-term security and yield is losing money daily with the official CPI at 3.6%. Congratulations Chairman Bernanke.

In case no one at the Fed thought about it, more cheap money won’t help the economy. It will help the government though as the cost of funds gets better and better for them. With a few more rounds of QE, then price inflation will make it even better as they pay down their debt with cheaper dollars. Meanwhile, massive amounts of capital are consumed by savers (i.e., destroyed).

Interest rates have been low since 2008 and yet the economy stagnates. Perhaps it isn’t the case that cheap money is what is needed today. If it was, you would think that three years of ZIRP would be a long enough trial period for this idea. So, why does the Fed persist with this failed policy?
Answer: Other than QE, they have no idea what to do since everything they have tried has failed. Next stop: QE3.

Follow Us