Friday, August 12, 2011

Beef-Demand Building Efforts To Increase

by TheCattleSite

US - Increases in support for beef demand-building efforts were approved by directors of the Federation Division of the National Cattlemen’s Beef Association (NCBA) at the organisation’s Board meeting held last week in conjunction with the 2011 Cattle Industry Summer Conference in Kissimmee, Florida.
Additional funding will go to programmes funded through the Beef Promotion Operating Committee (BPOC) and a special Federation Initiative Fund that channels money from states with large cattle populations to those with large consumer populations.

Federation directors voted to allocate $750,000 in expected surplus Federation funds to supplement the funding requests that will be considered by the BPOC in September. The BPOC determines national and international programmes for building beef demand. The funds are invested by state beef councils and are in addition to a $5.13 million initial FY2012 investment approved by the Federation Executive Committee and Federation directors.

According to David Dick, a beef producer from Sedalia, Missouri, and chairman of the NCBA Federation Division, the additional funds will be put to good use. “Matched with funds from the Cattlemen’s Beef Board (CBB), this money will support demand-building programmes that benefit US beef producers,” he said.

“It’s important that we put the money where it will do the most good.”

In that spirit the Federation also approved $198,300 in spending on demand-building projects through its Federation Initiative Fund. A total of $246,550 had been requested from the fund by 10 state beef councils in large consumer population states. The fund is made possible by state beef councils that have more cattle than people.

“Producers on state beef council boards across the country control half of the one dollar mandatory national beef checkoff they collect,” said Mr Dick. “While most of that money is used for in-state demand-building programmes, we’re also able to strengthen the national programme and get other funds where they’re needed badly.”

The NCBA Federation Division represents the 45 Qualified State Beef Councils, and elects 10 members to the 20-member BPOC. The other 10 are elected by the CBB. The BPOC determines which projects and programs will be funded through the 50 cents of each checkoff dollar sent to the CBB.

Other Actions

Also at the Summer Conference, Federation directors heard more about progress made through a Charter they approved at their meeting in Denver in February. The Charter establishes that the Federation is independent within NCBA.

Among the steps taken since February have been the hiring of a senior staff member whose sole responsibility is Federation activities, and the hiring of a compliance officer who helps assure that time and expense controls of Beef Checkoff funds are properly implemented.

“As a committed partner with CBB, we want to make sure that we have 100 per cent accountability,” said Mr Dick. “At the same time, we value the synergies that our association with NCBA provide.”

At the event’s Federation Forum state beef council representatives presented ways the Federation was involved with programmes taking place in their states. Staff from the Idaho Beef Council utilised Federation assistance in a state-initiated consumer promotion project, while the Nebraska Beef Council provided significant assistance in a nationally-developed Issues Management programme in Nebraska.

“State beef councils and their staffs are key to the Federation’s success,” said Mr Dick. “Not only do they financially support national Federation efforts, they directly participate in Checkoff-funded efforts taking place in their states. It’s a close relationship that works well.”

Let the Bulls Run!!


Let the Bulls Run!!! The USDA blows away the trade by estimating a 153 corn yield, and a 41.4 soybean yield. Total corn production is now estimated below 13 billion, and new crop soybean ending stocks fall to an extremely tight 155.

I have found at times it is often very tough to communicate thoughts or direct feelings into words on paper. Sometimes I may come across as being "bearish" when I am actually "bullish" longer-term. What I have been trying to communicate as of late might be better explained by painting a more vivid picture.

I want you to envision a group of fund traders all trying desperately to push a large rail-car up a steep mountain. The mountain represents "price." The higher prices climb the steeper the mountain becomes and the more difficult the rail-car is to move. At our current price level, I have to believe we are at least 3/4 of the way up the mountain, if not more. We have over 325,000 active participants (the funds) trying to push the rail-car as hard as they can up the mountain side. The grade of the mountain is getting steeper, and the rail-car seems to be getting heavier with each push. As we move the car higher up the mountain, "demand" seems to be providing less and less help.

We are however getting a nice boost from "yield," who as of late has actually helped us gain some additional ground. However, all around the mountain traders are watching other rail-cars fall off the tracks and flatten those that were pushing that particular rail-car (i.e. crude oil, stock market). What I am trying to say is that we need all the man-power we can muster just to push the rail-car up this last increasingly steep part of the mountain. If for some reason a few of our 325,000 plus "pushers" decided they have had enough (get scared) and walk away, we might actually loose some footing and at least temporarily, give back some ground. I have to believe once the rail-car is secured and comes to stop on solid footing, it will assure "pushers" that the rail-car is not going to tumble completely down the mountain. Once that plays out it wouldn't surprise me to see us end up with 400,000 or maybe even 500,000 plus "pushers" (fund traders) that take us right back towards the top of the price mountain. The magic question seems to be, "How far will we make it before the terrain simply becomes too steep?" I personally believe we have reached a level where footing could become an issue at any given moment. We desperately need all hands on deck, but with the "outside" markets in shambles, I am just not sure we will receive the extra man-power.

Remember, the re-survey was only for the Dakotas, Minnesota and Montana. We will not see what type of total damage was caused by the Missouri and Mississippi river flooding until early fall, nor will we know what type of total crop abandonment and acreage loss due to extreme drought like conditions has occurred either. These are certainly more "bullish" cards that have been loaded into the deck, along with the potential for extreme wind and hail damage, and thoughts of any type of early freeze. I have to believe the fear of these being dealt on to the table are still several weeks away, so we will need to sit patiently by and wait for some type of extended profit taking or setback to position ourselves for the next round of "bullish" cards.


Morning markets: mood of caution ensnares commodities rally

by Agrimoney.com

It pushed and it pushed, but couldn't quite get there. And ended up retreating.
The high for Chicago's best-traded corn lot, December, is $7.22 ¾ a bushel, set in June, the last time concerns over the thinness of US supplies of the grain peaked.
On Friday, it reached its highest since, $7.20 a bushel, but failed - in early deals at least - to lift the bar higher, despite the boost from Thursday's downgrade by US Department of Agriculture officials to their estimate for the domestic corn yield, and harvested area, this year.
Indeed, the theme of a more muted reaction than might have been expected to the data, and a bigger-than-forecast downgrade to the US soybean crop too, looked only more relevant on Friday.
All three of the Chicago major crops fell in early deals.
Crude eases
One downer was the performance of external markets, which failed to react quite as might have been expected given a bounce of more than 3% in the Dow Jones Industrial Average overnight, helped by data showing a 395,000 drop in the number of claimants of US unemployment benefits last week, to a four-month low.
Tokyo's Nikkei index closed 0.2% lower, while New York crude dipped 1.7% to $84.30 a barrel as of 07:25 GMT (08:25 UK time) amid concerns for what the dip in sentiment fostered by the recent market mayhem has done for demand.
Other reasons proffered for soft markets included the day of the week, with investors cautious in such volatile times ahead of the weekend break, and a ban by some eurozone countries - France, Spain, Belgium and Italy - on short-selling financial stocks, in an effort to protect their banks.
Such moves have a rich history of highlighting the severity of the situation rather than promoting calm.
Furthermore, the dollar made headway against a basket of currencies, by 0.3%, making dollar-denominated assets less affordable as exports. (However, China may be an exception, see below.)
'Outlook remains rangebound'
And in crop markets there was some caution too over taking too much of a lead from Thursday's USDA data with much of the season yet to go for spring-sown crops.
For soybeans, for instance, the "price outlook remains rangebound from $13.00-14.00 a bushel till more is known about US crop production in September or October", Kim Rugel at Benson Quinn Commodities said.
For wheat, many analysts voiced a positively downbeat stance, given that the USDA downgrade to hopes the US crop was more than offset by better prospects elsewhere, notably in the former Soviet Union.
"World wheat projections were bearish for prices," Luke Mathews at Commonwealth Bank of Australia said.
"The USDA lifted global production by some 10m tonnes this month and ending stocks were lifted by about 6m tonnes to a comfortable 189m tonnes."
At, Standard Chartered, Abah Ofon said: "We remain fundamentally bearish wheat into the end of the year, although wheat prices are likely to benefit from bullish sentiment in corn."
Yuan factor
As for overnight news, the China National Grain and Oils Information Centre lifted its estimate for China's corn harvest by 1m tonnes to 182.5m tonnes, potentially a negative for prices. (The USDA on Thursday pegged the figure at 178.0m tonnes).
However, the centre cut its forecast for the soybean harvest by 500,000 tonnes to 13.5m tonnes, below the USDA's 14.0m-tonne figure.
And, in what might be seen as an extra boost for crops – such as soybeans - of which China is an importer, the country again pegged the yuan higher, at 6.3972 yuan per $1, its sixth record high in 10 trading days.
"This accelerated appreciation [of the yuan], both against the dollar and on a trade-weighted basis, marks an important shift after a recent slowdown," StanChart said.
Prices fall
Nonetheless, Chicago soybeans for November fell 0.3% to $13.28 a bushel, while corn for December fell 0.2% back to $7.12 ½ a bushel.
Wheat for September fell 0.3% to $6.99 ½ a bushel.
To continue the contrarian theme, a notably good performer was cotton, which was served bearishly by Thursday's USDA data revisions, which put in a surprise upgrade to the US harvest, despite deep drought in Texas, America's top producing state.
Is cotton, of which China is like soybeans also the top importer, reacting better to yuan appreciation prospects?
New York's December lot added 0.8% to 97.25 cents a pound.


US corn woes to lift futures 'to record highs'

by Agrimoney.com

Corn prices are to challenge record highs set in June, boosted by the downgrade of the US crop which has left the world facing its tightest supplies of coarse grains on record.
The US Department of Agriculture's 556m-bushel downgrade on Thursday to its estimate of the American corn harvest this year made it "increasingly likely that Chicago corn prices could test" their June 10 record, when the spot contract hit $7.99 ¾ a bushel, Rabobank analysts said.
"Although farmers have clearly responded to record-high prices through increased corn plantings, the adverse weather is likely to extend the current elevated prices," the bank said.
The USDA, explaining its corn crop downgrade, said that "unusually high temperatures and below average precipitation during July across much of the Corn Belt sharply reduced yield prospects", with drought in the South raising expectations for abandoned crops.
'Critically tight'
At Commonwealth Bank of Australia, Luke Mathews said that "extremely tight" supplies of the grain highlighted by the revision meant corn futures "are likely to test, if not exceed, the June record high"
The cut to 714m bushels in the USDA estimate of domestic corn stocks at the close of 2011-12 "should continue to support near-record corn prices", he added.
Furthermore, with estimates for US barley and sorghum harvests also cut, the country's level of feed grains looked "critically tight", putting a squeeze on global supplies too.
The ratio of global carryout stocks of coarse grains, as a proportion of use, implied by the data was – at 12.8% - "the tightest on record".
Ethanol factor
Rabobank added that, while the USDA also cut estimates for domestic corn consumption and exports, as high prices ration demand, futures may have to go higher still to deter the bioethanol plants who consume nearly 40% of American production.
"[It] would require corn prices in excess of $7.50 a bushel to make ethanol production unprofitable at current ethanol prices," the bank said.
Chicago's December corn contract stood at $7.12 ¼ a bushel in early trade on Friday, down 0.3% on the day.
Ethanol for December delivery closed up 2.2% at $2.591 per gallon on Thursday.


Soybeans jump after 'blowtorch heat' wilts US crop

by Agrimoney.com


Soybean futures jumped in early deals after the US cut its production estimate by considerably more than the market had expected, signalling a squeeze on supplies which looks set to have global repercussions.
The US Department of Agriculture cut its estimate for the US soybean yield this year by 2.0 bushels per acre to 41.4 bushels per acre – a downgrade twice as big as analysts had expected.
Furthermore, it reduced its estimate for harvested acres by 500,000 acres to a four-year low of 73.8m acres, reflecting a trim to estimates for sowings, after a rain-hampered spring planting season, and damage caused by heat to crops in Texas and Oklahoma.
"The early wetness and then the blowtorch heat took a toll," broker US Commodities said.
'Rationing needs to occur'
The data implied a US crop of 3.06bn bushels (83.2m tonnes), nearly 130m bushels short of trade expectations, and signalling that prices would rise to slow demand accordingly.
USDA US soybean data, diff. from last, and from (market forecast)
Harvested area: 73.8m hectares, -0.5m acres
Yield: 41.4 bushels per acre, -2.0 bushels per acre, (-1.4 bushels per acre)
Production: 3.06bn bushels, -169m bushels, (-131m bushels)
Year-end stocks: 3.15bn bushels, -118m bushels
Estimates for 2011-12. Market estimates from ThomsonReuters
"Rationing needs to occur on soybeans," US Commodities said.
Farmers could expect to receive up to a record $14.50 a bushel for their soybeans in 2011-12, up $0.50 a bushel from the previous upper estimate, the USDA said.
In Chicago, soybeans for November, the best traded contract delivery soared more than 4% in early deals before easing to $13.34 ½ a bushel at 17:30 GMT, up 2.5% on the day.
'Going to affect China'
The USDA foresaw the reduction in supplies being felt in part by domestic crushers, who looked set for a second successive season of reduced activity in 2011-12.
Selected USDA soybean forecasts, change on last, and (year on year)
Brazilian production: 73.5m tonnes, +1.0m tonnes, (-2.6%)
Brazilian exports: 36.5m tonnes, +2.5m tonnes, (+22%)
Chinese production: 14.0m tonnes, -0.3m tonnes, (-7.3%)
World production: 257.5m tonnes, -4.0m tonnes, (-2.5%)
Year-end stocks to use ratio: 23.2%, (-0.4 percentage points), -3.8 percent points
Estimates for 2011-12
However, importers are to take a bigger hit, with the forecast for soybean exports from the US –the world's biggest shipper - downgraded by 95m bushels to 1.40bn bushels (38.1m tonnes).
Although prospects for exports from Brazil looked brighter, buyers, including top-ranked importer China, faced paying up for supplies, analysts said.
"It is going to affect China the most," Sal Gilbertie, head of Teucrium Trading, told Agrimoney.com.
"China has been importing quite a few soybeans again, to feed its growing hog herd and meet consumers' growing demand for protein."
Date on Wednesday showed China's soybean importers rising by nearly one-quarter in July, from June.
"China is going to feel the impact of the tighter soybean supplies."


See the original article >>


An Update on $VIX

by Doug Short

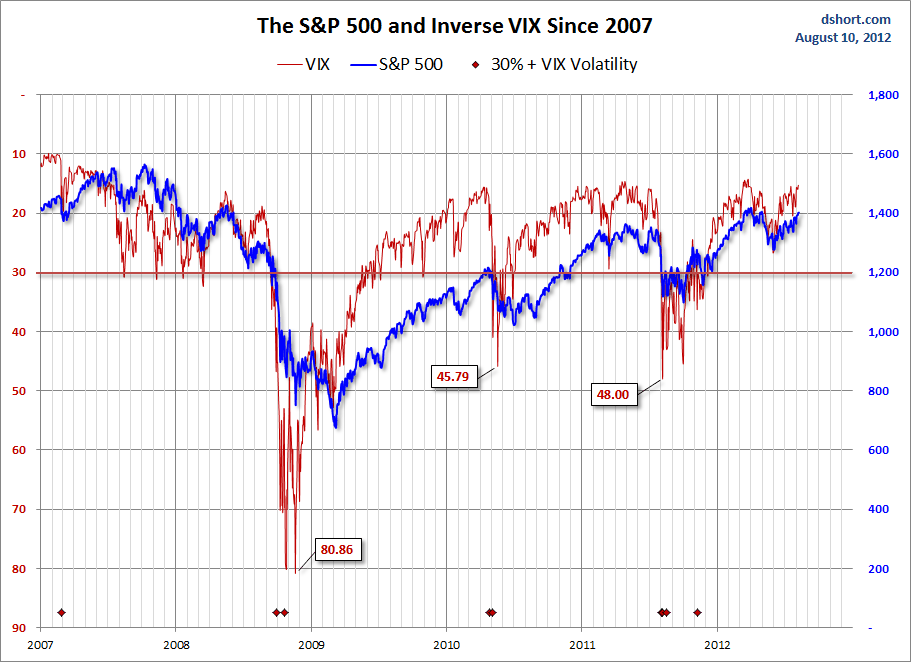
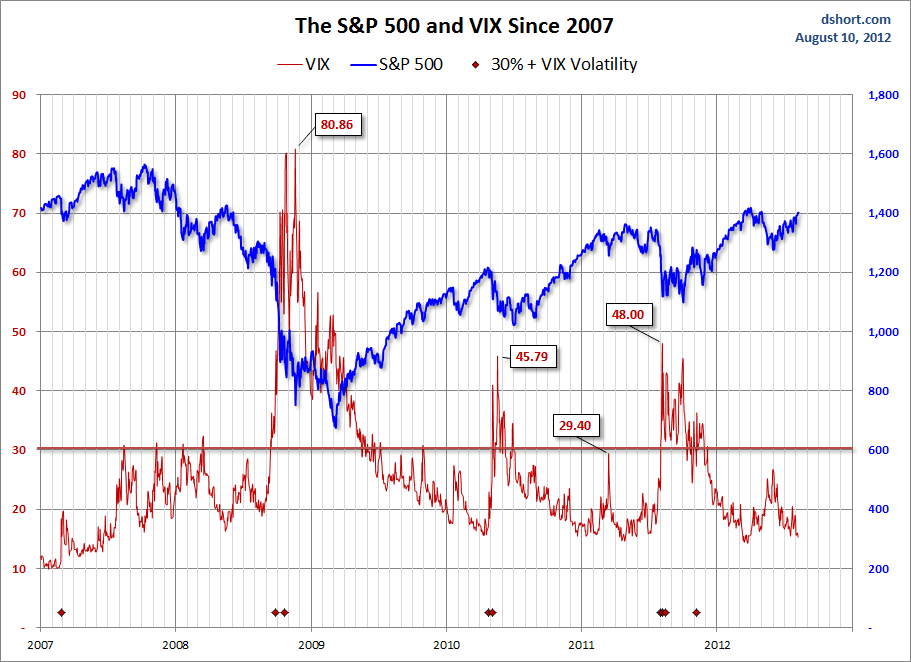
The first chart features an overlay of the S&P 500 index and the CBOE Volatility Index (VIX) since 2007. Yesterday the VIX rose to 48.00, a gain of 50% over the previous close.

Follow up:
Click to View


As the chart above illustrates, the correlation between the S&P 500 and the VIX is inverse but imperfectly so. The lower low in the summer of 2008, when the index nearly dipped to 1200, came with a lower VIX in the upper 20s. More significantly, the unprecedented surges in the VIX above 80 in late 2008 predated the actual index low by over three months.

A key to understanding the VIX is to realize that it can be far more volatile than the index to which it is attached. The next chart inverts the VIX values, which helps us see more clearly the greater degree volatility and the fact that the VIX tends to lead the S&P 500.

The spike in the VIX of late is a bit worrisome, especially because it has exceeded 30 level associated with high volatility. See also the markers at the bottom of both charts, which identify days on which the VIX spiked by more than 30%, something that's happened four times since the March 2009 low. In particular, we can see the increase in volatility associated with the 16% correction that began in April 2010 and ended in early July. The immediate question is whether the spike in volatility during the past few days, which included two 30% plus spikes, is a leading indicator of additional market decline.


For a look at the VIX and S&P 500 since 1990, click here for some additional illustrations.

Follow Us