Tuesday, June 7, 2011

Stock Market Bears Now In Total Control.....


You need to recognize a real change when it occurs. Hopefully, all of you can now realize that the market characteristics have changed from bullish to more bearish for the short-term. Once the bears were able to take out 1320/1315, or the critical trend line in play, it has been lights out for the bulls. It took three full attempts by the bears to get the job done, but they did it. They defended resistance over and over and kept pounding away at 1315/1320 and finally got the job done. To that you say it's about time, and it's good for this market. The bears have been bowing down to the bulls for quite some time now. Every time the bulls needed to make a move higher through resistance it seems they got the job done without too much trouble. Day after day and week after week this trend remained in place. The bears unable to put up a fight.

The pattern was clear. A bull market clearly in place. But then we saw a change in the pattern at the last top, which was the massive negative divergences on those index weekly charts. You put a 41.6% spread more bulls to bears and those combinations are where the top occurred. We've been slowly heading down the prior four weeks, and then last week, the fifth week in the down trend off the top, the selling accelerated. This is where we finally lost that trend line of support at 1315/1320. The bulls unable to come right back and take this level back. That's why you now see a real change of trend. What was once easy for the bulls to accomplish is no longer easy at all. Too much time now below 1315/1320, and thus, you should not expect the market to be able to come back any time soon. The down trend is now established short-term. We'll discover in time just how long we can expect it to last. The longer the better, but for now, the market has made a turn from up to down in the trend. Respect this reality.
What is still troubling from a sentiment point of view is how slow the move up in the bearish percent is. We've seen a decent drop in the bullish percent, but we have yet to see a real move higher in the number of bears. That is lagging, and as I reported a few times already, remains a sore spot for this market. We need to see the bears soar above the current 20.4% level. A move up towards 30% would be best for the bulls if they want this market to try and move up appreciably once again. 20.4% means more bulls are turning neutral and those who were neutral are staying that way. We need to see folks start to hate this market and get totally bearish. That would be the best thing for the bull market we're still in for now. As long as the bear number remains near 20% you can forget about another leg higher. Not going to happen. A few weeks below 1315/1320, I believe, will get the job done. Get those bears rocking and get that percent up to 30%. Still not enough bears is the bottom line. With last weeks bad market action I'd have to think we're getting a higher number this week. We'll find out Wednesday if the market action of last week ramped a more bearish mentality.

What led us in to this bear market is now leading once again after pausing for some weeks. Those horrific financial stocks are leading things lower again. Goldman Sachs (GS), JPMorgan Chase & Co. (JPM), Citigroup, Inc. (C) , Bank of America Corporation (BAC), American International Group, Inc. (AIG) , and the list goes on. They can not find a sustained bid. We even saw a downgrade today by a key financial analyst, something you rarely see since these stocks have lagged for such a long time. The financials were just terrible today and are now on a new breakdown. Almost oversold, for sure, but they're breaking down. Oversold at some point will offer no more than a counter trend bounce that won't last very long. The banks are full of bad loans and are being held up purely by the good graces of fed Bernanke. Without him we'd be seeing many defaults all over the place. It's not good in the bigger picture, it is why we're holding up for now. It's best to stay away from the weakest places in the stock market. Don't catch the falling knife. If you need to go long, about the last place you should be looking at are these financial stocks. They are in a bear market. No argument about that. That part of the stock market is in a bear and should be avoided at all costs.

There is support at the 150-day exponential moving average at 1283. We hit 1284 on the lows today. Short-term charts are oversold. Daily charts are a bit oversold. We could see a small rally over the next few days of a percent or two but don't expect the world to the upside. The market is in a clear down trend with the wall of resistance at 1320. The 20-day and 50-day exponential moving averages are only 3 and 4 points away from 1320 as well. Not good for the bulls. This market is screaming for bullish behavior to be pulled in. Do not get caught up in small moves higher over the coming days. Unless we blow through 1320, the overall trend is down and I don't think we're getting through 1320 any time soon on the S&P 500. Cash is a wonderful position for the time being.

Monday, June 6, 2011

U.S. Dollar and the 500 index going to correlate for a while again?

by Kimble Charting Solutions


See the original article >>

Corn Market Remains Tight, Volatile


Corn growers in the northern and eastern Corn Belt regions are currently struggling to decide whether to accept prevented planting payments, take a chance at planting corn in June or switch to another crop. Meanwhile, the corn market is trying to estimate just how much 2011 corn that U.S. farmers will both plant and harvest.

“Out of the 92.2 million acres that USDA projected would be planted to corn this spring, we’re probably down to a little less than 91 million acres that might actually be planted,” says Chad Hart, Iowa State University agricultural economist. “Even in normal conditions, we would have expected to harvest around 85 million acres, out of the 92.2 million projected acres planted. With plantings below 91 million acres, I expect harvested acres to be down at least a million acres, as well. That would put us in the 83- to 84-million-range for corn-harvested acreage.”

As a result, global corn stocks are likely to remain tight for another year or so, says Hart. “The U.S. produces 40% of the world’s corn, so if we’re behind in production, the world is behind, too,” he points out.

Corn isn’t the only feed and food product with tight supplies right now, adds Hart. U.S. wheat growers in the southern plains are currently coping with drought while growers in the northern plains are contending with cold, soggy soils. On the other side of the globe, China is having wheat production problems, as well.

“China’s feed grain situation is pretty tight,” says Hart. “Their food and feed wheat crops are struggling, and they are the world’s largest wheat producer. China is also second in corn production behind the U.S.”

Having tight global supplies of both wheat and corn at the same time generally favors higher-than-normal prices for both crops, says Hart. “U.S. corn farmers are in a good spot right now – there seems to be more upside potential than downside,” he adds.

Still, a surge in oil prices might be all it takes to tumble commodity grain prices, notes Hart. “Normally high energy prices help to boost corn prices,” he says. “However, if oil rose to $125/barrel, more than likely it would decrease corn prices, because our export demand would decrease significantly.”

USDA recently confirmed that China had purchased some U.S. corn in March. However, Hart says that it’s still anyone’s guess as to whether China will make any more U.S. corn purchases again this year or next.

Although it may be pricey, farmers might consider making some moves now to protect their price floor against a possible future price drop, without having to guarantee delivery, advises Hart. “When you see a market that is bouncing around like this corn market has for the last few months, it shows how volatile the market is,” he says. “High volatility in a market means a high cost for price protection.”

Market concerns are even higher over the remaining 2010 corn crop than the potential 2011 corn crop, notes Hart. As evidence, he cites the current cash corn market in the central Corn Belt.

“Right now (June 1), there is a 35-40¢ basis in cash prices over what nearby futures prices are offering for mid-September,” he says. “The bottom line is that the grain elevators and ethanol plants in central Iowa are recognizing that there might not be enough corn to be had come late August and early September.”

Given the late planting that has gone on this year, not many farmers will be able to take advantage of the attractive price premiums being offered for early September delivery, even if farmers planted early maturing varieties, notes Hart. “On the other hand, we’re still seeing nearby futures prices a good $2/bu. above what production costs are,” he says. “So, there’s likely going to be more opportunities for corn farmers to lock in a very profitable price, whether they deliver early or not.”

See the original article >>

Week in Review: The Power of Zero To Be Tested?

By Global Macro Monitor

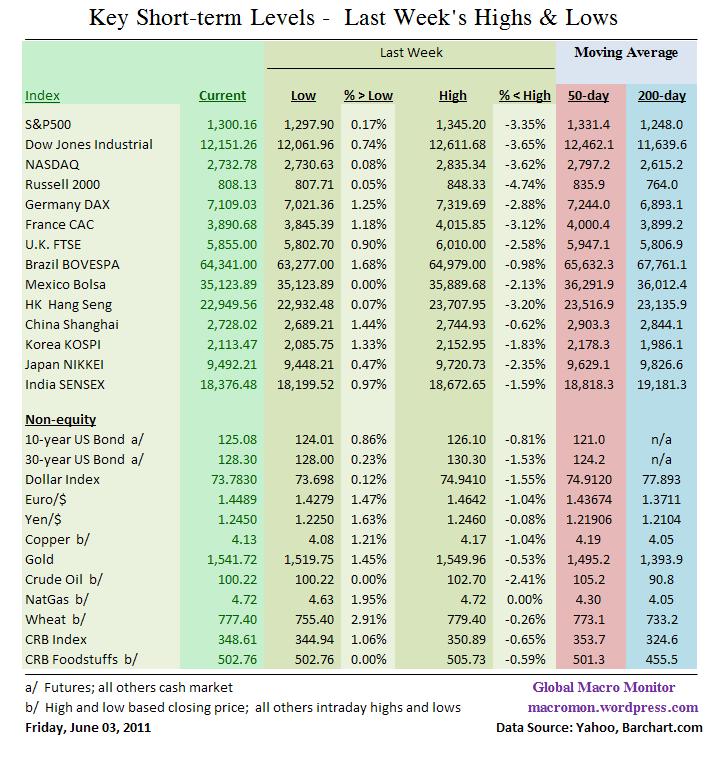
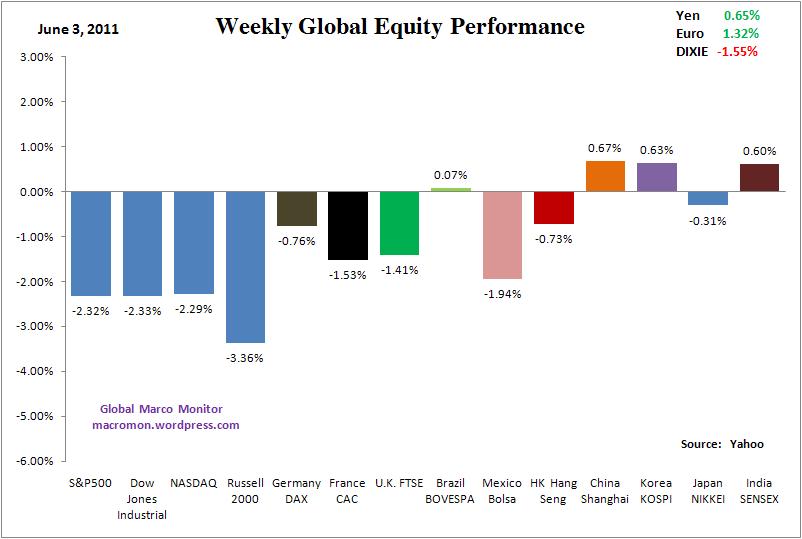
The S&P500 and Dow Jones Industrials suffered their worst weekly loss of the year, both down 2.3 percent. The U.S. and European equity indices had bearish outside moves and all major global equity indices we track closed the week below their 50-day moving averages. Asia fared better only due to the fact they closed before the release of Friday’s weak employment data. Investors and traders have definitely sold in May and gone away in the S&P500, Dow Jones, and all three European equity indices, which have had negative closes for five weeks in a row.

On the positive side, the Brazilian BOVESPA looks like it’s trying to put in a bottom and the Shanghai Composite was able to hold its January’s important closing low of 2677 after trading down to 2689 early in the week. We will be watching Asia closely at the open on Sunday night as their equity markets have a chance to react to Friday’s employment report.

Apple, the general of this bull market, closed up 1.79 percent on the week and could be a catalyst for a market bounce if Mr. Jobs surprises at the company’s worldwide developers conference this week. Many traders are short the stock going into the conference on the expectation nothing of significance will be announced. Shorting Apple? Ouch!

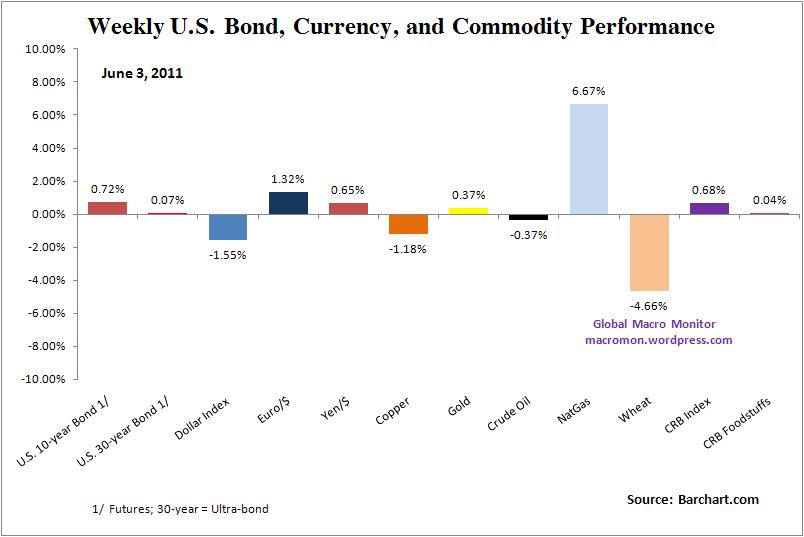
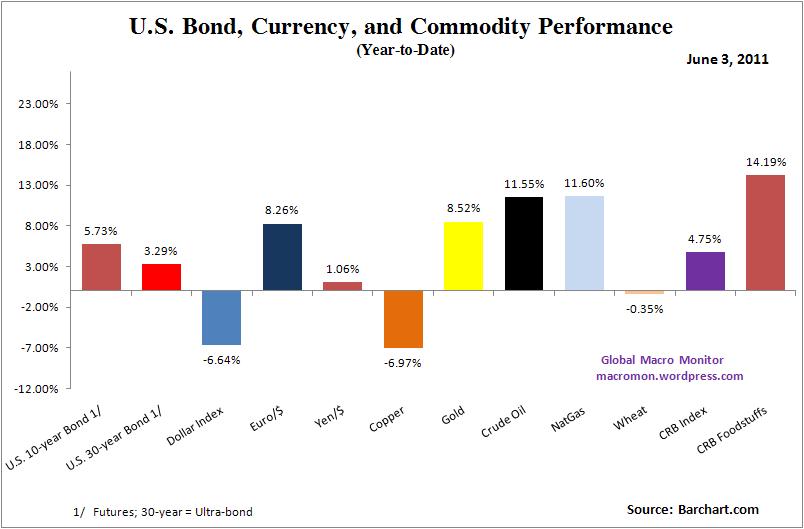
U.S. Treasury bonds closed stronger, but were unable to take out Wednesday’s highs even on the dismal employment data. The dollar closed down for the second straight week and we find it interesting that risk assets have been unable to rally on the weak dollar. Though it’s too early to tell, keep this on your radar as the weak dollar/risk on trade may be a changin’.

The power of zero (interest rates) as a risk-on market prop may be about to face its first serious test. The toxic brew, which would signal something more serious than a garden variety correction, would be the combination of a weaker dollar, equity and bonds moving lower, crude oil and gold moving higher. Not yet a high probability event, in our opinion, and let’s hope we don’t see it, but keep it on your McSwan list. A credible and sustainable long-term debt/fiscal program included in a Congressional debt ceiling deal would go a long way in easing the concerns of the ratings agencies and increase the confidence of foreign investors in their dollar holdings. Further dithering will be costly.

Good luck this week!

See the original article >>

Basis of the Stocks Bear Market Rally


Of late, I have been receiving questions asking how I can justify saying that the advance out of the March 2009 low is a bear market rally. After all, doesn't a rally of some 26 months have to be a bull market? No, it does not and I continue to believe that this is a bear market rally that will ultimately separate Phase I from Phase II of a much longer-term and ongoing secular bear market. I have addressed this topic before, but for some reason these questions are being asked again, so I will address them here again. The explanation that this is a bear market rally within a much longer-term secular bear market lies with the historical bull/bear market relationships, Dow theory phasing and values.

Let's first look at bull and bear market relationships. But, before I even begin, I want to clarify that cycles have absolutely nothing to do with Dow theory. Cycles and Dow theory are two completely different disciplines. However, they can be used to compliment each other if we understand both disciplines.

Now, with that being said, the bull and bear markets of the late 1800's and very early 1900's, which Dow, Hamilton and Rhea wrote about, are one in the same as the upward and downward movements of the 4-year cycle. In other words, the upside portion of a 4-year cycle was the same thing as a bull market in accordance with Dow theory and the downside portion of the 4-year cycles were the same as the bear markets in accordance with Dow theory.

But, beginning in 1921, these bull and bear market periods began to grow in duration. I feel that this is a direct result of the growth in population. As our country grew, more and more people began investing and as a result, the bull and bear periods became longer. In turn, bull and bear markets evolved into a series of multiple 4-year cycle events. For example, the first bull market to consist of multiple 4-year cycles ran from 1921 to 1929 and consisted of two 4-year cycles. The low in November 1929 was a 4-year cycle low. The rally, or "Secondary Reaction," as it would be termed in accordance with Dow theory, that followed was the upside portion of a 4-year cycle that topped in only 5 months. Once this "Secondary Reaction" was over, the DJIA moved down below the previous 4-year cycle low and into the 1932 4-year cycle low, which proved to be the bear market bottom. I would also like to point out that the 1921 to 1929 bull market advanced a total of 568% from the 1921 4-year cycle low at 67 on the DJIA to the 1929 4-year cycle top at a high of 381.

The next great bull market began with the 4-year cycle low in 1942 and ran to the 4-year cycle top in 1966. This time the "Primary" bull market was comprised of a series of six 4-year cycles and advanced a total of 1,076% from the 1942 4-year cycle low at 93 on the DJIA to the 1966 4-year cycle top at a high of 1,001 on the DJIA. Note that in percentage terms of the advance, this bull market advance was roughly double the preceding great bull market of the 1920's. The bear market that followed was also a series of 4-year cycles. From the 1966 4-year cycle top, the bear market moved down into the 1974 bear market low. This was a series of two 4-year cycles.

Now, I want to focus on the bear market declines. Prior to the first great bull market that ran between 1921 and 1929, the bear markets averaged some one-third the duration of the previous bull market. This relationship has also held true with the extended bull market periods as well. For example, the 1921 to 1929 bull market was 8 years in duration and the 1929 to 1932 bear market was 3 years, making the bear market duration 37.5% of the preceding bull market. The 1942 to 1966 bull market was 24 years in duration and the 1966 to 1974 bear market was 8 years, which was 33.3% of the duration of the preceding bull market.

From both a cyclical and a Dow theory perspective, the last and greatest bull market of all time began with the 1974 4-year cycle low. Some say that it began at the 1982 low, but in reality, that is when the new bull market became obvious. The low occurred in 1974 and Richard Russell called that low at the time using Dow theory. The bull market that began in 1974 carried price up into the 2007 top, which was a period of 33 years and consisted of a series of eight 4-year cycles for a total advance of 2,390%. Note that once again this bull market advance more than doubled the magnitude of the preceding bull market advance, which is also another consistency.

Now, if we apply the normal bull bear relationship of approximately one-third, then given that the last great bull market ran some 33 years, this bear market should last until somewhere late in this decade. I will add to that, the more they monkey around with the natural forces of the market, the longer they are apt to drag things out and the worse it will be. Because the 2009 low occurred only 17 months after the 2007 top, that low falls far short of the normal one-third relationship that has historically been seen. Therefore, based on these historical relationships I do not believe that we have seen the bear market bottom.

According to Dow theory, each bull and bear market period has three separate phases. This phasing is an important aspect of the Dow theory that is most often over looked. The 1966 to 1974 bear market is a perfect example of a bear market, its three phases and the rallies separating each of the phases. Therefore, I will use that chart to illustrate this concept.


Referring to the chart above, Phase I of the second great bear market began at the top in February 1966. This top was confirmed under Dow theory in May 1966. From this top the market declined into the Phase I low in October 1966. This Phase I decline is marked in blue on the chart above and it carried the market down some 25%. From this Phase I low the typical rally that serves to separate Phase I from Phase II began. This rally carried the market up some 26 months and is marked in green on the chart above. During this 26 month advance you can see that there were a couple of false breakdowns that the market was able to recover from and inevitably pushed higher. In fact, with the advance into 1968 bettering the 1967 secondary high points, a traditional Dow theory bullish trend change even occurred.

But, those who understood Dow theory phasing would have understood that this was a bear market rally separating Phase I from Phase II of a much longer-term bear market and not a new bull market. I can also assure you that the longer this rally lasted the more bullish and more convinced the public became that a new bull market was underway. Also, when the market would recover from these false breaks, I strongly suspect that the bullish sentiment must have been off the chart. I'm also sure that the Dow theorists continued to warn, but few understood or listened to these warnings. Then, with the Dow theory trend change in 1968 I'm sure that the public was convinced that a new bull market was underway. They probably proclaimed that anyone stating anything other than this "obvious" bull market needed to be admitted for a psychiatric evaluation. After all, this was "obvious" and anyone not seeing it was obviously blind.

However, in spite of the false breaks, the bullish sentiment, false recoveries and claims of new bull markets, the Dow theory phasing prevailed and the decline into the Phase II low carried the market down some 36% to new lows over a 17 month period. This Phase II decline is marked in red on the chart above.
Then came the rally separating Phase II from Phase III of this ongoing secular bear market. This rally carried the market up 66% over a 32 month period. This advance is also marked in green on the chart above. Once again, the world was convinced that the bear market was over. After all, the market had made a new high. How in the world could we still be in a bear market with the market at new highs? Those Dow theorists had to be wrong this time around because this time was different and it was "obvious" with the market at a new all time high.

But, once again, the Dow theory phasing prevailed and Phase III took the market down 45% into the final Phase III low. This low marked the bottom of the second great bear market. This time, those who understood the Dow theory were able to recognize this bottom for what it was, as did Richard Russell. History tells us that the public was so beaten down by the time the Phase III low had occurred that once again they did not listen to the Dow theorists. Bearish sentiment was sky high and anyone pushing stocks at this point, again needed counseling. Who in their right mind would buy stocks after suffering through these declines? However, the Dow theory phasing was proven correct and the third great bull market, that ran until the 2007 top, was born at the 1974 Phase III bear market bottom.

This brings us to our current chart below. From the 2007 top, the Industrials dropped some 53% over a 17 month period into the bear market Phase I low in March 2009. This decline is marked in blue on the chart below. From that low the typical rally separating Phase I from Phase II began. Just as with the 1966 to 1968 rally, the longer this rally lasts, the more convinced the public will become that this is a "new bull market." I know from my research what this bear market rally top will look like because I have identified a common DNA Marker that has appeared at every major top since 1896. I'm covering these details and developments in the research letters and updates at Cycles News & Views. This rally will top in accordance with those DNA Markers and will allow me to identify it as well. Therefore, based on my knowledge of Dow theory phasing and the historical bull and bear market relationships I do not believe that we have seen the bear market bottom or that the advance out of the March 2009 low is a new bull market.


Let's now look at value, which is another historical marker of secular bear markets. Historically, the dividend yield will be roughly equal to the price earnings ratio at secular bear market bottoms. I have used the S&P data here because I did not have this data as far back on the Industrials. At the 1932 bear market bottom the yield was 10.50% and the P/E was just under 10. At the 1942 bear market bottom the yield was 8.71% and the P/E was 7.3. At the next great bear market bottom in 1974 the yield was 5.9% and with a P/E of 7.24. If we take this same reading at the 1982 low the yield was 6.2% and the P/E was 6.9. For the record, these P/E ratios are based on Generally Accepted Accounting Principles and not the bogus George Orwellian methods of today. At the 2009 low, the P/E was 26 with a dividend yield of 3.2, which is hardly at par. Therefore, based on this historical measure, there is also no indication that the 2009 low marked the bear market bottom.

The top of the rally separating Phase I from Phase II of this ongoing bear market is looming. The manipulation and efforts to keep the market afloat will not matter. The natural forces of the market will prevail. By understanding the environment in which we are operating and by knowing how to identify the top we can prepared for what lies ahead. I was able to identify the top in 2000, which is well documented. All throughout the 4-year cycle advance into the 2007 top I warned that the efforts to prop up the markets would not work, that it was stretching the 4-year cycle and that it would ultimately only serve to make matters worse and I was also able to identify that top, as well. Again this was all documented. Few listened. I am again warning. The manipulation does not matter. This time, it is a bear market rally and the Phase II decline will come, once the proper setup is in place.

Stock Market Cycles Analysis


Let’s take a step back and examine the intermediate-term outlook for 2011 based on some observations we made earlier this year.

Earlier we discussed the outlook for 2011 based on an “echo analysis” of the Kress cycles. In January, Ned Davis Research produced a chart which combined the stock market’s 1-year, 4-year and 10-year tendencies. This composite chart suggested that most of this year’s gains will occur in the first half of the year. Our own composite work based on the Kress cycle “echo” phenomenon also suggested that the stock market could make a significant peak in the April-May time frame and that most of the market’s gains would be made in the first half of 2011.

The Kress cycle “echo” effect is a composite of the 6-year, 10-year, 30-year and 60-year cycles. Using 2011 as the starting point we go back 6 years to 2005, 10 years to 2001, 30 years to 1981 and 60 years to 1951 to arrive at the composite “road map” for the stock market. This provides us with only a rough approximation of what could happen and shouldn’t be used as an absolute guideline since no two markets are ever exactly alike. These cyclical tendencies are worth noting, however, since they do tend to show the same tendencies during the echo years mentioned above.

In the Feb. 4 report we did an in-depth echo analysis in which we looked at the 6-year cycle going back to 2005, the 10-year cycle going back to 2001, the 30-year cycle back to 1981, and the 60-year cycle back to 1951. We concluded that the February-March time frame tends to be a rally period for the stock market with April being a “blow off” or peak month. We found that in the previous “echo” periods of the analysis that the market had a tendency to post interim peaks in late April or early May.

For instance, going back to the year 1951 we found that the stock market posted an interim peak in the early part of May that year in keeping with the common theme of all four years. In the 30-year echo year of 1981 the market’s final peak was made at the end of April. In the 10-year echo year of 2001 the market’s peak was in mid-May.

In the Feb. 4 report we wrote, “There are two conclusions that can be made from this echo analysis of the four key Kress cycles. The first is that the stock market tends to rally in February with a significant short-term peak in March. The second conclusion is that a significant intermediate-term top tends to occur in the May time frame.” Also in the Feb. 4 report it was noted that Ned Davis Research had produced a chart which combines the stock market’s 1-year, 4-year and 10-year tendencies. This composite chart suggested that most of this year’s gains will occur in the first half of the year.

With the benefit of hindsight we can see that this echo analysis proved itself useful in predicting the late April/early May top this year. There was a tradable rally in February with a correction March, followed by another significant peak at the start of May. So far the Kress cycle “echo analysis” has proven to be reasonably correct in predicting the first five months of 2011. The question we want to examine tonight is what the second half of 2011 will likely show based on the Kress cycle echoes.

To answer this question it will help us to once again go back and examine the stock market chart patterns from the key years 2005 (6-year cycle), 2001 (10-year cycle), 1981 (30-year cycle) and 1951 (60-year cycle). Once we’ve done this we can average out the patterns to form a composite for what the second half of 2011 might look like. By way of disclaimer, please keep in mind that “markets and snowflakes are never exactly the same,” so this is only a rough approximation and should be used as an absolute rule by itself.

Before we continue with our echo analysis, I’d like to point out that while I’ve always employed the S&P 500 Index (SPX) as my preferred benchmark for the U.S. broad market this has only been true since about 2002 at the previous 12-year cycle low. Prior to this the Dow 30 Industrial Average was a useful proxy for the broad market and was much more representative of the broad market (and economy) than it is today. Another point worth mentioning is that the SPX was unduly influenced by its tech stock component during the tech stock crash of 2000-2002, which explains why the SPX significantly underperformed the Dow for much of that bear market.

Starting with the 10-year Kress cycle echo, in 2001 the Dow 30 Index peaked in early February and followed this up with a higher peak in May. The May 2001 peak proved to be the high for that year. This was followed by a steady decline into September, at which point the dominant interim weekly cycle bottomed. Of course the year 2001 was a bear market year and this influenced the path stock prices took for much of that year.


This year has seen a continuation of the bull market and as such the comparison isn’t analogous. The point worth emphasizing here is that instead of a sustained decline in the coming summer months like we saw in 2001, the upcoming months could see a lateral trading range. This is what would have happened in the summer of 2001 had it not been for the severe downward pressure exerted by the tech stock market deflation.

Next we have the 30-year echo which takes us back to 1981. The Dow peaked at the end of April ’81 as you can see here. This is a chart that I suspect will be very instructive for us in the upcoming weeks. As you can see, while the Dow peaked in late April there was a secondary peak in mid-June which came just short of equaling the late April peak. In other words, it was a classic “double top.” As we’ve been discussing in recent reports, the technical indicators have been suggesting a rally is in the process of unfolding which could bring the major indices back up to the May 2 peak – or close to it. A failure for the market to achieve a higher high above the May 2 peak from here would be interpreted as a bearish omen, especially with the Fed’s quantitative easing (QE2) Treasury purchasing program coming to an end at the end of June.

The 1981 chart of the Dow shown above is instructive only insofar as it shows a double top into the May-June time frame. What happened after this in ’81 probably won’t happen this year as the market still has a lot of support from the 6-year cycle peak scheduled for late September/early October.

We’ve discussed the possibility that the summer months will witness a lateral trading range with the May 2 top forming the upper boundary of this range. The final element of our echo analysis, namely the 30-year echo from 1951, provides us with more of a positive slant. What’s interesting about 1951 is that the stock market pattern from that year is nearly identical with the year to date. There was an early year rally and short-term peak in February followed by a higher – and more significant – peak at the beginning of May. The S&P 500 Index bottomed in late May that year and rallied into mid-June.

After a double bottom in July 1951, the S&P proceeded to rally to new highs before peaking in October, at which time the 6-year cycle peaked (just as it will this coming October). Here is where the potential similarity ends with 2011. While it’s possible the market could make a token new high heading into the upcoming 6-year cycle peak in late September/early October, the bigger likelihood is that the market will go into range-bound mode once QE2 expires on June 30.

See the original article >>

Follow Us