Friday, May 27, 2011

Sovereign Debt Default Risk

by Bespoke Investment Group

Below is a table showing default risk as measured by 5-year credit default swap prices for nearly 60 countries worldwide. As shown, default risk for Greece is by far the highest of any country shown, and 5-year CDS prices for the country are up 40% so far in 2011. Venezuela has the second highest CDS prices, but they're only up 6% year to date. Portugal and Ireland are the 3rd and 4th riskiest countries.

The countries that investors believe are least at risk of default are currently Norway, Sweden, Finland, and Denmark. The US used to be the least at risk of default, but CDS prices here have ticked up 20% so far in 2011. US default risk is still low relative to the rest of the world, but any tick higher is something we don't want to see.


7 REASONS WHY GOLD DEMAND IS SURGING IN CHINA

by Cullen Roche

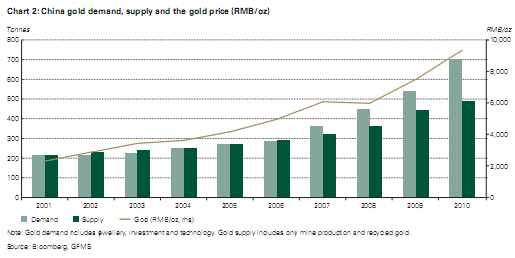
The most recent World Gold Council’s quarterly report showed a continuing boom in gold demand from China. China has been the single most important component in the 10 year commodity boom and their demand for gold is no exception. In fact, this makes a great deal of sense. You see, many of the hyperinflationary concerns that we often hear about in the USA are real viable threats in China. China really is printing loads of money. They really do have a high inflation problem. China really is a command economy. Add in the strong fundamental underpinnings in the Chinese growth story and you have a pretty solid thesis leading to increased gold demand.

In the report, they list 7 reasons why gold demand is likely to remain strong in China:
1) Gold investment is rooted in Chinese culture.
2) Impending inflationary fears in emerging markets.
3) China Central Bank is positive on gold.
4) Limited domestic investment channels.
5) Advisory from top Chinese economic scholars.
6) Increase in asset allocation to gold by institutional investors.
7) Potential increase in gold demand from a growing middle class.


See the original article >>

DIVERSIFYING AWAY FROM STOCKS AND BONDS

By Charles Rotblut

What diversification options are there beyond stocks, bonds and commodities? A member recently asked me this question. Here is an expanded version of the answer I sent him.

Not all stocks and bonds move in sync with one another, and making sure your holdings in both are properly diversified is the best place to start. If you have never given thought to your stock and bond allocations, you need to adjust these before moving on to other asset classes. Even if you have paid attention to your allocations in the past, review your portfolio annually (or every six months) to ensure the percentage invested in these two asset classes makes sense given your goals and tolerance for risk. (AAII members have access to asset allocation models that show suggested diversification strategies.)

Stocks – Simply splitting your holdings between U.S. large-cap, U.S. small-cap, developed international market and emerging market stocks gives diversification benefits. Though correlations (the extent to which different assets move in sync with one another) become closer during financial crises, they move apart during periods of recovery. Over the long term, each of these stock categories will generate different types of returns.

Bonds – Though the outlook for interest rates is uncertain, bonds continue to play an important role in your portfolio, since they provide both income and return on capital. Diversification can be achieved by holding a variety of U.S. government, corporate and foreign bonds. If you are worried about inflation, shorten the duration of your holdings, which will reduce the sensitivity of the portfolio to interest rate changes. (My bond funds have average durations of between four and five years.)

REITs – Real estate investment trusts provide a stream of income as well property ownership. They are sensitive to interest rate changes, but are more correlated with stocks than bonds. Keep in mind that if you own a house, you are already invested in residential real estate. If you have a mortgage, you’re investing in residential real estate on margin. Thus, a REIT focused on commercial real estate may make more sense.

Master Limited Partnerships – MLPs are mostly involved in the oil and natural gas pipeline business. They have a unique structure that results in them paying relatively high yields, but MLPs tend to be more correlated with stocks. MLPs come with potential tax issues and their distributions must be monitored when they are held within an IRA.

Preferred Stock – This is a hybrid security that offers a stream of dividend payments and limited voting rights, but is sensitive to interest rates and should be monitored for credit quality. This is why preferred stocks share return characteristics with both stocks and bonds. In a portfolio, they would be funded with some money that would otherwise be allocated to stocks and some money that would otherwise be allocated to bonds.

Annuities – These are contracts that return a stream of income over a certain period of time. The advantage is that they can guarantee you a minimum level of return. The disadvantage is that they can be complicated, have high comparative costs and offer limited upside, especially compared to the potential returns realized by investing in stocks. When used properly, annuities can offer financial security and can offset part of your bond holdings.

Precious Metals – Gold’s value has historically been inversely correlated to currency valuations over long periods of time. Over shorter periods, it is influenced by shifts in sentiment. Precious metals are a hedge for your portfolio that is unlikely to create wealth unless your timing is really good. An ETF can remove many of the headaches (including the threat of theft) associated with buying and storing gold and other precious metals. Arguments can be made to use both stock and bond dollars to buy precious metals; if pushed, I would suggest allocating to gold from your stock holdings given the lack of cash flow.

Commodities – A basket of commodities, including precious metals, energy (e.g., oil) and agricultural goods (e.g., wheat) provides a hedge against inflation. It also lowers the volatility of a portfolio holding only stocks. Commodities are subject to sharp swings in volatility. Futures contracts are used to invest in these (accessible via mutual funds and ETFs), but come with an additional level of risk and complication. If used, 10% to 15% of the money invested in stocks should be shifted to commodities.

Hedge Fund Strategies – A growing number of mutual funds and ETFs follow strategies designed to mimic those used by hedge funds. These can provide different returns than you would otherwise get in a more traditional investment. The downsides are that you will be paying higher fees, the strategies can be complex, and they are risky by themselves. The suggested allocations discussed at a Morningstar conference on alternative investments that I attended on Tuesday ranged from 0% to 25% of portfolio dollars (funded from both stock and bond allocations), with 15% used as a benchmark. One fund manager said that anyone who does not fully understand the strategy being used should avoid hedge funds and any investments that mimic them. This is good advice that applies to any investment offering.

Currencies – Foreign currencies can help protect your portfolio against fluctuations in the U.S. dollar. They are volatile, and an individual investor is pitted against traders with access to economists and offices staffed 24 hours a day. (Foreign currency exposure can also be obtained by investing in foreign bonds.) From an allocation standpoint, use portfolio dollars from both stocks and bonds if you are holding a currency fund for an extended of period of time and from stocks if you are going to trade currencies actively (which I do not recommend).

The Role of Cash

The one asset class not mentioned above is cash. Cash and its equivalents (money market funds, CDs, Treasury bills, etc.) give you both safety and flexibility. The primary advantage of holding onto cash is having the ability to pay for unexpected expenses and take advantage of new, attractive investment opportunities when they appear. The downside is that inflation erodes your purchasing power. (Remember when putting $5 in the gas tank actually allowed you to drive somewhere?)

MORE CONFIRMATION OF THE ECONOMIC SLOWDOWN

By Comstock Partners

Our comment of two weeks ago outlined the major headwinds likely to impact both the economy and stock market over the period ahead, while last week’s comment discussed the actual economic slowdown that was already happening. Events of the past week have confirmed these views.

The Chicago Fed’s National Activity Index of 85 coincident indicators for April dropped to minus 0.45, its lowest level since last August. The index has now been below zero for five of the last eight months, as is the three-month moving average. This means that the economy was probably growing below trend in the first quarter, and possibly the second as well.

First quarter revised GDP growth was not revised upward as the consensus expected, but remained at the originally reported 1.8%. Moreover the underlying data deteriorated as consumer spending growth was revised down to 2.2% from 2.7% and inventory accumulation was revised up by $9 billion. Furthermore, major firms have been reducing their second quarter GDP growth estimates to well below 3%. Recall that toward the end of 2010 most pundits were looking for 4% growth in the quarters ahead.

Initial weekly unemployment claims, reported today, rose to 424,000 and have now remained well above 400,000 for the seventh straight week after a period of coming in below that level. This does not bode well for upcoming monthly payroll employment.

The ECRI Weekly Leading Index was down again last week, the fourth decline in the last six weeks, and the lowest since the week of January 15th. A slowdown in this indicator generally suggests a period of tepid growth in the period ahead.

The May numbers for both the Richmond and Kansas City Fed indexes fell sharply, confirming the previously reported results for the Philly Fed and the Empire State Manufacturing Survey. This strong unanimity strongly suggests that industrial production is still extremely sluggish in May. These results are consistent with the April decline in core capital goods orders of 2.6%. Similarly, shipments dropped 1.7%.

Keep in mind that this has happened during a period during which QE2 poured reserves into the financial system, the stock market rallied and fiscal policy was boosted by the reduction in payroll withholding. With all of that we have an economy that is growing below trend and fading rapidly. Now QE2 is ending within weeks, fiscal policy is about to tighten and housing prices are still falling with lots of additional supply still coming.

The stock market has now stalled for over three months and appears to be in the process making a top. The S&P 500 reached an intra-day high of 1344 on February 18th, backed off and then broke out to a new high of 1370 on May 2nd. It has since declined to well below the 1344 mark, a strong indication that the breakout has failed and that a new decline may be underway. This would be similar to the pattern of 2010, when the market dropped 17% following the end of QE1. That time the market was saved by the initiation of QE2. The Fed, however, is running out of ammunition, and we doubt that a QE3, if ever implemented, would be that effective.

Options Trading Manipulation: Two Charged with Manipulating Oil Prices

by johnu

Options Trading Pair Accused of Manipulating Oil Prices

(Calgary Herald)
Earlier this week, the US futures regulator sued two veteran oil traders along with their employers, the Arcadia Energy Suisse SA and Parnon Energy Inc. (both owned by by Norwegian shipping magnate, John Fredriksen), for allegedly booking $50 million in profits through the manipulation of oil prices in 2008.

The Commodity Futures Trading Commission has accused the pair of options trading employees at Parnon and Arcadia of carrying out a cross-market options trading trading scheme between January and April of 2008. The options trading scheme involved the accumulation and sell-off of a substantial position in physical crude oil in order to manipulate futures prices.

Specifically, trading activities involved the interplay between physical oil storage held in Cushing, Oklahoma, along with the delivery point for the US benchmark futures contract plus the derivatives market. Apparently, the pair would try to boost prices by purchasing commercial supplies of crude around Cushing as well as force prices lower by dumping crude in order to depress prices and then to profit on short options trading positions.

However, the charges appear to not be related to crude oil’s recordbreaking spike to almost $150 a barrel back in 2008.


Options Trading Tip: The Advantages of Spread Trading

(InvestorPlace)

An options trading spread is an options trading strategy that involves the purchase of one option and the simultaneous sale of another. Given this very broad of a definition for an options trading spread, there is a huge number options trading strategies that can be undertaken.

More importantly, options trading investors should note the following three advantages of a bull call spread verse just buying a call option outright:
  • Less Risk. Given that an options trading spread involves the buying and selling of options, the premium received from the short option will help to offset options trading costs. Hence, this will also reduce options trading risk associated with the trade.
  • Lower Theta Risk. When an options trading investor purchases an option, they will acquire a negative Theta position. Moreover and has time passes, this type of options trading position will loose value. On the other hand and when an options trading investor is selling an option, they are actually profiting over time. Hence, entering a spread trade can reduce one’s exposure to time decay by as much as half.
  • Lower Volatility Risk. Options values will increase when implied volatility rises but decrease when implied volatility falls. However, spread trades can be used to minimize volatility to some degree.
In other words, spread trades can be used to lower the amount of money an options trading investor risks and limit his or her exposure to both time decay and implied volatility.


Options Trading Bulls Charge Up on Tesla

(MarketWatch)

5189224326 36589158f4 m optionsOptions trading investors are taking up positions to benefit from the rise in shares of Tesla Motors Inc. after the car company announced that it will sell a batch of stock in order to fund a new “crossover” model.

Specifically, options trading investors are purchasing bullish calls that grant them the right to buy shares for $30 by June expiration. In addition, options trading investors are targeting calls with a $30 strike that will expire in July.

The announcement sparked unusually heavy options trading for Tesla’s options and about 18,000 calls versus about 4,700 puts exchanged hands. In fact, overall options trading volume in Tesla’s options were the second-highest since the company had its IPO.

Oil price manipulation


The Commodity Futures Trading Commission on Tuesday filed a civil enforcement action alleging that Nicholas Wildgoose and James Dyer, who worked as traders for Arcadia Petroleum Ltd. and its affiliates, profited by manipulating the price of oil and oil futures in early 2008. I was interested to take a look at the details of the CFTC allegations.

Let me begin by providing a little background. Cushing, Oklahoma has an important network of pipelines and storage facilities that allow it to serve as a major trading hub for crude oil. There exists a physical market in which you can arrange to buy or sell oil for delivery in Cushing. Yesterday (the 25th calendar day of May) was the last day you could have scheduled a pipeline to deliver physical oil to Cushing some time in June. Economists might describe an agreement reached in May to receive oil some time in June as a forward contract.

There are also separate arrangements known as futures contracts, such as the well-known light sweet crude contract traded on NYMEX. Whereas a forward contract is an agreement between two particular parties accompanied by a stand-by letter of credit from a bank ensuring the buyer’s ability to pay, a futures contract is intermediated by an exchange that insists on maintenance of a continually adjusted margin account, creating the possibility for an anonymous, purely financial transaction. Many of the people who buy futures contracts do not want to receive physical oil in Cushing, but instead intend from the beginning to later sell the contract to somebody else in order to reap a financial gain if the price goes up, as a way to hedge against certain risks. For example, a refiner, even if not located in Cushing, might buy (and later sell) a NYMEX futures contract as a form of insurance against an increase in the price of oil during the time the contract is held. Alternatively, a pension fund might want to buy (and later sell) a futures contract in order to have some insurance against inflation or commodity price moves that could adversely affect other holdings in its portfolio. Other people might be interested in a futures contract because they have a particular belief about the direction that oil prices will head. If someone buys a futures contract and at some later date sells the same contract, the futures exchange nets out those transactions, so much of the time when two parties enter into a futures contract, no oil ends up being physically delivered to anybody.

But if you buy a futures contract and never sell it, a NYMEX contract entitles you to receive delivery of 1000 barrels of physical oil at Cushing, Oklahoma some time in the month specified by the contract. Trading in the June NYMEX futures contract ended on May 20, three business days before the last day of pipeline scheduling on the 25th, to allow parties who held on to their futures contract all the way to expiry 3 days in which to schedule a date in June for physical delivery to Cushing.

The CFTC complaint alleges that between January 8 and January 18 of 2008, oil traders Nicholas Wildgoose and James Dyer entered into forward contracts to buy 4.6 million barrels of oil for physical delivery in February, an amount that represented 66% of their beginning-of-month estimate of the total physical Cushing market. Between January 3 and January 16, the pair is alleged to have also bought about 13,600 February futures contracts (equivalent to 13.6 million barrels of oil) and sold the same number of March futures contracts. The claim is that by creating the appearance of temporarily tighter conditions in the physical market, the February futures price would rise relative to the March and the traders would profit as they closed out their futures positions between January 16 and January 22.

The graph below plots the prices of the February and March NYMEX futures contracts during the month of January 2008. Note that the CFTC is not alleging that these actions were a cause of rising oil prices– in fact, the price of oil was falling during this period. Rather, the allegation is that these actions resulted in an increase in the spread between the February and March futures price, that is, in the absence of these actions, the February price would have fallen more and the March price would have fallen less.


Price of February and March NYMEX light sweet crude oil futures during the month of January 2008.
cftc complaint1 economy


The CFTC complaint alleges that Wildgoose and Dyer subsequently acquired by January 25 a net short position in March futures and long position in April futures equivalent to 12.2 million barrels. The allegation is that this was done in anticipation of suddenly selling off on the last possible day (Jan 25) all 4.6 million barrels of the physical oil previously accumulated; I gather that the allegation is that this was achieved by finding somebody currently holding rights to delivery of an equivalent volume in March who was willing to swap and take delivery instead in February, provided that the offered February price was sufficiently low. The effect of such a huge last-day sale would have been to depress the February physical price as the market discovered that the apparent big demand for oil just wasn’t there. Although Wildgoose and Dyer would of course have taken a big loss on their physical contracts (by virtue of having bought at the artificially higher prices that their bids created and then selling at the artificially lower prices that their sales induced), the CFTC alleges that they more than made up for these losses with bigger profits on the corresponding futures transactions. The CFTC complaint alleges that the pair lost $15 million on the physical transactions but gained $50 million on futures transactions, profiting first by the increase in the February-March spread induced by creating the impression of an unusually tight February physical market, and then later profiting by the decrease in the March-April spread by surprising the market with much more physical oil available for delivery than people had been assuming.


Price of March and April NYMEX light sweet crude oil futures during the month of January 2008.
cftc complaint2 economy


The CFTC complaint goes on to allege that the pair repeated the same sequence of transactions in March of 2008– initially profiting from a long position on the April-May spread by surprising the market by buying a large quantity of physical oil for April delivery in the first part of the month, and then profiting from a short position on the May-June spread by surprising the market by selling off their physical positions on the last possible day.


Price of April and May NYMEX light sweet crude oil futures during the month of March 2008.
cftc complaint3 economy


Again, March 2008 was not a month in which the oil price overall is alleged to have been driven up as a result of the traders’ actions. Instead, the claim is that their actions led to an initial increase in the April-May spread and a subsequent decrease in the May-June spread.


Price of May and June NYMEX light sweet crude oil futures during the month of March 2008.
cftc complaint4 economy

Follow Us