Sunday, May 15, 2011

It’s 2007/08 All over Again!


Today looks eerily similar to what was going on in 2007 and early 2008. Then, as now, the vast majority of my macro-economic and stock market indicators issued massive warning signs. And then, as now, the stock market ignored them for a seemingly endless time.

The big difference: Then it was the beginning of the housing slump that massively disturbed me. Now it’s the beginning of the international government debt and funding crisis that makes me increasingly bearish.

If you recall, the housing and mortgage credit crisis did not befall the world out of the blue. There had been many warning signs. And some of the best market analysts clearly pointed them out. Plus it was a relatively slow development that took many months until it finally culminated during the autumn of 2008.

Then It Was the Fed’s Bernanke,
Now It’s the ECB’s Stark

I remember when Ben Bernanke spoke out in 2007, at the beginning of the housing crisis. “Containment” was his buzz word. And he assured us that neither the housing market nor the economy was in danger. He even gave an estimate of “up to $100 million” in mortgage-related bad debts. 

In an interview at the time I strongly rebutted Bernanke’s soothing remarks and added that he was probably off by at least one zero.

Now we have another central bank bureaucrat uttering soothing words: Jürgen Stark, Chief Economist of the European Central Bank (ECB). He said,
“The discussion about restructurings in the Eurozone is based on the totally false assumption that one or another EU member state is insolvent.”
Well, as we all know there are three EU member states — Greece, Ireland, and Portugal — that have already needed an illegal bailout by other EU members. If that’s not insolvent, what is? 

These countries don’t have a liquidity problem, they have solvency problem … a severe one at that! And solvency problems don’t get cured by injecting additional credit. 

According to Stark, a single euro member country default could trigger a banking crisis worse than the one that followed the September 2008 Lehman Brothers collapse. And I certainly agree with him on this point.
But he doesn’t expect any defaults! That’s where we disagree …

I think that European government defaults are just a matter of time. And the market is massively supporting this view. 

In fact, yields on 2-year Greek bonds are well above 20 percent — a strong market signal that default is unavoidable.

Now, let’s take a look at the … 

Six Theoretical Escape Hatches

In theory, there are six ways to resolve the global debt trap — six escape hatches:
  1. An economic growth miracle
  2. Major interest rate cuts
  3. Bailouts by other governments
  4. Money printing
  5. Austerity
  6. Outright default
In case of Greece, Portugal, Ireland and other European countries sitting in a debt trap: Options one, two, three and four aren’t available. 

Growth miracles are the result of free market policies not in sight anywhere in Europe. Interest rates are already as low as they can get. 

Bailouts have already been tried. Now it’s getting clearer that they weren’t enough, and the willingness of donor countries to do more is fading. 

And due to the common currency, the ECB is the only one that can print money. That is as long as the troubled members want to keep their euro membership.

This leaves them with escape hatches 5 and 6: Austerity and default. They are trying the former to a minor degree. But because of the huge debt load it’s not enough to solve the problem.  

What’s more, austerity is very unpopular … 

Resistance among citizens is snowballing. And sooner or later populists will ride on this wave and opt for outright default — the only other way out.

The situation in the U.S. isn’t much better. The country is also trapped. But …

The U.S. Has More
Options Left

First of all, the U.S. has a printing press as Mr. Bernanke so famously said ten years ago. Therefore inflation is feasible. 

Second, the U.S. has much more fat available to cut. Hence severe austerity policies could still lead the way out of this mess. 

Third, the U.S. is much more flexible, politically and as a society. A return to real market-oriented policies is still conceivable, accepting short-term hardship to foment a growth miracle later.

Mr. Stark has a point when he says that an EU government default would trigger another major banking crisis. But he is either naïve or whistling in the dark with his statement that a default would not occur. 

It will, and probably soon. Therefore a bet against the banking sector might be a good idea since we’re talking about another global banking crisis due to the direct involvement of U.S. banks and the strong interconnection of the global financial system. 

Interestingly, as you can see in the chart below the banking sector continues to show conspicuous relative weakness — another reminder of the 2007/08 episode. 

chart stocks

To take advantage of that weakness, you might consider ProShares UltraShort Financials (SKF), an inverse ETF that tracks the financial sector. If you pick it up at current levels, $58-$59, set your stop loss at $54.50. 


GOLD STUCK IN CONSOLIDATION


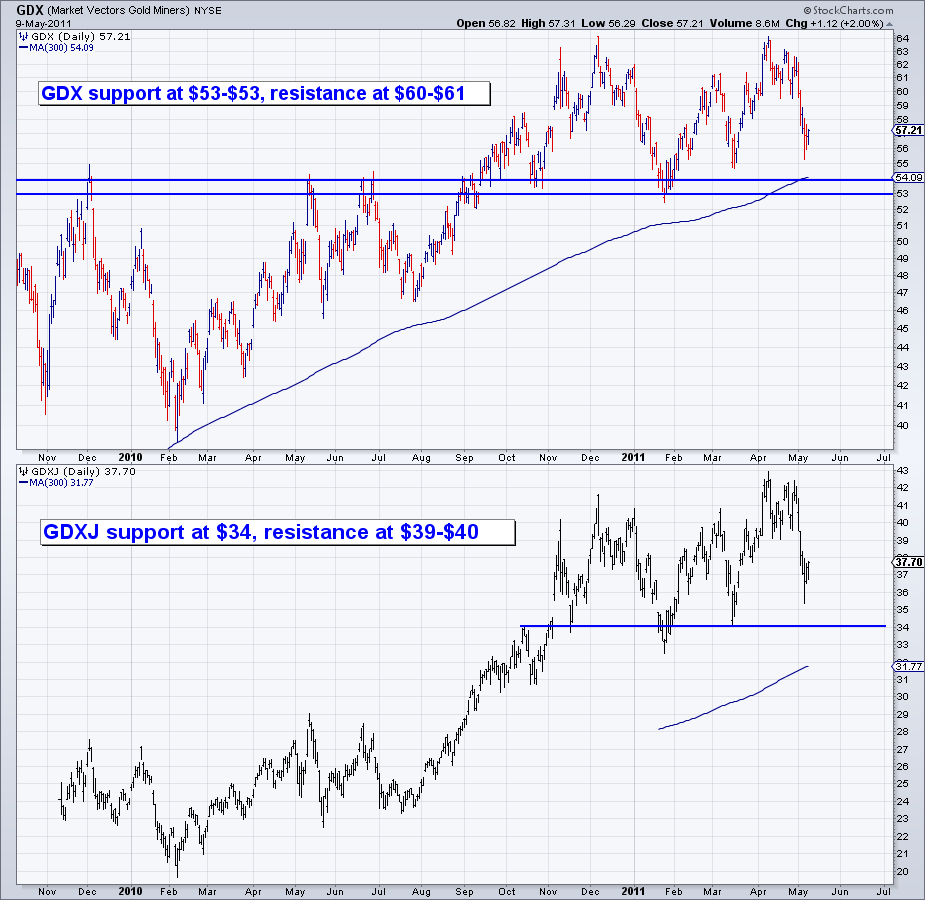
Though Gold and Silver were able to make new highs in recent months, the gold stocks (as evidenced by GDX (large caps) and GDXJ (larger juniors) never did. We wrote of their relative weakness and how it was a warning sign for the sector. The shares failed to breakout and have fallen back into their consolidations at a time when the sector tends to consolidate and correct.

Below we show GDX and GDXJ. For each chart we show the 300-day MA and support and resistance points.
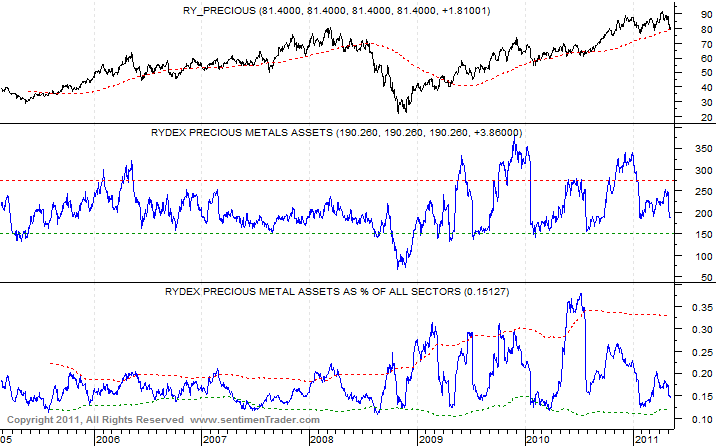
We also have a chart from sentimentrader.com, which tracks the assets in Rydex’ Precious Metals Fund. It is a sentiment indicator.
Note that both the assets in the fund (nominally) and assets relative to other sectors are way below their highs. In fact, they are closer to their lows.

The financial media, day trading types and retail crowd have now forgotten about the sector. Should you? Absolutely not. This is when the real professionals make money and when the average Joe’s struggle.

The typical trader and investor loves to buy strength. There is nothing wrong with that. However, gold stocks are a different animal. There are numerous false breakouts and false breakdowns. For example, GDXJ gave us a false breakout last month. In 2010, GDXJ had a false breakout in May. The best strategy for a volatile sector in a bull market is to use the volatility to your advantage.

Let’s use GDXJ as an example. The market is at $37 with support at $33-$34 and resistance at $39-$40. If you have some patience, you can can buy at $34-$35 and wait for a potential breakout. If the market breaks below $33, you can sell. However, if you wait for a break of $39-$40, then you are already missing out on some upside. Need we mention that a buy at $34-$35 carries less risk because it executes at technical support and likely when sentiment is not positive.

Apply this to your favorite large and junior gold stocks. Identify points of support. If the precious metals follow their typical seasonal pattern, odds are you will have a few chances to nab your favorites at a time when others are panicking and you see articles about a crash or an end to the bull market or, excuse me, the “gold trade.”

See the original article >>

THE DESTABILIZING FORCE OF MISGUIDED MARKET INTERVENTION

by Cullen Roche

In his Financial Instability Hypothesis, Hyman Minsky described how a process of Ponzi finance can result in increased financial instability:
“over a protracted period of good times, capitalist economies tend to move from a financial structuredominated by hedge finance units to a structure in which there is large weight to units engaged in speculative and Ponzi finance. Furthermore, if an economy with a sizeable body of speculative financial units is in an inflationary state, and the authorities attempt to exorcise inflation by monetary constraint, then speculative units will become Ponzi units and the net worth of previously Ponzi units will quickly evaporate. Consequently,units with cash flow shortfalls will be forced to try to make position by selling out position. This is likely to lead to a collapse of asset values.”
The recent downturn in commodities is interesting for several reasons. None more so than the fact that investors are now beginning to notice that the price increases have been driven in large part by speculation generated by QE2. Regular readers are well aware of this fact, however, much of the investment world has been basing their commodity thesis on booming global economies, myths of money printing, misguided fears of hyperinflation and not the primary driver – financialization.

As the Bank Of Japan recently pointed out, there has been a substantial speculative premium in many commodities. In many ways this is reminiscent of 2008 when the Fed was seen as creating inflation, however, what lurked beneath the surface was disastrous deflation. While this environment isn’t nearly as susceptible to collapse, we are still at risk of a major dislocation due to the Fed’s severely misguided policy of QE2 and the market’s dramatic misinterpretation of it.

Financialization of markets

FT Alphaville has done a fantastic job in recent weeks and months covering some of the dislocations and connecting the dots. In a recent story they cited the continuing use of copper as a financial tool:
Veteran copper market watcher Simon Hunt of Simon Hunt Strategic Services believes the dynamics are the result of a longstanding misunderstanding by the industry of the difference demand and consumption. Consumption, being the actual indicator of real demand.
As he noted in a research report earlier this week:
In other words, copper price movements have been quite unrelated to actual business. Demand, in most analysts’ calculations, is confused with consumption. It is the aspect of demand that is material acquired by financial institutions, which has been the principal driver of price. Last week‟s correction was part of the game being played out. At between $9000 and $10,000 there was difficulty in finding new investment buyers; lower prices are needed for the game to continue.
And if that is true, there could be yet another — potentially more sizeable — correction yet.
This is just one obvious effect of this sort of mass financialization of our economies. Other obvious examples include the Chinese farmers who are hoarding cotton due to Fed money printing fears. Other examples, such as the continuing surge in oil prices despite tepid fundamentals, are less obvious. And every once in a while, we can see the financialization impact with our own two eyes as we were able to just a few weeks ago when the Fed announced their continued easy policy stance and every commodity went racing higher in a speculative frenzy in a matter of minutes.

Why is this problematic? 

The risk the Fed creates, when they intervene in markets in this manner, is that they generate the risk of a major dislocation in the markets that feeds over into the real economy. When you create an implicit guarantee and speculators take you at your word they are more likely to generate a destabilizing pricing environment. This was recently seen in silver prices where the inflation bandwagon has run full speed off the tracks and now real silver producers are being forced to deal in a market that is entirely unstable and unpredictable.

When the Fed intervened via QE2 they were not really altering the economy in any meaningful way. This asset swap did not change net financial assets. It did not create more money. It did not result in any stimulus. All it really did was bolster asset prices via the psychological routes. In essence, the Fed was trying to create nominal wealth with the hope that this would translate into real wealth. This can all be proven now by looking at lending data, falling GDP, the stagnant money supply, and exploding margin debt at the NYSE. So, the Fed goes into the market and tells everyone to buy risk assets. Don’t fight the Fed, right? And they didn’t. But focusing on nominal wealth creates the risk that the cart will come before the horse, ie, prices will substantially outpace fundamentals and create a destabilizing market environment.

How does this play out? 

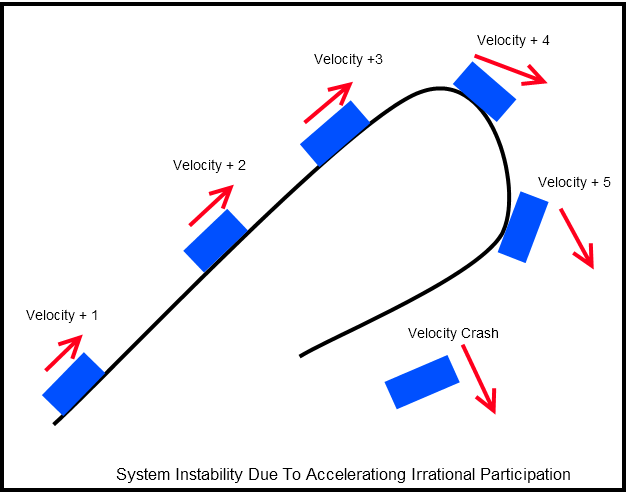
We can visualize this economic journey by envisioning a car on a moderately hilly road. This is comparable to the natural course of the business cycle. There will be ebbs and flows, ups and downs. Markets are irrational as they are. But if a powerful entity is able to intervene in this course of events it’s not unreasonable to expect that the cycle could experience increased volatility as its forces take an unnatural form by distorting the underlying economic reality. In an attempt to generate stability the entity could theoretically create increasing instability. In the case of the Federal Reserve and QE2 this involves focusing on nominal prices as opposed to policy implementation that benefits the real economy. By creating a price increase in nominal terms we risk exaggeration in the pricing mechanism. As we experienced in 2008 that can be devastating as prices surge and then collapse and fear captures the real economy in the aftermath. The following figure shows how such environments might be altered over time to experience increased volatility and business cycle disruption:
What has occurred in recent months is exactly what Dr. Bernanke desired. If we change the perspective on our car on the road we can better visualize how this environment plays out. As our car picks up speed it continues down the road with increasing velocity. Slowly, but surely the participants decide the car can handle more participants and increased velocity that will generate increased pleasure (market gains due to increased speculative behavior). Eventually, the car enters a tight turn (or a bump in the economy). If the speed is greater than that of the natural forces exerted against the car (price disequilibrium resulting in severe instability) then the car will leave the road and enter a period of instability as it veers into uncommon grounds.
This is exactly what occurs when markets enter a period of disequilibrium. In my piece on the silver bubble a few weeks ago I described the four primary components of this disequilibrium:
  • Strong fundamental underpinnings. Bubbles do not merely appear out of nowhere. Bubbles grow over a period of time based on strong fundamental underpinnings. There is always a very good economic reasoning behind bubbles. This feeds into the rationalization of its existence and justifies a “it’s different this time” mentality that later occurs.
  • Ponzi builds. A naturally occurring ponzi process begins. As a recency bias builds (the tendency to overweight recent events and ignore historical facts) the system begins to exhibit herding behavior as more and more investors get in on “the only game in town”. This becomes amplified by the media, those with a vested interest in this particular market, those who “throw in the towel” after wrongly betting against the trend, etc.
  • Illusion of stability within disequilibrium. The illusion of control increases as investors become increasingly confident in the market. They increase their bets, increase price targets, etc. Investors begin to convince themselves that it is “different this time”. All of this is occurring as the system grows increasingly unstable. I like to think of it like a spinning top. When you initially throw a top into a tight spin there is a distinct order in its movements. They are predictable and stable. But as the top loses momentum it begins to spin uncontrollably. The system becomes unstable, unpredictable and ultimately breaks down. Bubbles work within the same sort of illusion. What appears like a stable and self sustaining system is in fact increasingly unstable and entering an inevitable disequilibrium that breaks down.
  • Systemic collapse. All bubbles collapse. It is never “different this time”. As this prior herding effect begins to breakdown there is a flood for the exits as the herd reverses its controlled march into a panicked stampede. The gig is up. Collapse ensues.
In the case of our car, it involves a moderate velocity which is slowly increased as the riders become increasingly confident in the car’s performance and increased pleasure being generated from the ride. As the car enters its first portion of the turn (or bump in the economy) it is tested, but maintains stability. This stability actually increases the instability as the ponzi builds and the riders become even more confident in the car’s performance. In the case of the Fed, the riders need only a small vote of confidence to put the pedal to the metal. This leads to stage three in the disequilibrium where everyone now believes it is different this time. There is no chance the car can slide off the road or threaten its riders. And of course, that exact event occurs and the system is thrown into chaos.

In asset markets like silver the car gained so much momentum that it actually created a destabilizing force. In the ensuing collapse we run the risk that the real economy is impacted through the fear and uncertainty that is involved in the ensuing market collapse. The collapse in silver prices could materially impact the way real producers and consumers utilize the metal. And that collapse can be directly attributed to the various destabilizing forces that helped it to build the momentum that led to the surge in prices and ultimately a period of instability.

This is the risk the Fed has created multiple times over the course of the last 20 years and it is the same risk I believe they have created today. Will it result in a full blown commodity collapse and a highly destabilized global economic event? I don’t know and neither does anyone else. But as a risk manager I have to accept the fact that the risk now appears elevated. But perhaps more importantly, the Central Bank of the United States should recognize the destabilizing nature of its misguided policies. In the future, it would be my hope that the Fed focus more on the real economy and a bit less on nominal prices. Putting the cart before the horse can be highly destabilizing and can result in increased systemic instability. As we sit with 9% unemployment well into an economic “recovery” we should all be aware of how damaging that instability can be….

See the original article >>

Dollar Index Breaks Above 50-DMA

by Bespoke Investment Group

While commodities as a whole started to fall apart again today, it should not be too much of a surprise to see strength in the dollar. With today's 1% rally, the US Dollar Index is now up nearly 4% off its lows a week ago, and is now trading back above its 50-day moving average for the first time since January 13th.


See the original article >>

Agricultural Commodities Markets Are Fertile Ground for Investor Profits


Larry D. Spears writes: Commodities have received an unprecedented amount of attention over the past year, largely because of the rising price of gasoline and dramatic moves by the precious metals.

However, gold, silver and oil haven't been the only high-flyers. Although they haven't generated nearly as many headlines, agricultural commodities markets also have seen substantial price gains over the past year. 

And, given steadily growing supply-demand imbalances linked to a mushrooming global population, upward price pressure in agricultural commodities markets will almost certainly persist for years to come -- meaning repeated profit opportunities for investors savvy enough to ride the trends.

While there had been some rumblings of concern about rising grain prices and their effect on the cost of meat products, it wasn't until mid-April that the yearlong acceleration in the price of foodstuffs made the top of the newscasts.

That's when Starbucks Corp. (Nasdaq: SBUX) informed its legions of coffee addicts its prices would be raised because the company could no longer absorb the added cost of the bulk Arabica coffee beans it brews. 

At the time, Intercontinental Exchange Inc. (NYSE: ICE) futures for July delivery of those beans were trading at $3.025 a pound - more than double their price in May 2010. By last week (May 3), July coffee futures had climbed to $3.089 a pound, a 35-year-high, before retreating late-week in trading. 

Starbucks reported a 20% increase in first-quarter profit, but the company was quick to justify retail price increases by adding that it expected input costs to trim its full-year 2011 earnings by at least 22 cents a share. 

Of course, of all the leading food commodities, coffee is the least essential to the average U.S. or global consumer, so the decision to pay those higher prices - at Starbucks, the grocery store or elsewhere - is largely discretionary. 

However, that's not the case with most other food commodity products - and the coffee concerns were amplified when the U.S. Department of Labor's Bureau of Labor Statistics issued its report on the March Consumer Price Index (CPI).

That report noted that prices for all consumer items rose just 0.1% in March, but prices for all food items jumped 0.8%, and prices for groceries (classed as "food at home") were up a full 1.1% - bringing the year-over-year increase to 3.6%. More alarming was the fact that the March food-price hikes came on top of respective increases of 0.5% and 0.6% in January and February.

Globally, The World Bank's Food Price Index remains near its all-time high, set in early 2008. The March numbers indicated food-price increases were running about 5% higher in poor and developing nations than in the developed countries. Regardless of the region, however, every key global food commodity was significantly higher than a year ago save for rice, prices for which were described as "stable." 

The World Bank also definitively linked the rising cost of energy to price hikes for food, saying that every 10% increase in the price of crude oil resulted in a 2.7% jump in the overall cost of food. 


Obviously, you hate to see the impact of such numbers on your grocery bill - but they certainly offer substantial incentive from an investment perspective. 

You simply cannot ignore the potential to capture single-contract gains ranging from $9,300 to as much as $65,025 for your futures portfolio. Even if the entry and exit timing was off by 20%, or even 30% - missing both lows and highs - nearly every food commodity produced upper triple-digit gains on the typical futures margin deposit for 2010-2011.

And, as noted earlier, prospects appear ripe for similar moves in the future - on both a short-term and a long-term basis.

A Short-Term Bounce in Agricultural Commodities
Short-term, food commodities have pulled back from last month's highs - largely due to profit-taking and sympathy selling in response to the downturn in the metals and oil prices. Even coffee, which didn't peak until May 3, retreated more than 20 cents a pound to close at 287.77 on Friday, May 6. 

Most analysts view these pullbacks as temporary, since there's been no real change in the fundamentals that supported the earlier price increases. That makes the current pullback a good buying opportunity.

In the corn market, for example, U.S. plantings for the week of May 2-6 came in at just 13%, the third slowest pace since 1986 and well below the 10-year average of 43%. Ohio, Indiana and Iowa reported respective plantings to date of just 1%, 2% and 8% of expected seasonal totals. The odds that farmers will close the planting gap are getting slimmer by the day, since large sections of prime U.S. corn-growing land are currently suffering either flooding or severe drought. That signals another weak yearly corn harvest, adding to last year's poor average yield of just 152.8 bushels per acre. 

Conditions are also bullish near-term in the cattle market, with many herds being pulled off drought-withered or fire-ravaged pasture land in Texas, New Mexico and Oklahoma and placed on feed, which will raise costs - and consumer prices. The arrival of the summer barbeque season and a forecast drop in gas prices could also conspire to increase consumer demand, sparking a general beef price rebound. 

According to Inside Futures, a leading commodity analytical service, pork fundamentals also remain unchanged from when prices soared to record highs last fall and again this spring.

And the coffee market continues to face the same fundamental support it did before its recent pullback - tight supplies due to poor harvests in several prime growing regions, coupled with rising demand in both developing and developed countries. As an example of continued growing demand, India saw its export orders climb 46.4% between January and April of this year, with most of its crop going to Italy, Russia and Germany. 

In short, the recent pullback in the food commodities should be viewed as a healthy retracement and a new near-term buying opportunity, not a major trend reversal.

A Long-Term Look at Agricultural Commodities
Longer-term, the outlook for food commodities is even stronger. The United Nations Food and Agriculture Organization (FAO) projects of an increase of 2.3 billion in the world population by 2050 - to more than 9 billion. Nearly all of that growth is expected to come from developing countries. This population growth will require a 70% increase in global food production, with needs in developing nations nearly doubling.

Given the dwindling availability of arable land on the planet, meeting this exploding food demand will require new farming techniques, new crop technologies, new types of seeds and fertilizers, a whole new approach to agriculture - if it's even possible. 

The FAO report estimates private investment of $209 billion a year will be needed just to keep the percentage of the world population that goes hungry at current levels. If world hunger is to be significantly reduced, that investment number must skyrocket to $359 billion a year.
This huge spurt of population growth will affect future food commodity prices in a number of ways. We'll face not just shrinking supply and steadily growing demand, but also, in terms of politics, territorial conflicts and control of distribution systems. 

Just this past weekend, U.S. Secretary of State Hillary Rodham Clinton addressed a meeting of the FAO at its headquarters in Rome, warning that global food shortages and spiraling prices could lead to widespread social unrest and political and economic destabilization. She urged immediate action to develop new policies aimed at preventing a repeat of 2007-2008 food riots that hit dozens of developing countries around the globe. 

Clinton also urged a united worldwide effort to hold down food commodity costs and boost agricultural production. However, she admitted food prices will continue to rise for the foreseeable future, citing the World Bank's report that its Food Price Index climbed 15% between October 2010 and January 2011 alone.

So given the huge projected increase in world population and the bullish price implications of steadily increasing demand for food commodities, how can you best take advantage of the investment potential the sector offers?

Investing in Agricultural Commodities Markets
Basically, there are three ways to invest in agricultural commodities markets.
First, if you have sufficient capital and a large tolerance for risk and volatility, you can invest directly in the futures markets, examining the fundamentals and technical outlook in greater detail and opting for the food commodities you believe hold the greatest potential.

Secondly, you can focus on the individual stocks of companies that either harvest or distribute basic foods and will benefit from rising demand, or companies that develop the new agricultural technologies and equipment needed to meet those demands. 

Three potential investment options include:

BRF-Brasil Foods S.A. (NYSE ADR: BRFS): One of the 50 fastest-growing international companies listed on U.S. exchanges, BRFS focuses on the production and sale of poultry, pork, beef, milk, dairy products and processed food. The company and its subsidiaries supply markets in Brazil and 140 other countries, including many developing nations. BRFS has reported steadily increasing quarterly profits since 2009, with earnings totaling 57 cents a share over the past 12 months. The stock, which pays a modest dividend giving a current yield of 1.29%, hit a high of $20.79 in late April, nearly double its May 2010 low of $11.35.

Deere & Company (NYSE: DE): If global farmers are to meet rising demand from developing nations, they won't do it with teams of oxen and wooden plows. Deere is the world's largest manufacturer of agricultural equipment - from plows and planters to tractors and harvesters. As such, it will get a big chunk of that projected $209 billion to $359 billion in required annual spending, adding to profits that already totaled $4.98 a share over the past 12 months. With the investment, you'll get a dividend of $1.40 a share (1.49%) and the wisdom of lots of analysts for institutions, which hold 73% of the stock.

Monsanto Company (NYSE: MON), recent price $65.27 - Just as Deere will benefit from rising global agricultural-equipment sales, Monsanto will profit from the need for new crop technologies. As one of the world's top developers and suppliers of seeds and herbicides, as well as research into agricultural biotechnology and hybridization (known as "genomics"), MON has a leading role in increasing global crop yields and improving farmland arability. The company's most recent 12-month earnings came in at $2.32 a share and its $1.12 dividend provides a yield of 1.69%.

Finally, perhaps the easiest way to gain access to a broad spectrum of higher food prices is through shares in one or more of the exchange-traded funds (ETFs) and exchange-traded notes (ETNs) that target agricultural commodities markets. 

Two of the top funds, plus one newcomer, include:

Market Vectors Agribusiness Fund (NYSE: MOO): This fund attempts to track the price and yield performance of the DAXglobal Agribusiness Index (DXAG), which is calculated by Germany's Deutsche Boerse AG, based on prices for the stocks of agribusiness companies whose shares trade on major international exchanges. Fund investments focus on five different sub-sectors, including agri-product and livestock operations, agricultural chemicals, equipment and ethanol/biodiesel. The fund, with a market capitalization of $3.75 billion, has a below-industry-average expense ratio of 0.55%.

E-TRACS UBS Bloomberg CMCI Food ETN (NYSE: FUD): FUD tracks the 13 agricultural food and livestock futures contracts included in the UBS Bloomberg CMCI Food Total Return index. While the fund focuses on near-term contracts, it smooths out short-term price volatility by investing in three different maturities for each individual commodity. The expense ratio is 0.65%, below the industry average, and the fund has $42.9 million in net assets.

Global X Food ETF (NYSE: EATX): The newest entry in the food ETF market (and on the ETF roster in general), EATX shares just began trading the first week in May. Geared solely around the consumption of food - including commercial fishing and fish farming - the fund attempts to mirror the performance of the Solactive Global Food Index, which tracks the 50 largest international firms with primary operations in production, development or distribution of food or food ingredients. Unlike the index, however, the fund will limit the holdings in any single company to 4.75% of assets, rebalancing every six months, and will also emphasize investments in firms serving the developing countries. Holdings include such giants as General Mills Inc. (NYSE: GIS), Kraft Foods Inc. (NYSE: KFT) and HJ Heinz Co. (NYSE: HNZ), but smaller companies from 17 countries round out the fund's portfolio. Initial capitalization was not announced, but the operators anticipate having an expense ratio of 0.65%. And, for those who like to mix social activism with their investing, Global X has promised that all profits from the fund will go to fight global hunger. 

Obviously, solutions to world hunger remain far in the future - but, if you put your money behind any of these food commodity-related investments, it's unlikely you'll wind up hungry for profits.

Cotton may be set for 'another bullish scenario'

by Agrimoney.com

Analysts have rated cotton as emerging among the best-supported crops, in pricing terms, from a slew of key US data, with Rabobank saying the fibre may witness "another bullish scenario".
The US Department of Agriculture, in its first estimates for 2011-12 crops released on Wednesday, pegged world output at 124.7m bales, a rise of 8.8%, enough to return the market to a production surplus and ease a squeeze on supplies which drove prices to record highs.
The data, reflecting a forecast of a record harvest in India, the second-ranked producer, fuelled a modest sell-off in New York futures which continued in the current session when New York's July contract fell 2.1% to 147.22 cents a pound, well below the record 227 cents a pound for a spot contract reached in February.
The new crop December lot shed 2.2% to 122.50 cents a pound.
Drought losses
However, a number of analysts questioned a downbeat interpretation of the data, given that the forecast included an estimate of hefty losses among US farmers to adverse weather, which has bought flooding to some areas of the South, besides drought to Texas, the top producing state.
The USDA forecast the domestic crop coming in marginally below last year's, despite a 16.4% rise in sowings, citing "above-average abandonment and slightly below-average yields due to severe drought conditions in the south west".
The drop means the US, the top cotton exporter by a margin, will "not be able to make up any potential production shortfalls elsewhere", as it has done this season, Rabobank said.
"In our view, the supply and demand outlook remains tight in the new season. Due to low inventories, if production estimates are not achieved, a return to another bullish scenario appears likely."
'Particularly bullish'
And the bank was supported by other analysts. Luke Mathews at Commonwealth Bank of Australia termed the estimates "somewhat bullish" for new crop cotton.
World cotton stocks still looked set end 2011-12 "relatively tight", at 40% of consumption, compared with a 55% figure in 2008-09.
Australia & New Zealand Bank said that "the report for cotton was particularly bullish".
"Given dry conditions in the US, the USDA is now projecting essentially no growth in US harvested cotton acreage on last year," the bank said.
"Global 2011-12 forecasts were also positive, with the USDA increasing mill use by 3m bales while only projecting production higher by 8.7% year on year."
The USDA estimates were also more downbeat, in production terms, than those last week from the International Cotton Advisory Committee, which estimated world output rising by more than 11%, to 127m bales.


Follow Us