Friday, March 11, 2011

The SPX Stocks Index Dances Between Danger and Excitement


Many readers might remember that exactly two years ago the S&P 500 tagged the infamous 666 price level before putting on a monster 2 year rally that saw it surge over 100% to the February 2011 highs. Investors today are staring at a rising wall of risk while corporate credit spreads remain bullish, corporations have been able to expand margins and produce increasing profits, and Federal Reserve Chairman Ben Bernanke has declared that there are no inflationary concerns. Quite frankly I am going to leave Ben Bernanke alone simply because so many other people will do a better job of declaring him incompetent and the creator of massive bubbles in risk assets, but I digress.


Right now investors have to weigh rising oil prices, geopolitical conflict in the Middle East, the threat of higher interest rates and inflation against the bullish backdrop discussed above. The price action in the broader market place is talking, but we have to listen with an open mind currently. There are two key price levels that are obvious when we look at a daily chart of SPX. First of all, the SPX 1331-1332 price level is acting as major resistance and holding the bulls in check. Should this level be breached to the upside on a daily close, we could see prices extend higher to test recent highs. The chart below illustrates the key upside level around 1331-1332. 

However, it is important to note the bearish wedge forming on the SPX daily chart. If price can push below the recent lows around 1294, we should see an extension lower to the 1260-1280 area before support comes back into focus. If we were to test the 1260-1280 price level, it is hard to say where price action could go. We could see an extension higher which pushes to higher highs or we could rollover and test the 1250 price level below. I will wait until we get confirmation in either direction before making any major assessment, but for right now those are the key levels for traders to watch. The chart below illustrates the bearish wedge located on the SPX daily chart.

My bias remains to the downside due to what I am seeing in the Volatility Index (VIX) and what I refer to as the “usual suspects”. The usual suspects include small caps represented by IWM, transports represented by IYT, and the financials represented by XLF/KBX. I look at all of these metrics daily in order to facilitate my view of the marketplace and where I expect price action to be headed. Of course I take into consideration other analysis metrics such as market internals and chart formations, but the crux of my daily analysis is derived from the analysis of the VIX and the suspects.

Take for example the Volatility Index (VIX) daily chart and it is obviously trending higher and is well above key moving averages. I believe that in the future we will see the VIX test the 200 period moving average and potentially breakout. The test I am sure about, the breakout remains to be seen. The key levels on the VIX are shown below:
 
IWM has a similar trading pattern as the S&P 500 index but at current price levels it is well off of the recent highs. It is also building a bearish wedge and I will be watching it closely to see which way it breaks. If IWM breaks down ahead of the SPX it is likely that the SPX will follow suit. The transports (IYT) have gotten banged up the worst as the rise in oil price negatively impacts the entire sector. Transports are also trading well below recent highs and also have a bearish wedge formed on the daily chart.

The financials (XLF/BKX) exhibit a bearish wedge but they also have head and shoulders patterns forming on their daily charts. Should price break the neckline we could see heavy selling pressure set in on the financial complex. Most regular readers know that I put a lot of emphasis on the price action in the financials (XLF) and as such should they breakdown the broader indices will move in tandem. The daily chart of XLF is listed below:
 
Interestingly enough the U.S. Dollar Index futures appear to have formed a short/long term bottom on the daily chart. It is obviously unknown whether this is just a bounce to work off oversold conditions or the beginning of a longer term move higher. The primary point for traders to consider is that a rising dollar could place additional selling pressure on the S&P 500, crude oil, and precious metals.

By now I’m guessing most readers are starting to get the theme here. We have bearish wedges forming on key indices, however that does not mean that they will follow through to the downside. We could see a failure and a breakout higher just as easily as a bearish breakdown, thus the reason why the key levels are so important on the S&P 500. I am going to wait for a clear breakout/breakdown and will accept directional risk on the broad indices at that point. Until then, I am not going to get involved in the daily chop.


China Housing Market Bubble Bust Could be Dubai X1000

By: MISES

Markus Bergstrom writes: It's an eerily familiar story. Shortly before the American housing bubble burst, pundits across the globe argued that the world had reached a new plateau of economic growth, where the old rules of economics no longer applied — "this time it's different." The same has been said about the current boom in China, specifically with regards to its large degree of top-down state control over the economy, which somehow enables it to ignore the laws of economics.
 
Indeed, this notion seems plausible according to traditional Keynesian aggregates. After all, China's GDP growth recovered in record time and at record pace from the global slowdown in 2008, hitting a staggering 10.7 percent toward the end of 2010. While some of this growth certainly comes from true economic development, a substantial portion is driven by monetary expansion, government "stimulus," and a massive, unsustainable real-estate bubble.

In 2008, in order to get back to postcrisis growth levels, the Chinese government prescribed a favorite statist remedy for times of economic hardship: monetary expansion. This was "necessary" in order to increase domestic investment and consumption, as well as to compensate for the slowing down in exports. In November 2008 the government also announced $586 billion worth of "investment" with the very same purpose.

However, when governments claim to be "investing" in something, one should always substitute it for "spending" or "printing money." As governments rarely spend money with the hope of reaping a profit, there's no way of knowing whether it was put to productive use or not. Even when profit-and-loss calculations guide these "investments," the capital still comes from forced taxation or inflation rather than voluntary savings. Thus it's still impossible to determine whether the money could have been spent on something better.

Hello, Anybody Home?

Well-known Austrian investor Jim Rogers has long played down speculations about a major Chinese bubble. He argues that while real-estate prices in some coastal cities are overheated, a cool-down of these would leave a slight dent on Chinese growth rather than result in a major slump. The rest of the country, he says, is "hardly in a bubble."

Another well-known Austrian investor, Doug Casey, is a lot more pessimistic, arguing that China "is in an unbelievable real estate bubble," which will cause "millions of Chinese — and the banks that lent them money — [to] lose everything."

There is certainly good reason to be concerned about China. A study conducted last summer by the Beijing University of Technology reported that a typical Beijing flat costs a staggering 22 times the average income in the city, while The Telegraph reported in December that the same figure for the city of Shenzhen is 18. On a national level, the Chinese Academy of Social Sciences (CASS) concluded last year that a typical Chinese property costs 8.8 times the average income. Compare this to just 5.5 in the United Kingdom in 2007 and 4 in 2009. In the United States, home prices peaked at a little over 5 times average income during its housing bubble, according to the S&P Case-Shiller Index.


A housing development in Ordos

As in the United States, the Chinese real-estate market is plagued by overconstruction, and not just in megacities like Shanghai, Beijing, and Shenzhen. Brand-new ghost towns have sprung up all across China in recent years, the most famous of which is perhaps Kangbashi in Ordos, Inner Mongolia. That city's housing capacity can currently accomodate well over 300,000 residents, yet only one tenth of that number actually live there. Numerous other lesser-known cities also boast swaths of high-rise apartments and majestic public buildings while appearing to be entirely devoid of residents.

Jim Chanos of Kynikos Associates claims that the new office space currently being constructed in China is enough to provide a five square-foot cubicle for every single citizen in the country. And that's just corporate real estate. 
Finance Asia reports that some 64 million homes and apartments across China have sat empty for the past six months, enough to house 200 million people — 15 percent of the country's entire population. Along the same lines, a study conducted in 2007 by the Beijing Union University found that 27 percent of all newly sold apartments in over 50 different residential areas in Beijing remained unoccupied.

Why, then, is this mad overproduction continuing? After all, such massive discrepancies between units produced and units actually inhabited should result in falling prices. However, most new real-estate developments are actually snapped up before they're even built. The buyers are usually speculators who refrain from even renting out the properties, hoping instead that they will yield even higher profits once flipped in pristine condition in the future. Bill Powell of Fortune recalls a neighbor in Shanghai who has bought a staggering 43 homes in just three years for this exact reason.

This absurd demand is in turn enabled by the aforementioned credit expansion. Officially, Chinese M2 grew by 58 percent between November 2008 and December 2010, while total bank lending (including informal lending) is said to have doubled in 2009 compared to 2008.


Monetary Aggregates for China (measured in 100 million Yuan)
Source: The People's Bank of China (Central Bank of China)

A contributing factor to the real-estate mania is that, to most Chinese, real estate is the most lucrative and (seemingly) the safest investment option available compared to the alternatives; bank deposit rates are below CPI inflation, domestic stocks and other equity have performed poorly in recent years (to say the least), and capital controls still prevent citizens from investing overseas.[1]

More than Meets the Eye

Of course, overproduction and overpriced property weren't the only factors behind the American financial crash. Another major ingredient was the house of cards that made up the American mortgage market, which, at first glance, looks considerably different in China. For example, the down payment requirement for first homes is 25 percent, while the same figure for second homes is 60 percent (up from 50 percent in November last year) — third homes and everything beyond that require all-cash financing. Furthermore, reserve requirements for major Chinese banks were raised to 19.5 percent in January, following several increases in 2010.

Yet these factors pale in significance when viewed against China's huge informal economy. For example, recent estimates by Fitch Ratings suggest that China's banks lent out some 30 percent more credit (informally) than the government-regulated target of 7.5 trillion yuan ($1.1 trillion) in 2010. This comes despite the major curbing efforts by the government, as well as the fact that the four biggest banks in China are all — ironically enough — state-owned.

Rather than reducing the cash flow, the tighter regulations have simply encouraged banks to get creative about their credit pumping. By repackaging and selling off loans to state-owned trusts and asset-management companies, banks have been able to keep their true lending at about the same levels as before while simultaneously staying below their official quotas. At other times, the banks have turned loans into investment products and sold them to private investors, much as American investment banks did during the 2000s.

The situation is not made easier by China's lack of property rights in land, all of which is owned by the government and leased out to private and state-owned companies through so-called land-use rights. In turn, the sales of these rights constitute a vital revenue stream for local governments, providing powerful incentives for them to help spur the real-estate boom. This adds another explanation to the ghost towns all across China. Many local governments will find themselves in economic peril as revenue dries up.

Some may point out that China has both higher household savings and less private and public debt than the United States, which will help soften the blow from a real-estate slump. This is true to some extent, but things are not as simple as they first appear.

For example, Ernst & Young estimated as far back as 2005 that the total bad debt held by China's banks was then close to $1 trillion. The number today is probably several times that, given the fact that lending has exploded in the last two years. Mortgage levels are also increasing rapidly: almost half of all residential properties sold in 2009 were funded by bank loans; in 2007 it was only 20 percent.

Another example comes from Professor Victor Shih of Northwestern University's 2009 study of China's public debt. He concluded that it is more likely to be somewhere around 40 percent of GDP, rather than the official 20 percent. Even the director of one of China's state-owned research institutes put the public debt at an estimated 50 percent last summer.

Hence both public and private debt could equal a substantial portion of China's $5.7 trillion GDP.

China's $2.8 trillion foreign-currency reserves will be of little help to recapitalize banks or prop up local governments, as these reserves would mostly be good in an external debt crisis, not a domestic one (among other things, trading in these reserves for yuan would cause the currency to appreciate sharply, damaging China's exports). And, for the record, the United States of the late 1920s also held massive foreign-currency reserves, as did Japan in the late 1980s.

China's gold reserves will be of even less help, as they only amount to about 1.7 percent of the foreign-exchange reserves.

Inflation or Stagnation?

It's obvious the bust will have an impact on sectors beyond real estate and construction. Some analysts even believe that China's GDP growth will drop to around 5 percent, i.e., half of its current level. Fitch Ratings and Oxford Economics recently did a study on what might happen if this came true. Among the main conclusions was a major economic slowdown in both developed and emerging economies in Asia, with GDP levels almost halving across the continent. The sectors most likely to suffer in China and elsewhere included steel, energy, and heavy manufacturing.

The report also predicts a 20 percent plunge in industrial-commodity prices following such a scenario, which would have serious implications for countries like Australia and Canada, both of which are heavily reliant on mining exports. This is of particular importance to Austrian investors and anyone else looking to such commodities and mining stocks as a hedge against looming American and European inflation.

In China, too, price inflation is a growing concern. The official number in late 2010 was 5 percent — a 28-month high. In reality, though, this number is likely to be far higher, as food prices alone jumped by an estimated 50 percent in Shanghai last year, even doubling in other parts of the country. Li Wei of Standard Chartered expects official price inflation to reach 8 percent just in the first half of this year, while Yu Song of Goldman Sachs expects it to go north of 10 percent.

In December last year the Politburo announced it would move from a "relatively loose" monetary policy to a more "prudent" one in 2011. Apart from destabilizing the economy, the government knows that high inflation can also trigger civil unrest. This was, for example, a root cause of the Tiananmen Square protests, where the official CPI jumped from 7.3 percent in 1987 to 18.5 percent in 1988, and then to 28 percent in early 1989. Then as now, there is growing unrest in China over soaring consumer prices, yet many people reluctantly accept it — just as long as the economic boom carries on.

Conclusion

China may very well become "Dubai times 1000," as Jim Chanos puts it, though the jury is still out on what the actual magnitude of the crash will be.

While the economic systems of China and precrisis America are certainly different, below the surface China is plagued by staggering levels of credit expansion, speculation, malinvestment, and toxic loans — much like what we saw in America. The notion that the iron-fisted Chinese government is in control of this situation is a dangerous one. The laws of economics are omnipresent and cannot be overridden simply by force. Trying to apply top-down central planning to an economy that is more and more driven by bottom-up market forces will inevitably have grave consequences. Wild credit expansion always leads to the same things: price inflation, malinvestment, and bubbles.

Stock Market Flash Crash Risk Assets, Bears Are Gaining Traction


Traders, money managers, and individual investors have numerous concerns relative to the ‘risk-on’ or inflation trade:

  • QE2 is set to be completed in June.
  • Spain’s credit rating was downgraded today.
  • Unemployment remains high.
  • Ongoing unrest in the Middle East.
  • Surging oil prices threaten the economic recovery.
  • Eye-popping budget and entitlement problems in the U.S.
In order to better understand the possible impact of the completion of QE2, we are in the process of studying the ‘flash crash’ period and the period following Ben Bernanke’s August 2010 Jackson Hole speech. Our work to date may help us better understand the risks of a continuing correction in today’s markets.  As outlined on March 3, the longer-term outlook for stocks remains favorable, but the short-term outlook is cloudy.

There were very few places to hide during the flash crash correction which kicked off on April 23, 2010. The pain for investors did not end until the S&P 500 had given back 13.20% before finding some footing on August 27, 2010. The table below shows a select list of ETFs that provided defensive cover during the dark days of 2010.


In the minds of market participants, the assets listed above were the safe havens of choice when the dial on the risk trade moved from “on” to “off”. On Valentine’s Day 2011, defensive assets began to show improving relative strength vs. the S&P 500. The flash crash winners highlighted in blue above have continued to draw increasing interest from buyers over the past four weeks (see relative strength charts below). The investments listed in the table above serve as a de facto shopping list should the current pullback morph into a full blown correction.


The relative strength lines of the VIX or the ‘fear index’ and utilities have moved higher in recent weeks, indicating increasing concerns about further downside in risk assets.
While relative strength is a term from technical analysis, the concept of buyers becoming more interested in defensive assets falls under the common sense category when it comes to risk management. Based on other concerns, we already hold the highest percentage of cash since late November 2010 as a way to reduce risk until the threat of continued downside subsides somewhat. In terms of current strategy, the increasing relative strength of defensive assets tells us:
  • Market participants are becoming increasingly nervous.
  • Further downside is possible.
  • To continue to monitor defensive assets.
  • To be open to raising more cash, based on the incremental approach, should conditions deteriorate further.
Increasing interest in bonds is not good news for stock and commodity investors.


For those not familiar with technical analysis, the green lines in the relative strength charts all have positive slopes, which highlight an increasing interest in defensive assets relative to the stock market in general.
Gold’s safe haven status appears to be intact.

It is not time to panic relative to the possible continuation of the current correction, but we are happy we have taken some profits off the table in recent weeks. The defensive assets shown above will continue to help us monitor the risk tolerance of market participants, who ultimately determine the value of our portfolios. 

Corporate bonds and stocks in Malaysia held up well during the 2010 flash crash correction. Buyers are again showing interest over the last few weeks.


Commodity Snapshot

by Bespoke Investment Group

With oil surging into the $100s and then pulling back $3 today, we feel that now is as good of a time as any to publish our commodity trading range charts.  In each chart below, the green shading represents between two standard deviations above and below the 50-day moving average.  Moves above or below the green shading are considered overbought or oversold.

As shown, even after today's pullback, oil remains at the very top of its trading range.  Even a pullback to $90 would only put oil in the middle of its trading range.  The other energy commodity shown -- natural gas -- is at the bottom of its trading range, which is nothing new. 

Like oil, both gold and silver are down a bit today, but they are still right at the top of their trading ranges as well.  The other precious metal -- Platinum -- hasn't done nearly as well as gold and silver lately, and it is closer to the bottom of its range than the top.

Copper had been trading in a very nice uptrend, but just recently it has taken a big turn for the worse.  After forming a head and shoulders pattern, copper has now broken key support and is trading into oversold territory.  Wheat is also now trading into oversold territory.  Coffee, on the other hand, continues to soar.


China inflation tops expectations, paves way for more


(Reuters) - Chinese inflation topped expectations in February at 4.9 percent and looks set to climb further in coming months, adding to pressure for another dose of monetary tightening.
But data published on Friday also offered tentative signs that the government was making some headway in taming price rises without inflicting undue harm on growth in the world's second-largest economy.

Consumer inflation steadied in February at the same level as in January, the National Bureau of Statistics said. Although above forecasts for 4.7 percent, the 4.9 percent reading contrasted with dire warnings a few months ago of runaway prices. Core inflation, stripped of volatile food costs, slowed.

Though far too soon for Beijing to declare victory in its battle against inflation, the stabilization suggested that it was more than midway through a sustained tightening campaign launched nearly half a year ago.

People's Bank of China Governor Zhou Xiaochuan struck a guardedly optimistic note.

"If we observe the CPI (consumer price index) figures for December, January and February, although they are high, inflationary expectations are currently relatively stable," he said at a news conference during China's annual session of parliament.

Nevertheless, worries that further increases of Chinese interest rates and reserve requirements were inevitable -- and potentially imminent -- weighed on global markets, which were already reeling because of weak U.S.

economic data and unrest in Saudi Arabia. Asian equities added a touch to losses on the day, and the Shanghai stock market had dipped 0.2 percent as of 0515 GMT.

"Clearly, the consumer price index is stabilizing, but the risk is still significantly on the upside," said Wei Yao, economist with Societe Generale in Hong Kong. "It means the central bank will probably stay on the course of tightening," she added.

INFLATION A PRIORITY

Industrial output in the first two months of 2011 rose 14.1 percent year-on-year, picking up from a 13.5 percent pace in December and vaulting past market expectations of a 13.3 percent increase.

Investment was also robust, up 24.9 percent year-on-year in the first two months, topping forecasts for a 23.3 percent rise.

The broad strength reflected Beijing's balancing act in managing the economy this year. While restricting the flow of cash with monetary policy, the government is once again spending lavishly on infrastructure projects and, especially, the construction of public housing to keep growth humming along.

China's top leaders have declared that their priority this year is to control inflation. So far, complaints about rising prices have amounted to little more than grumbles, but serious inflation has sparked social unrest in China in the past.

To meet the official goal of keeping inflation to a 4 percent average this year, the government has raised interest rates three times and banks' reserve requirements five times since October, while also using a series of direct controls to cap price rises.

The next round of tightening may be just around the corner.
"The higher-than-expected CPI may push the government to raise interest rates or the reserve requirement ratio in March," said Liu Dongliang, analyst with China Merchants Bank in Shenzhen.


Reflecting the surge in global commodity costs earlier this year, producer price inflation jumped in February to 7.2 percent from 6.6 percent a month earlier.


LENDING CONTROLS


The most important part of Beijing's tightening efforts has been reining in banks, which unleashed a torrent of credit over the past two years, swamping the economy in cash.


Reports in official media have said that new loans in February were slightly above 500 billion yuan ($76 billion), a steep drop from January and considerably less than expected. If confirmed, that would suggest that China has finally gained traction in controlling the excesses of banks.


In a statement on Friday, the Chinese central bank said it would ensure that there is an "appropriate" amount of liquidity in the economy this year, guiding credit growth at a reasonable pace.


Zhou, the central bank governor, poured cold water on the suggestion that faster currency appreciation would help China control inflation. At the margins, it would be useful, but China is a continent-sized economy and so the exchange rate plays a more minor role than in small, open economies, he said.


For all the signs of progress in taming inflation, it is notoriously difficult to interpret Chinese economic data at the start of the year. Many businesses shut their doors or run at half speed for weeks because of the Lunar New Year, which fell in early February this year.


A reminder of the distortions this causes came on Thursday, when data showed that China had recorded its largest trade deficit in seven years in February. That helped fuel a sell-off in global markets, but economists said the country was likely to return to a chunky surplus over the rest of the year.

See the original article >>

BILL GROSS SELLS US GOVERNMENT BONDS – DOES IT MATTER?

by Cullen Roche

Bill Gross, the founder of PIMCO, made waves this week by selling his holdings of US Treasuries.  Bloomberg reported on the dramatic news:
“Bill Gross, who runs the world’s biggest bond fund at Pacific Investment Management Co., told PBS this week that yields are too low. His $237 billion Total Return Fund held no government-related debt as of Feb. 28, according to a report on the Pimco website.”
That’s dramatic.  After all, Mr. Gross says the Fed is now helping the US government implement a ponzi scheme.  He also believes QE is helping to dramatically reduce rates.  He says the end of QE2 will be a “d-day” for the bond market.  Those are comments that you’d certainly want to take notice of considering this is the largest bond manager in the world, right?  Not necessarily.  Unfortunately, this isn’t the first time Bill Gross has sounded the alarm for the U.S. bond market.

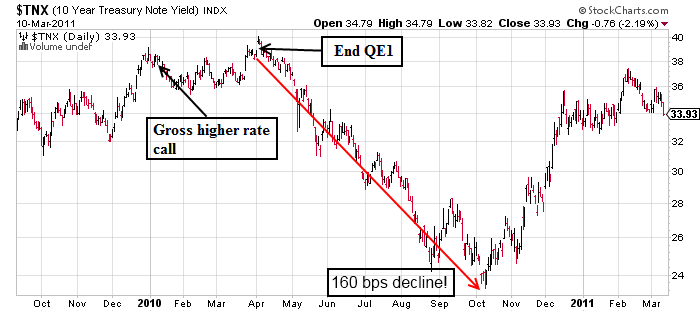
In early 2010 he was interviewed by TIME magazine about the economic outlook.  Mr. Gross was asked about the end of QE1 and how it would impact rates.  He answered:
Won’t that (the end of QE1) put upward pressure on interest rates?
“I think it will. I mean, the mortgage market would be your first place to look, in terms of something that’s overvalued that would become normalized. Nobody knows what the Fed’s buying is worth — we think about half a percentage point on rates, but we don’t know.”
What happened when QE1 ended?  Rates did the exact opposite of what Mr. Gross expected.  In fact, they went into a tailspin.  He top ticked it to the day:
I am not sure there is much, if anything, that we can read into this move by Mr. Gross.  He has been talking about some form of bear market in bonds for over 10 years now.  In 2004 PIMCO declared: “We are at the end of the secular bull market in bonds.”  In a 2001 letter Gross declared the bull in bonds over, but said opportunities would continue.  In a 2007 interview he referred to himself as a “bear market manager”. Inbetween these calls he has consistently maintained a very healthy holding in fixed income and US Treasury correlated assets.

So, do the current opinions about “d-day” and the end of the bond bull market matter?  Yes, as much as the (ever changing) headline grabbing opinions of the last 10 years….

See the original article >>

Follow Us