Wednesday, February 9, 2011

Base Metals turn hot commodities in China

by Commodity Online

China has turned out to be the global nerve centre for base metals. Surging demand from China for base metals like copper, zinc, lead and aluminium is helping the commodities output to grow at unprecedented levels.

According to Barclays Capital, in 2010 while the base metals output from China soared at record levels, the growth phase for these commodities is going up in 2011.

“For many of the metals, the strength in domestic raw material production resulted in a reduction in the proportion of imports used in refined metal production,” Barclays said in a recent research note.

“How sustainable this trend proves to be will be a key factor behind relative price performance.” In the case of copper, Barclays says it looks for slower but still strong growth in domestic output, although not enough to dent the need for imports.

For tin, it may be difficult to replicate last year’s supply growth since much was due to improved efficiency at existing mines and recovery of tailings.

For lead and zinc, an increase in 2010 output was due to small mines running at full speed, but current mines are facing a declining ore-reserve base, so strong growth will depend on factors such as investment in large mines.

Barclays said: “Overall, the impact on prices and market balances of slower Chinese base-metals production growth will depend on how this is counterbalanced with slower demand growth, with lead and zinc the metals where this will be a key swing factor for 2011.”

The bank further said that Chinese demand for base metals will grow in 2011, assuming there is not an “over-tightening” of monetary conditions.

The People’s Bank of China has said that it will raise interest rates for the third time since mid-October, with the one-year yuan lending rate moving to 6.06% from 5.81%.

“China raised rates from 2004 to early 2008 without interrupting the upward trend in prices. In our view provided there isn’t an over-tightening, then Chinese base metals demand will still be on track for another year of strong, albeit slower, growth,” Barclays said.

Continue reading this article >>

How High (or Low) Could the Stock Market Go?

By CHARLES HUGH SMITH
 
The U.S. stock market has been on a tear since September, gaining more than 20% in a mere five months. For perspective, annual equity returns average about 5% over the long run.

That means the market has logged four years of average gains in only five months. And it raises the question: What's next for the U.S. markets, not just next month, but in the next year or two?

The bullish case is well established: The economic recovery is solidly advancing, corporate profits are still rising, inflation is low and some evidence shows companies are starting to hire again.

Let's look at a 10-year chart to identify the bullish targets for the Dow: 13,000 and then 14,000.


Chartists have long noted that long-term tops often form what is called a "head and shoulders" pattern in which lower "shoulders" precede and follow the peak or "head." This pattern is clearly visible in the Dow's 2007-2008 top and decline.

The sharp 84% rise from the March 2009 low has brought the Dow back above the 12,000 level and into a band of resistance and potential support around 11,900 to 12,200. The next stop for the bulls is 13,000, the left shoulder on the chart above, last touched in 2008. Beyond that, the next goal is the 14,000 level that marked the 2007 top.

From the view of a 10-year chart, we can see that this advance from 6,500 to 12,170 has been meteoric compared to the more leisurely recovery from 2003-2006, when it took about four years for the market to advance from 7,600 to over 12,000. This suggests that the past two years have been extraordinary rather than typical, and so we might expect more typical returns in the years ahead.

What's Typical?
You'd think figuring out what "typical returns" are would be a relatively straightforward calculation, but -- as with many things financial -- it turns out to be complicated. Some calculate long-term annual returns of around 7% , and others estimate 6.5% as a reasonable expectation for total returns, or dividends plus appreciation/growth. Yet other careful analyses reckon that a return of roughly 4.1% is more realistic.
Why is it so difficult to assess mean returns over the long term? Economists Eugene Fama and Kenneth French have shown that the uncertainties of expected returns don't diminish over long time frames, so the uncertainties of 30-year and 50-year returns are higher than shorter-term yields. In effect, the uncertainty over two years is four times the uncertainty over one year.

Calculating long-term returns and mean returns turns out to be an inherently iffy proposition. "In particular, we don't know the true expected returns on portfolios," Fama wrote in an investment forum in 2009. "We typically use historical average returns to estimate expected returns, but the estimates are quite noisy, and they leave lots of uncertainty about true expected returns."

In other words, projections using average annual returns are guesstimates because historical returns aren't reliable guides.

To put this truism into perspective, let's turn to some longer-term charts showing the Dow, from 1977 to the present, and the broad-based S&P 500 index , from 1965 to the present.


We can see that stocks really took off in 1995, and made an unprecedented ascent in five short years to the dot-com top in 2000. In the Dow, this top marks what could be a left shoulder in a multiyear topping pattern, with the peak reached about seven years later in 2007 tracing out the head. If this pattern holds, then the current rally may be the right shoulder.

Alternatively, the Dow might reach for the 14,000 level, and either form a double top there or move on to new heights.

The S&P 500 has already traced out a multiyear double top, with the first peak in 2000 and the second in 2007.

A Return to the Long-Term Average

One tool statisticians use is the " regression (or reversion) to the mean ," which refers to the probability that extremes of activity or response tend to revert to the long-term average.

This suggests that any period of extreme outperformance, such as the past 22 months, will be followed by lower and more average returns.

We can estimate the mean return in several ways. On the charts, I took 2% above inflation as a baseline return. At this rate, $1 invested in 1989, six years into the great 1982-2000 Bull Market, would have grown to $1.52 in 2010. A dollar in 1989 now equals $1.76 in 2010 dollars , so I've multiplied our return by 1.76 to adjust for inflation.

By these calculations, the Dow should be around 5,300 and the S&P 500 should be about 800.

If we forget inflation and just plug in an annual mean return of 6.5%, then the S&P 500 should be about 1,125. If we go with a 5% mean return, then the S&P 500 should be around 835.

A Safe Bet, If. . .

Author and analyst Jeremy Siegel found that since the early 1800s, equities had never offered a negative return , after inflation, if held for 17 years or more. That suggests stocks are a safe bet for long-term investors, if they can handle short-term volatility.

Technically speaking, these long-term charts suggest that stocks entered an unusual period of outperformance in 1995 that will eventually end as returns revert to longer-term averages. Nobody knows what those averages will be, but we can look to history from some guidance, and to charts for possible future outcomes.

 
Continue reading this article >>

THE FED IS NOT MONETIZING THE DEBT

by Cullen Roche

The Fed’s purchases of treasuries continue to attract a huge amount of attention.  Despite solid evidence that the program is failing to have any real fundamental economic impact there are other worries about the program.  None has been more apparent in recent weeks than the Fed’s supposed monetization of the US government’s debt.  These fears of monetization are unfounded due to the various myths that are perpetually touted by the mainstream media, supposed experts on the US monetary system and even Fed officials.

In an article Monday, Bloomberg reported that the Fed has been buying an exorbitant proportion of the recently issued treasury debt:
“More than 40 percent of the government bonds the Fed bought in January for its so-called quantitative easing were auctioned in the previous 90 days, up from 20 percent in December and 15 percent in November, according to Bank of America Merrill Lynch. The central bank is concentrating on newer securities as its $600 billion program depletes primary dealers’ holdings of Treasuries to the lowest since November 2009.”
Why does this matter?  Because it gives the appearance that the US government is directly funding itself via the Fed’s purchases.  This would be nefarious if it were true and would give credence to the endless complaints about the high rate of inflation in the USA (which is currently running at a staggering 1.5%-2.25% depending on the source).  Fortunately, the concerns are unfounded.

When the US government was working under the gold standard the US Treasury would literally print up certificates to purchase gold from the gold mines.  These gold bars would be delivered to the government and the Treasury would issue a check to the miner.  This new money would end up at the Federal Reserve Bank in the form of deposits.  This would naturally increase the money supply.   An increase in the money supply is scary for obvious reasons.   So, the term debt monetization has its origins in the days of the gold standard, but persists to this day despite the fact that we are no longer on a gold standard.  Not surprisingly, the term is still used today despite the fact that the US government can’t monetize its debt via Fed purchases (I elaborate below).

This issue was magnified yesterday when Richard Fisher of the Dallas Fed invoked the evil “debt monetization” term in his speech:
“the FOMC collectively decided in November to temporarily undertake a program to purchase U.S. Treasuries that, when added to previous policy initiatives, roughly means we will be purchasing the equivalent of all newly issued Treasury debt through June.  By this action, we have run the risk of being viewed as an accomplice to Congress’ fiscal nonfeasance. To avoid that perception, we must vigilantly protect the integrity of our delicate franchise. There are limits to what we can do on the monetary front to provide the bridge financing to fiscal sanity. The head of the European Central Bank, Jean-Claude Trichet, said it best recently while speaking in Germany: “Monetary policy responsibility cannot substitute for government irresponsibility.”
The entire FOMC knows the history and the ruinous fate that is meted out to countries whose central banks take to regularly monetizing government debt. Barring some unexpected shock to the economy or financial system, I think we are pushing the envelope with the current round of Treasury purchases. I would be very wary of expanding our balance sheet further; indeed, given current economic and financial conditions, it is hard for me to envision a scenario where I would not use my voting position this year to formally dissent should the FOMC recommend another tranche of monetary accommodation. And I expect I will be at the forefront of the effort to trim back our Treasury holdings and tighten policy at the earliest sign that inflationary pressures are moving beyond the commodity markets and into the general price stream. I am a veteran of the Carter administration and know how easily prices can spin out of control and how cruelly markets can exact their revenge. I would not want to relive that experience.”
Fisher’s implication is that the Fed is directly helping to fund the US government’s spending.  After all, if they’re buying the debt then they’re obviously funding the spending, right?  Wrong.  As regular readers know, the US government is never constrained in its ability to spend.  Our monetary system underwent a dramatic change when Richard Nixon closed the gold window. It removed any constraint on the US government’s ability to spend.  Nonetheless, the operating structure of the gold standard (issuing bonds, etc) still largely remained intact.

The issuance of bonds continues to this day due to Congressional mandate.  In reality, our bond market funds nothing and serves only as a reserve drain which helps the Fed maintain its overnight target interest rate.  It has nothing to do with funding the government.  When the US government wants to spend money they do not call China and ask for a line of credit.  They do not count tax receipts.  And they most certainly do not call the Fed to ensure that we have any money left.  No, the truth is that the USA never really has nor doesn’t have any money.  So the entire implication that the Fed is helping to fund US government expenditures is entirely inaccurate and anyone who implies as much is still working under the now defunct gold standard model and clearly doesn’t understand the workings of the modern monetary system.

For a brief instant, Mr. Fisher appears as though he is on the verge of understanding the system he now heavily influences as a new voting member of the FOMC.  Mr. Fisher says that the spending effectively comes first:
“But here is the essential fact I want to emphasize and have you think about today: The Fed could not monetize the debt if the debt were not being created by Congress in the first place….The Fed does not create government debt; Congress does.”
Lights should be going off in Mr. Fisher’s head at this point as he says this.  This is important because Mr. Fisher is essentially acknowledging that the Fed is not the entity that actually conducts helicopter drops.  Of course, spending comes before debt issuance.  It can be no other way in a monetary system such as ours.  The Fed’s role in this process is purely monetary.  It has nothing to do with the fiscal side.  The Fed does not “print money”.  Congress is the entity that prints money via deficit spending.  And they always decide how much to spend before considering any potential constraint from taxes or bond issuance.  Unlike a household or state the US government does not need money before it spends.  From a common sense perspective, you would think that this would set alarms off in most people’s heads, however, it does not.  The idea that the US government is never revenue constrained is so foreign to most people that their minds repel it.

By now you might be thinking that this is all semantics.  Who cares if the Fed isn’t helping to fund the spending?  They’re still buying the bonds and the spending is occurring regardless of the Fed’s actions.  Well, it’s important for several reasons:
1) Someone who understands the modern monetary system understands that a sovereign government with monopoly supply of currency in a floating exchange rate system has no solvency issue.  Therefore, it should not be treated as if it is a household, business or state.
2) If solvency is not a concern then clearly the concern is inflation or potential hyperinflation.  But as we’ve seen over the last few years the Fed has not succeeded at creating inflation anywhere close to the historical average and certainly not dangerously high levels of inflation.  To someone who understands how the modern monetary system functions it not surprising then, that the Fed has been unable to generate inflation during a balance sheet recession.
3) Fear mongerers want you to believe that the Fed is the evil entity that “prints money”.  The truth is that the Fed can do no such thing.  Only Congress can print money and it’s clear that their actions in recent years have failed to generate significant inflation.  This is a sign that the government’s spending has been ineffective and misguided.  Although I acknowledge that the US Congress is never constrained in its ability to spend this by no means implies that the US Congress should spend beyond its means.  To do so can possibly result in malinvestment or very high inflation.
4) The idea that the Fed is buying government debt might imply that there are is a shortage of buyers of US debt.  This is impossible as government debt issuance serves only as a reserve drain.  Auctions are designed around calculated reserves and are carefully designed so as not to fail.
5) Voting members of the FOMC do not understand the actual workings of the Federal Reserve System and the US monetary system and have played a direct role in the misguided policy response in recent years.  Of course, this is nothing new.  This problem has persisted throughout the entirety of the last 40 years and is largely to blame for the structural flaws in the US economy currently.
6) The overwhelming majority of US citizens have no idea how the US monetary system actually functions and therefore are reluctant or unable to force any sort of real change.  Those with political or monetary motivations tend to invoke fearful language that incites anger and in truth only adds to the problems in the US economy by driving the voter base to react to their emotions and not their knowledge of the system in which they reside.
7) Quantitative easing does not increase the money supply and is therefore not inflationary.  Although this operation can have significant psychological impacts (such as inducing undue speculation) QE can only work in the same manner that traditional monetary policy is implemented at the short-end of the curve.  This occurs by setting a target rate and by being a willing buyer of any size at that rate.  This is NOT how the current policy is designed.  The current structure of QE leaves interest rates entirely controlled by the marketplace and not the Fed.  Therefore, the mixed results should come as no surprise to anyone as the policy was poorly designed to begin with and is likely doing little more than contributing to excessive speculation and promoting the continued financialization of the US economy.  The Fed’s implementation of such policies (such as QE) and complete misunderstanding of such policies does nothing but help create disequilibrium in the marketplace and increase the odds of future instability.
8 ) Monetization is achieved by act of Congress via deficit spending and is independent of the Fed’s monetary policy.  Anyone who uses the term in the context of the Fed’s contribution of government spending does not understand how the modern monetary system works.  In a strict technical sense, monetization is always done by act of Congress and is voted on before funding is ever acquired for such expenditures – funding that will always be available regardless of tax receipts or bond sales….
Continue reading this article >>

THE CENTRAL BANK IS CAUSING INFLATION

by Cullen Roche

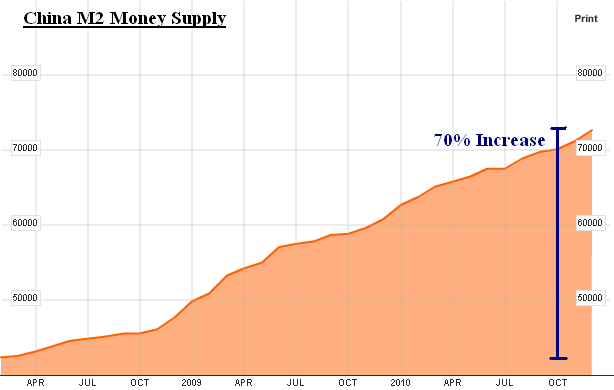
For years now we’ve been hearing stories about how the US central bank was going to expand its balance sheet and reserves would fly out of banks like they were being dropped from helicopters and hyperinflation would quickly ensue.  Of course, no such thing happened, however, we did see a remarkable increase in the money supply.  No, not the US money supply, but the Chinese money supply.

Two years ago I said the Chinese were venturing into dangerous territory with a massive stimulus plan that was likely unnecessary and excessively large.  I believed it had the real potential for an inflation scare in China.  Two years later that appears to be the case.  And we need look no further than the money supply to put this into perspective.  Over the course of the last three years the Chinese M2 money supply has skyrocketed higher by over 70%:
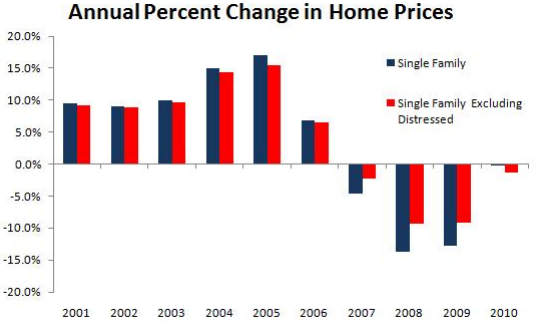
Given the extraordinary actions of the Fed in recent years you might assume that the USA has an equally awful looking situation.  But the evidence simply doesn’t support such a conclusion.   The USA’s M2 money supply has expanded by a meager 16% over the last three years.  That’s a 5% increase per year during one of the most destructive recessions the USA has ever experienced.  Broader measures of the money supply show that the M3 supply is still contracting (see Shadow Stats or nowandfutures.com for some perspective).  This is not to say that the Fed has not encouraged imprudence, speculation and no loser capitalism, but if high inflation is their goal it’s difficult to say that they have succeeded.  After all, inflation in the USA is running at 1.5%-2.25% depending on your source.
China has vowed to combat inflation, however, there are little to no signs that they are serious about tackling the issue.   After all, they have elections coming up and a national target of 8% GDP growth that you can be certain they will maintain at any cost.  Even if it means rapidly increasing inflation and ensuing commodity price increases that only hurt the rest of the global economy.

Continue reading this article >>
THE COMMODITY BUBBLE

By Surly Trader

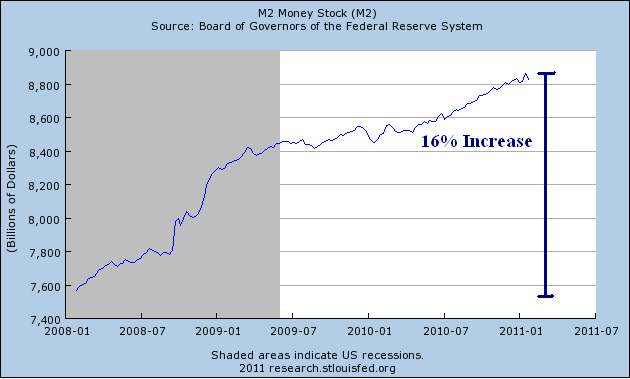
In the future they might coin this the “Bernanke Effect” or maybe the great commodity bubble of 2011.  The truth is that commodity prices are rising…dramatically.  You might have started to notice this disconnect in your grocery store shopping or in gasoline prices, but if you were to ask our government they would tell you that a basket of goods consumed (CPI) is rising modestly.  How modest do these numbers appear to you?
If the basic ingredients to food are skyrocketing, then prices of food will eventually have to keep pace which will directly hurt consumers.

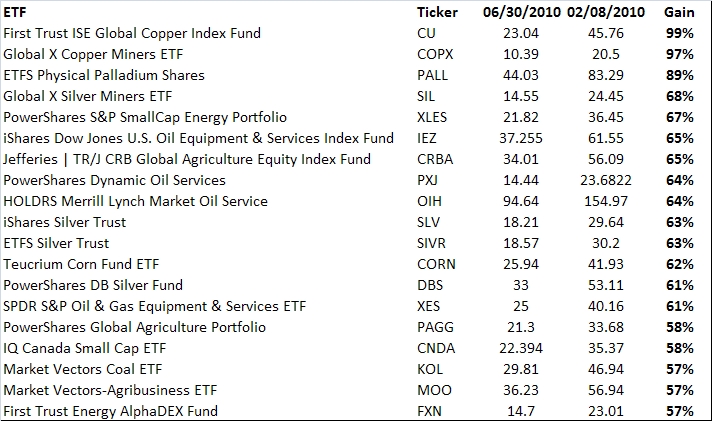
Of the 853 ETF’s that I looked at, which unleveraged funds do you think had the greatest return over that same time period?  It is not a trick question:
My conclusion is simple:  this time is NOT different.  Commodity prices cannot go up forever and China will not continue to support the market regardless of prices.  What is this “Bernanke Effect” doing to farmland prices?  Well, according to a survey by Farmer’s National Company:
“non-irrigated crop land in central Kansas averaged $3,000 an acre, up 50 percent since June
Crop prices have seen an extraordinary run since early July. A bushel of wheat priced about $4 a bushel on July 4 is now more than $8.50. Other crops have experienced similar increases.
As the land generates more income, it puts more cash in the pockets of the most likely buyers, nearby farmers. It also provides an attractive return for investors who then rent it out to farmers.
The result: Auctions are drawing twice the number of bidders as before, said area agents.”
As with all hot speculation, the commodity run will surely come to an end and will probably have repercussions for all financial markets.  We should have learned by now that large financial dislocations tend to not occur in isolation.

Continue reading this article >>
HOME PRICES CONTINUED TO DECLINE IN DECEMBER

by Cullen Roche

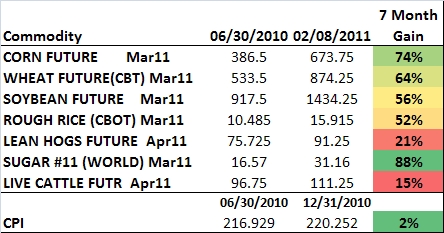
The latest housing data from Corelogic showed continued declines in US residential real estate.  According to their most recent data the national average price for single family homes fell by 5.46% compared to December 2009.
“CoreLogic (NYSE: CLGX), a leading provider of information, analytics and business services, today released its December Home Price Index (HPI) which shows that home prices in the U.S. declined for the fifth month in a row.  According to the CoreLogic HPI, national home prices, including distressed sales, declined by 5.46 percent in December 2010 compared to December 2009 and declined by 4.39 percent* in November 2010 compared to November 2009.  Excluding distressed sales, year-over-year prices declined by 2.31 percent in December 2010 compared to December 2009 and declined by 2.81* in November 2010 compared to November 2009.  Distressed sales include short sales and real estate owned (REO) transactions.
Annual data for 2010 shows home prices stabilized with the average annual HPI index showing no change  relative to 2009.  That compares to a 12.7 percent decline between 2008 and 2009.  The stabilization in  annual prices follows double-digit declines in 2008 and 2009 and is a sign that the largest declines are  over.  According to Mark Fleming, chief economist with CoreLogic, 2010 was a year of ups and downs as a  result of the improvements brought on by the tax credits followed by the declines that occurred when they expired.  “It was a bumpy ride which ended with a net gain/loss of zero.  Despite the continued monthly  decline in home prices and year-over-year depreciation, we’re encouraged that on an annual basis we’re  unchanged relative to a year ago.  Excess supply continues to drive prices downward, but the silver lining is  that the rate of decline is decelerating,” he said.”

Continue reading this article >>
Follow Us