Friday, May 31, 2013

Data signal soft economy but not abrupt slowdown

By Lucia Mutikani

A woman goes down an escalator at a Toys R Us store in New York, December 14, 2010. REUTERS/Shannon Stapleton

WASHINGTON (Reuters) - U.S. consumer spending fell in April for the first time in almost a year and already low inflation declined further, undercutting arguments for a tapering of the Federal Reserve's bond-buying stimulus.

Despite the energy-driven pullback in consumer spending last month, the economy is not slowing abruptly. Consumer sentiment approached a six-year high in May and factory activity in the Midwest regained speed this month, other data showed on Friday.

While this suggests the economy is squeezing out of a soft patch hit early in the second quarter, the strength might not be sufficient for the U.S. central bank to start scaling back the $85 billion in bonds it is buying each month.

"Any decision to slow the pace of bond purchases before the end of summer will likely be reduced at the margin, particularly given the benign inflationary backdrop," said Millan Mulraine, a senior economist at TD Securities in New York.

Consumer spending fell 0.2 percent, the weakest reading since May last year, the Commerce Department said. Consumer spending, which accounts for about 70 percent of U.S. economic activity, had edged up 0.1 percent in March.

Economists had expected a 0.1 percent gain last month.

But when adjusted for inflation, spending nudged up 0.1 percent last month after rising 0.2 percent.

The sixth straight month of gains in the so-called real consumer spending came as a price index for consumer spending fell 0.3 percent, the largest drop since July last year. It was the second straight month of declines in the index.

Over the past 12 months, inflation has slowed to just 0.7 percent, the weakest since October 2009 and pushing further below the Fed's 2 percent target. The price index had increased 1 percent in the period through March.

A core price index, which strips out food and energy costs, was up 1.1 percent in the past 12 months, compared with a 1.2 percent rise in March.

The tame inflation readings come on the heels of Fed Chairman Ben Bernanke's remarks last week that a decision to start tapering the $85 billion in bonds the Fed is buying each month could come at one of its "next few meetings" if the economy appeared set to maintain momentum.

The economy has shown some resilience, despite belt-tightening by Washington, helping to prop-up consumer confidence.

The Thomson Reuters/University of Michigan's final reading on the overall index on consumer sentiment rose to 84.5 from 76.4 in April, a separate report showed. It was the highest level since July 2007.

Manufacturing, which has been hit by belt-tightening by Washington, is also showing signs of recovery.

In a separate report, the Institute for Supply Management said its Chicago business barometer rose to 58.7 from 49 in April, handily beating economists' expectations for 50. A reading above 50 indicates expansion in the regional economy.

The gains were driven by a pickup in new orders and a jump in the employment measure.

See the original article >>

Big Bond Sell-Off

By tothetick

Many have been predicting it to happen for ages now, and it’s finally on according to Goldman Sachs. Yields on government bonds have been increasing over the past few weeks and the sale of the century is about to begin. The bond sell-off is here, guys and girls!

It’s better to make a move from long-duration bonds and avoid losses that might be heavy.

10-year bonds have increased by 10% in just the last week and now have stabilized at 2.0745% today. Everything is on the up at the moment. Japanese bonds (JGBs) have taken a hike upwards, hitting the 1% mark. The Bank of Japan had already made the promise that they would do everything in their power to take the necessary action to stabilize the volatility of the bond market. German 10-year bonds have done the same too. 10-year treasury yields in the UK are also predicted to rise by 2.3%.

The advice is: if you are holding too many bonds and that’s long-term bonds then the crunch will come unless you off-load them now.  There needs to be a change of track and tactics right now if you are not going to get caught in that crunch.

Higher yields are the result of pessimistic growth targets in the US and elsewhere, as well as fear that the Federal Reserve will curb asset-purchasing. Finally, Abenomics and Japanese QE methods have had their role to play in the move towards higher yields.

Federal reserve Chairman, Ben Bernanke, freaked economists and traders out last week and caused wary market reactions in the face of the revelations that the Federal Reserve would scale back on the central bank’s monthly $85-billion asset purchases. The suggestion was that it was going to happen as early as June.

This might become reality as consumer confidence in the US is on the up and also house prices are increasing somewhat. Confidence figures in May increased to 76.20% from 69% in April 2013. The Expectations of US citizens increased also from 74.3% last month to 82.4%. It looks like Bernanke will have every reason to curb that asset purchasing. Confidence has never been higher in the past five years. The outlook for the next six months also looks good in terms of consumer confidence (with a rise from 17.2% to 19.2%).

We all knew that printing dollars wasn’t going to be the long-term answer. Now, that prediction is becoming reality. Short-term printing works, keeps you afloat for a bit. Now, the US is ready to sink a bit, maybe. The Federal Reserve is going to have to sell those bonds back and that means bad news for your portfolio. When the Federal Reserve starts that sale, you can bet your bottom dollar (and it may just be the bottom one unless you get out now, and double quick) that prices will plunge and bring you down with it. Poo-poo it if you like. It’ll happen, and you know it, there’s no point sticking your head in the sand.

See the original article >>

Double Top in the NYSE now in place, with Margin debt sky high?

by Chris Kimble

CLICK ON CHART TO ENLARGE

The NYSE made an important high 5 years ago this month and then proceed to waterfall in price. Now the rally in the NYSE has it back to that important high, in the same month, 5 years later.

At the same time several key emotional highs and lows over the past few years have formed resistance lines, that meet at the same price as the potential double top!

A breakout of these resistance lines would make this chart worthless....Is the market peaks here and turns down, hard to put a price on what this price point could mean for the broad markets.

Why could this pattern take on a little more importance? See below....

CLICK ON CHART TO ENLARGE

The great chart above was created by Doug Short, it reflects that margin debt is reaching levels where the S&P 500 ended up creating two major peaks over the past 13-years. The high debt situation could increase the odds of how important this technical pattern could be.

Is ole Scooby concerned about a "Danger Zone" when he shouldn't be?  Stay tuned!!!

See the original article >>

World grain stocks to end 2013-14 at four-year top

by Agrimoney.com

The International Grains Council raised to a four-year high its forecast for grain supplies at the close of next season, flagging increased prospects for corn production despite the delayed US sowing season.

The intergovernmental group lifted by 6m tonnes to 367m tonnes its forecast for world grain inventories at the close of 2013-14, surpassing levels recorded at the ends of 2010-11 and 2011-12.

The increase reflected an upgraded forecast for the world corn harvest, by 6m tonnes to a record 945m tonnes, despite the historically slow start to plantings in the US, the top producer of the grain - delays which prompted the US Department of Agriculture to trim hopes for domestic yields.

The US is placed for a "still bumper" harvest of corn, and of soybeans too, the IGC said, adding that this remained a "mild underlying bearish influence" for prices of both crops.

World carryout inventories of corn in 2013-14 will, at a five-year high of 149m tonnes, "be much more comfortable compared to the previous year, especially in the US, where stocks are expected to more than double".

'Ample supplies'

The IGC sounded a more cautious note on the outlook for the world wheat harvest in 2013-14, flagging that "there is continued uncertainty about harvest prospects in some major producers".

Nonetheless, it raised by 2m tonnes to 682m tonnes its forecast for the harvest, which has already begun in some areas, such as north Africa.

And while the council trimmed by 1m tonnes to 180m tonnes its forecast for world wheat inventories at the close of 2013-14, nudging hopes for consumption higher, it said that "wheat availabilities are still set to be ample over the year ahead".

"Trade in [wheat] feed is expected to be capped by higher corn supplies," the IGC added.

Soybean prospects

In soybeans, the council, noting that "a record crop is officially forecast for the US on a rebound in yields", lifted by 2m tonnes to 267m tonnes its forecast for the world harvest.

However, upgrading demand ideas, it kept its estimate for stocks at the close of 2013-14 at 25m tonnes, a rise of 2m tonnes year on year.

See the original article >>

Two Signs That Apple Is Bottoming

by Tom Aspray

The stocks market put in a good performance on Thursday with small caps, banks, and semiconductors doing the best. The market internals were also positive and this has kept the daily technical studies within their recent trading ranges.

Disappointing data from the Eurozone has pushed their markets lower early Friday with losses across the board. The S&P futures are also down in early trading and a weekly close in the June contract below 1632.75 on Friday would be a short-term negative. The key level for the Spyder Trust (SPY) is at $163.94.

Of course, one stock that has been much weaker than the market over the past six months is Apple Apple Inc. (AAPL) as it is down 23.4% versus a 16.8% gain in the S&P 500. There is an Apple developers meeting on June 11 but as candlestick and pivot expert John Person pointed out, the stock could trigger a monthly HCD today. This is one of the two signs that Apple Inc. (AAPL) may finally be bottoming.

chart
Click to Enlarge

Chart Analysis: The monthly chart of Apple Inc. (AAPL) shows that in addition to the weekly LCD that formed at the September highs, a monthly LCD was triggered at the end of October (see arrow).

  • From the high at $705.07 to the April low of $385.10, it was a drop of over 45%.
  • The monthly chart shows that a doji was formed in April as AAPL opened at $441.90 and closed April at $442.78.
  • Therefore, a close today above the April high of $445.25 will trigger a monthly HCD.
  • The monthly analysis for AAPL was positive from July 2009 until November 2012 when the relative performance dropped below its WMA.
  • The RS line did confirm the September highs.
  • The OBV is also below its WMA but turned up from support in March, line b, and looks ready to close May back above its WMA.
  • The quarterly pivot resistance is at $465.86 with the 38.2% Fibonacci retracement resistance at $507.73.
  • The monthly support is in the $441-443 area.

The daily chart of Apple Inc. (AAPL) appears to be forming a reverse head-and-shoulders bottom formation.

  • The left shoulder (LS) was formed in March with the low on April 19 being the head.
  • The decline three weeks ago when AAPL had a low of $418.90 is likely the left shoulder (LS).
  • The neckline is currently at $465.25 but is derived from the March high at $469.95 and the early May high of $465.70.
  • A completion of the reverse H&S formation is in the $548-$555 area.
  • The daily relative performance is back above its WMA and is now testing its downtrend, line c.
  • The RS line has good support at line d.
  • The daily on-balance volume (OBV) is also above its WMA and a close above the resistance at line e, would confirm a bottom.
  • The weekly OBV (not shown) is also above its WMA.
  • The monthly pivot is at $425.07 which corresponds to the minor 50% Fibonacci retracement support.

What it Means: The bullish sentiment for Apple has certainly taken a big hit in 2013 as it is not uncommon now for analysts to speculate that it will never again be a market leader. Anyone who voiced such an opinion a year ago was guaranteed to get a flood of angry emails.

The combination of a monthly HCD and the completion of the reverse H&S bottom will project that APPL could reach the $550 level in 2013. A two-stage buying process is advised.

How to Profit: For Apple Inc. (AAPL), go 50% long at $449.50 or better with a stop at $414.66. I would add a 50% long position on a daily close above $466 with a stop at $428.80.

See the original article >>

Joe Friday…Last time this happened, S&P 500 declined over 15%!

by Chris Kimble

CLICK ON CHART TO ENLARGE

It would be an understatement to say Real Estate is important to any economy. DJ Home Builders formed a bearish pattern back in 2007, then broke support and this index and the broad markets fell hard.

The last decline of 15%+ in the S&P 500 took place in 2011, when the Home Builders broke support of the bearish rising wedge.

Of late the Home Builders broke support of another bearish rising wedge after hitting an important Fibonacci resistance line.

Joe Friday... For the broad market to continue moving into record high levels, it needs the DJ Home Construction index needs to turn around and head higher from here!

See the original article >>

China corn demand impact minimal

by Agrimoney.com

The continued growth in US corn exports to China will see only minimal impact from the recent takeover of Smithfield Foods by Hong Kong-based Shuanghui International, according to the US Grains Council.

"Considering USDA forecasts nearly 20m tonnes of annual corn imports in China within the next 10 years, even this large hypothesized increase in pork exports would only reduce projected imports by less than 20 percent," suggests Dr. Bryan Lohmar, USGC director in China.

China's consumption of corn has grown steadily in recent years, increasing some 37% over the past decade to total 176bn tonnes in the 2010/11 season according to USDA estimates.

Imports of corn have also grown in recent years with purchases totalling 1.52m tonnes in the 2009/10 season and increasing to 5.35m tonnes in the 2011/12 season.

"Expanding production by an amount significant enough to put a sizeable dent in China's corn import program would require enormous growth, suggest Dr Lohmar.

Pork export growth 'difficult'

If agreed, the deal between Shuanghui's and Smithfield earlier this week will create the largest hog and pork producer in the world, and has prompted speculation as to US pork export levels to China.

The deal will offer Shuanghui a chance to tap directly into US pork exports which, like many other foreign foods, are prized by Chinese customers concerned over the safety of some domestic products.

However, the US Grain Council suggests it will be extremely difficult for Shuanghui to significantly increase US pork exports to China simply through its control of Smithfield.

Such an increase in China's pork import program would also be challenged by China's large and rapidly growing modern pork industry, particularly if it comes from only one player, noted the USGC.

"This growth would take time, require new facilities, and would almost certainly be faced with environmental and other interests that are already challenging the expansion of large swine operations in the United States."

The USGC suggest Shuanghui is more interested in improving both its production practices and also improving management of its integrated pork operations.

'Learning how Smithfield successfully accomplished this in the United States and other countries is likely the main benefit'.

Hurdles

Reaction to Shuanghui's $7.1bn deal for Smithfield Foods has led to mixed reaction, both as to the implications for the pork market, but also feedstuffs.

The deal itself, which would form the world's biggest hog producer, faces regulatory hurdles.

Smithfield faces pressure from its main shareholder, Continental Grain, to boost shareholder returns.

Continental Grain has suggested a break-up of Smithfield, rather than a sale of the whole group.

In addition under the terms of its deal, Smithfield still has a month continue talks other suitors, which include Bangkok-based Charoen Pokphand Foods and Sao Paulo-based JBS SA.

Shares in Smithfield Foods stood at $32.74 per share ahead of the US opening.

See the original article >>

What is this Big Move in Corn Spreads Telling Us?

By: Ted Seifried

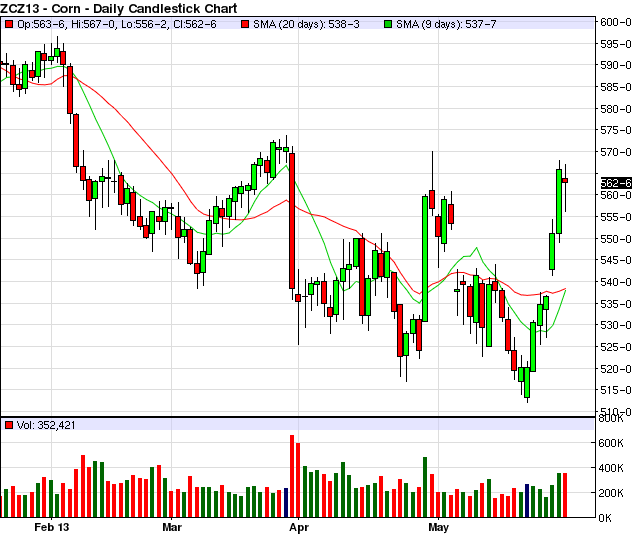
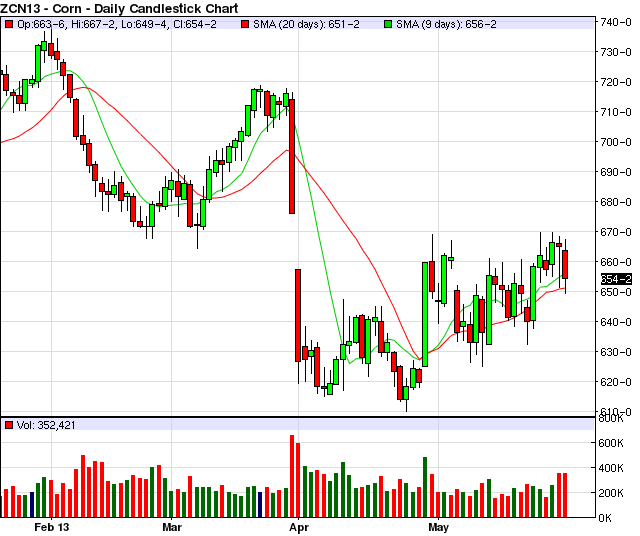
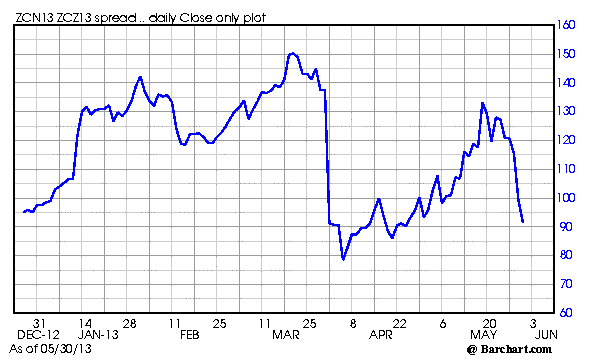
The July corn - December corn spread, otherwise known as the old crop - new crop corn spread, has narrowed over 47 cents in the last eight trade sessions.  This is a big move as far as a spread is concerned, and it comes at a very interesting time.  So, what is causing this move in the spreads and more importantly, what does is this telling us? 

In many markets we talk about bull spreading and bear spreading.  Typically a bull spread consists of buying the front month and selling a deferred month in a certain market.  It is called a bull spread because it is done when you are expecting a rally.  In a bear spread you sell the front month and buy the deferred month.  These have a tendency to work if you are right about market direction because the front month usually moves further and faster in the overall direction of the market.  So, for example if you put on a bull spread (buy front month, sell deferred month) and the front month rallies 14 cents and the back month rallies 9 cents you have made 5 cents on the spread. 

In grains, bull spreads and bear spreads get a little more complicated because we grow a crop every year and fundamentals can differ from one marketing year to the next.  A july - December spread is called an old crop - new crop spread because July corn is corn that was grown last year and December corn is corn that will be grown this year.  They are connected however because of the amount of grain that is carried over from one year to the next.  If there is a shortage of grain one year, but the prospects for next years crop are good the July will hold a large premium over the December.  On the other hand, if there are large stocks one year and concerns about new crop production then July will hold much less premium over December. 

The second example above is one way that the traditional bull spread concept can be an issue in the grains.  But, even if we have large grain stocks for one year but are worried about the next the old crop will still rally with the new crop because while we are preparing for a short crop the next year we put more premium on the grain that will carry over from one year to the next.  In fact prices will go higher in order to dampen demand so that the amount of carry over is maximised. 

So, knowing this lets look at the current situation.  There was a major drought year in the US last year, so corn stocks are on the tight end of the historical spectrum.  The outlook for next year was that we would have a giant crop on record acreage but too much rain lately has caused concerns that some corn will not be planted therefore causing concern for production.  This certainly could be a set up for a rally, and in this scenario we would expect the new crop deferred contract to rally, maybe even take the lead but given the tight stocks and the need to preserve carry over old crop should follow. 

In the last 8 days we have seen this concept break down.  As concerns about getting the corn crop planted in time have mounted December corn has rallied almost 60 cents off of lows.  In the mean time old crop July corn has not only not been able to keep up in the rally it has actually lost ground.  This is a very strange situation.  It is certainly conceivable that this is a situation that December should gain, but it is hard to justify the complete opposite movements in the two contracts and the huge move in the spread in a short period of time. 

Looking forward this could mean one of two things.  The first possibility is that the old crop July corn contract will be looking to play catch up in a big way on a continued rally.  In this case a traditional bull spread will make a comeback and work well.  The second possibility is that the recent rally off lows in new crop December corn has a different agenda.  By that I mean it is possible that December corn rallied not because of concerns of a tight stocks situation for next year, but for a different reason such as motivating corn producers to do whatever they can to get the corn planted this year even if it means planting late.  In many of the unplanted areas late planting is a risk at this point.  In northern areas there is a risk of loosing production to an early frost.  If this is the case this most likely would not be an extended rally. 

The bottom line is that the big move in the July - December corn spread in the last 8 days is not usually a sign of an extended rally. 

If you are looking for ideas or want to talk strategy feel free to give me a call or shoot me an email, you will find my contact info below.

December Corn Daily chart:

July Corn Daily chart:

July - Dec Corn Spread Daily chart:

All this means that speculators should be looking for opportunities and producers need to look to lock up some prices while we have corn near $7.00 and soybeans near $14.00. Give me a call for some ideas. In particular, producers looking to hedge all or a portion of their production may be rather interested in some of the options / options-futures strategies that I am currently using.

In my mind there has to be a balance. Neither technical nor fundamental analysis alone is enough to be consistent. Please give me a call for a trade recommendation, and we can put together a trade strategy tailored to your needs. Be safe!

See the original article >>

Are Soybean Yield Reductions Warranted this Early?

by Kevin Van Trump

Soy traders don't seem worried about the record number of acres going in the ground, but seem extremely nervous about the potential yield drag that could be associated with late-planted soybeans. Personally, I believe its still too early to be counting on significant yield drags, especially with today's stronger varieties. Still, several in the trade will tell you: Soybeans planted after the end of May will actually start to experience a reduction in yield. Others believe mid-June is a more accurate yield reducing line-in-the-sand. Regardless, the bulls seem to have the trade spooked, and the current record yield estimate of 44.5 bu./acre by the USDA is now being thrown under the bus.

The trade is simply electing to believe its too late and too wet to get a record national yield out of this crop. I personally think the bulls are getting out over the tips of their ski's a bit. What some might be missing is that there is very little factual evidence to back up this major yield reduction so early. It sounds good in theory, but I just don't see conclusive evidence. Not to mention the new varieties and how they will perform in these conditions is still somewhat of an unknown. Don't get me wrong, yields will ultimately be the determining factor for price, I just think it might still be a little early to be shaving bushels.

One thing is for certain, the trade is definitely more worried and concerned about a potential yield drag than they are about additional bean acres going in the ground. The reason why is somewhat simple: Even if we add 1.8 million more soybean acres, a slight 1-bu./acre drop in overall yield will basically offset all of those gains. Therefore, on paper yield losses obviously looks very scary.

Lets play it out a little further. The USDA is currently assuming we will harvest 76.2 million soybean acres. For argument's sake, let's say that number jumps higher by 1.5 million acres (could be conservative), giving us 77.7 million total harvested soybean acres. Let's further assume we see just a 1-bu./acre increase over last year's devastating yield of 39.6 bu. This would give us 77.7 million harvested acres at a yield of 40.6 bu., or a total production number of 3.155 billion bushels. This is still some 145 million bushels more than last years total production.

Let's also not forget about South America. Brazil looks as if they will harvest at least an additional 650 million bushels (66.5 mmt last year vs. 83.5 mmt this year). Argentina looks as if they will harvest an additional 430 million bushels (40.10 mmt last year vs. 51.0 mmt this year). Paraguay is also harvesting a record soybean crop and will have an additional 155 million bushels (4.35 mmt last year vs. 8.35 mmt this year).

Bottom line: Production setback experienced last year in South America was one of the main driving forces for higher prices. With the South American crop essentially home-free, and very little chance for any type of repeat production  problems, you have to believe the overall environment and landscape have drastically changed. Yes, the trade is currently scared in regards to U.S. yields. I can understand to some degree considering the current delays and extended rainfall in the forecast. But when you start to put all of the puzzle pieces together I see a vividly bearish longer-term soybean picture. Moral of the story, be careful being too close to the trees to ultimately see the forest. Certainly prices can push higher considering the tightness in the old crop and the upcoming roll by the funds, but in the end I have to believe traditional supply and demand wins out.

See the original article >>

Another Housing Bubble?

By Mike "Mish" Shedlock

Hugely Negative Real Interest Rates Fuel Yet Another Housing Bubble; A Word About "Inflation" and Treasury Yields

It's easy to spot a Fed-sponsored housing bubble if you look in the right places. The best place to start is an analysis of price inflation as measured by the BLS as compared to a CPI-variant that takes actual housing prices into consideration instead of rent.

This is a followup to my post Dissecting the Fed-Sponsored Housing Bubble; HPI-CPI Revisited; Real Housing Prices; Price Inflation Higher than Fed Admits.

Data for the following charts is courtesy of Lender Processing Services(LPS), Specifically the LPS Home Price Index (HPI).

The charts were produced by Doug Short at Advisor Perspectives. Anecdotes on the charts in light blue are by me.

Background

The CPI does not track home prices per se, rather the CPI uses a concept called "Owners' Equivalent Rent" (OER) as a proxy for home prices.

The BLS determines OER from a measure of actual rental prices and also by asking homeowners the question "If someone were to rent your home today, how much do you think it would rent for monthly, unfurnished and without utilities?"

If you find that preposterous, I am sure you are not the only one. Regardless, rental prices are simply not a valid measure of home prices.

OER Weighting in CPI

OER is now at 24.041% of CPI, which still rounds to 24.0%, but the other housing wedge is now an even 17.0%, down from 17.1% in the previous version.

The rest of the charts show various effects if one substitutes actual home prices as measured by the HPI in the data.

Two Inflation Indexes

Click to View
Click for a larger image

As measured by the CPI, price inflation is 1.47% annualized. As measured by HPI-substitution, price inflation is a much higher 3.33%. The Fed would have you believe everything is under control. Of course they said the same thing in 2005.

Real Interest Rates

Click to View
Click for a larger image

Real interest rates are the difference between the Fed Funds rate and measures of inflation. The chart shows real interest rates as measured by the CPI vs real interest rates as measured by HPI-CPI. As measured by the CPI, real rates are -1.83%. As measured by the HPI-CPI real interest rates are-3.18%. For comparison purposes, real interest rate were -4.86 in mid-2004. The housing bubble burst one year later.

Fed Misses the Obvious

Click to View
Click for a larger image

The above chart shows how much home prices as measured by HPI diverged from OER. And here we go again.

A Word About "Inflation" and Treasury Yields

This post is about "price inflation". It does not change my views on credit which I believe is headed for another bust. It also shows how hard it is to actually measure prices.

It's easy for the Fed to say everything is under control when it ignores everything important: housing, energy prices, education, and massive bubbles in the stock market, and junk bond market.

What about treasuries?

When the stock market and junk bond market bubbles burst, the Fed is as likely as not to go further out on the yield curve to suppress rates. Look for the Fed to keep doing the same thing over and over and over again.

Fools never learn as noted in a recap of the Fed Uncertainty Principle written April 3, 2008 before the Bernanke Fed started slashing rates in the Global Financial Crisis.

Fed Uncertainty Principle:The fed, by its very existence, has completely distorted the market via self reinforcing observer/participant feedback loops. Thus, it is fatally flawed logic to suggest the Fed is simply following the market, therefore the market is to blame for the Fed's actions. There would not be a Fed in a free market, and by implication there would not be observer/participant feedback loops either.
Corollary Number One: The Fed has no idea where interest rates should be. Only a free market does. The Fed will be disingenuous about what it knows (nothing of use) and doesn't know (much more than it wants to admit), particularly in times of economic stress.
Corollary Number Two: The government/quasi-government body most responsible for creating this mess (the Fed), will attempt a big power grab, purportedly to fix whatever problems it creates. The bigger the mess it creates, the more power it will attempt to grab. Over time this leads to dangerously concentrated power into the hands of those who have already proven they do not know what they are doing.
Corollary Number Three: Don't expect the Fed to learn from past mistakes. Instead, expect the Fed to repeat them with bigger and bigger doses of exactly what created the initial problem.
Corollary Number Four: The Fed simply does not care whether its actions are illegal or not. The Fed is operating under the principle that it's easier to get forgiveness than permission. And forgiveness is just another means to the desired power grab it is seeking.

I don't care that much for treasuries here as I see no value, but that does not make them a good short. One look at Japan shows central bank sponsored low interest rate paradigms can last a lot longer than most think.

See the original article >>

Negative Interest Rates

by David Kotok

There seems to be a debate at the European Central Bank (ECB). The issue is whether or not the ECB should impose a negative interest rate.

I listened to the interview of Christian Noyer, Governor of the Banque de France. His personal inclination is to oppose the use of a negative interest rate as a policy mechanism. He cited other cases to support his view.

ECB President Mario Draghi mentioned the possibility of using a negative interest rate. That triggered the discussion.

Negative interest rates are the ultimate in market distortions. They employ only a stick and no carrot. Their use tends to progress from disincentive through penalty to punishment.

There is only a limited history of the use of negative interest rates. Many decades ago, Switzerland discouraged incoming Swiss-franc deposits by imposing a negative interest rate on balances placed with Swiss banks. In other words, a person deposited money in the bank, and the bank charged the depositor for the privilege of keeping it there.

During the financial crisis in the US, the Bank of New York imposed a negative interest rate – a penalty – on deposits over $50 million. The bank essentially told customers to remove their money.

Sweden’s central bank, the Sveriges Riksbank, also attempted a negative interest rate during the financial crisis but quickly reversed its policy. I had the opportunity to discuss the Swedish experience with the governor of the central bank at the Global Interdependence Center (GIC) meeting in Helsinki. Governor Stefan Ingves was quick to point out that benefits from negative interest rates did not seem to be observable. He did not get into the costs associated with negative interest rates, but he did affirm that it was unlikely that Sweden would use them again.

In the US there is a question as to whether the existing, very low but still positive interest rates are too low. We have a Federal Deposit Insurance Corporation (FDIC) fee in the US. It is assessed on assets of US-based banks. The FDIC fee is a formulaic approach that includes excess reserve deposits at the Federal Reserve (Fed), on which the Fed pays an interest rate of 25 basis points, or 0.25 percent. The differential between the excess reserve positive rate and the federal funds rate reflects a market that is attempting to find a clearing price of overnight liquidity transacted among and between banks. The federal funds rate is set below the excess reserve rate by market forces.

A second distortion occurs in the US because Fannie Mae, Freddie Mac, and other Government-Sponsored Enterprises (GSEs) do not participate directly with reserve deposits at the Fed. Fannie Mae is not a bank; it has to sell its excess cash in the federal funds market at whatever interest rate it can obtain. That is how it earns something other than zero on its large excess cash flows.

The buyers of Fannie Mae federal funds recycle the funds to the Fed as an excess reserve deposit. Buyers make an arbitrage profit less the cost that they incur in payments of the FDIC fee.

The whole process in the US is even further distorted by the fact that US subsidiaries of foreign-owned banks are not subjected to the FDIC fee and operate with a different formula than US banks. The principle behind that rule is that the capital determinants of foreign banks are set by a different regime than for US banks.

This distortion at the short end of the yield curve in these very-low-interest-rate times exacerbates difficulties in the formulation and implementation of monetary policy. In the midst of all this turbulence we now have a European brouhaha going on over negative interest rates.

Our conclusion is that the likelihood of a negative interest rate being imposed by the ECB is near zero. It is not going to happen. Cooler heads will prevail at the ECB. At least we believe so.

However, Europe has other serious issues with its banking system. It has not resolved the Eurozone-wide mechanism to secure insured deposits. It attempted to penalize insured depositors in the Cyprus affair and narrowly averted a disaster.

It penalized uninsured depositors and is developing a system by which uninsured depositors will have a single standing and at least know the stratification of their claims on banks. That process has not yet been resolved.

In the ECB and the Eurozone, we see a wounded banking system that is only slowly discussing the mechanisms of repair. Negative interest rates should not be one of them.

In the US, we see distorted pricing and its impacts on our markets. These impacts are not fully understood by the general public. The public and most depositors are taking all deposits in the US for granted. They believe they are safe. However, the US is moving toward a bail-in rather than a bailout regime. The US and the FDIC in particular have affirmed that fact in documents that are diplomatically written but transparent to those who have eyes to see.

At Cumberland, we are overweight banks. We believe that the supportive impacts of the Fed’s bailout regime are still affecting US banks. We do not see a banking crisis in front of us in the near term, due to the huge excess liquidity provided by the Fed. It is hard to imagine how a banking crisis might occur when there is almost $2 trillion in excess reserves in the US banking system and over $5 trillion in excess banking reserves worldwide.

We worry about the long term. The ranking order for depositor safety and the claims of bondholders, shareholders, and banks is a subject undergoing transition worldwide. Different jurisdictions are approaching this in different ways, and there is no global resolution yet.

At this point we remain overweight in US financials, including big banks, regional banks, and insurance companies. We watch the developments and are seeing the markets improve. We worry, however, about the longer term.

See the original article >>

Gold Surged When Bonds and Stocks Risks Increased

By Sharps Pixley Ltd

The U.S. Comex gold futures surged 2.36 percent in the past two days to end at $1,411.50 on Thursday. During Asian Friday morning, the prices jumped another 0.40 percent to $1,417. In contrast, the Dollar Index has had a setback, dropping 1.26 percent on Wednesday and Thursday to finish at 83.042. The S&P 500 index and the Euro Stoxx 50 index rebounded 0.37 percent and 0.45 percent respectively on Thursday after falling the day before. The Nikkei 225 index entered into a correction on Thursday when it dropped 5.15 percent. The market plunged after the 10-year JGB yield reached 0.933 percent from 0.609 percent at the end of April.


Did the Market Read the Fed Wrongly?
The recent data from the U.S. have given hope to the market that the Fed would not slow down its bond purchases anytime soon. The U.S. real GDP grew at 2.4 percent in Q1 versus an expected 2.5 percent while the jobless claims rose to 354,000 versus the forecast of 340,000. The April pending home sales rose only 0.3 percent versus the survey of 1.5 percent. The economy does not appear to be improving on a sustainable basis, and the Fed will likely maintain its debt purchases. In Japan, the industrial production surged 1.7 percent in April although the CPI fell again. The better growth data helped the stock market to rebound on Friday.


Asian Love for Gold
In its press release on Thursday, the World Gold Council highlighted the divergence in behaviour between the buyers of gold bars, coins and jewellery and the buyers of the ETF products. The WGC survey found that 82% of the buyers in India and China see a stable or higher gold price in the next 5 years. Gold demand in Asia will also reach a record high in Q2 2013 according to the WGC.


What to Watch
We will watch Ben Bernanke's speech on 2 June, Janet Yellen's speech and the May final PMI index for China, the E17 and the U.S. on 3 June, the 10-year JGB auction on 4 June, the U.S. Fed Beige Book and the U.S. May ADP private payrolls on 5 June, the monetary policy announcement of the BoE and the ECB on 6 June as well as the April Germany industrial production data and the May U.S. non-farm payrolls and unemployment rate on 7 June.

See the original article >>

The Right Average

by Brandon Wendell

Moving averages are a part of many traders’ analysis tools. A question I usually get from students is,

What period moving average is best to use?”

While there is no one moving average that is perfect and will work all the time, there is a way to identify the best average for the security and time frame that we are trading.

moving-averages

Follow up:

All securities have cycles that affect the price movement. If we can identify the cycle that is dominating our stock, we can identify with a higher probability when tops and bottoms in price will occur and when we should buy or sell our stock. Cycles are measured from trough to trough. The troughs are the low points in price that correspond with the lows in the cycle.  While this sounds complicated, with practice it can become easier.

Click to enlarge

Looking at the weekly chart of the Nifty, we can see that the stock index seems to make bottoms at a fairly regular interval.

Click to enlarge

When we are using moving averages, we acknowledge that it is an average of price and that price will move away from that average and revert back during a trend. The average should be much like the black line dissecting the cycle I drew in figure 1 of this article. We want an average that is half the length of the cycle so that it will show our peaks and troughs as movements from and to the average itself.

In an uptrend, we should see prices move away from the average only to snap back to them when the trough of the cycle occurs. If we are changing to a downtrend, then the average would be violated and the price would bounce off of it to the downside before returning during peaks in the cycle. If the average is being violated in both directions, then we do not have a strong trend in that timeframe.

Click to enlarge

Click to enlarge

By using the right average for the timeframe you are trading, you can increase your odds for success. Just be careful to check the cycle from time to time as cycles can change with market conditions. We need to adapt with the markets for maximum success. We can use this cycle identification on any security and on any timeframe. Until next time, trade safe and trade well!

See the original article >>

Is There Life After Monetary Stimulus?

by Mike Patton

One of the most critical financial issues facing us today is understanding what could happen when the world’s central bankers discontinue their quantitative easing and return to normal monetary policy. Since the current monetary expansion has cultivated only minimal GDP, how will the economy react when the liquidity onslaught ends? Today, we are faced with a tremendous debt, record deficits, and a Fed with a hypodermic needle filled with a seemingly unlimited supply of cash. In this article, we’ll tackle these important issues and discuss some possible scenarios. Let’s begin with GDP.

GDP

GDP measures the extent an economy grows or contracts and consists of four parts: consumer spending; business & industry spending; government spending; and net exports. Consumer spending is the largest component of GDP, accounting for nearly 70% of the total. Hence, ours is a consumption-based economy, unlike China, for example, which has an export-based economy. It’s equally important to understand that if consumers were to cease borrowing, economic growth would come to a grinding halt. Therefore, debt is essential to economic growth. In 2008, banks tightened their lending standards and although they are much more relaxed today, the economy continues to grow at a very slow rate. This is largely due to the tremendous amount of debt incurred by consumers and businesses in the decades prior to 2008. These factors provided the rationale for government to step in and borrow as much as it did to help stimulate the economy. However, when government engages in deficit spending, it’s effect on economic growth is much more muted than when the private sector borrows. This economic benefit from spending is referred to as the “multiplier effect”, which again is much greater in the private sector.

Deficit Spending and Debt: Public and Private

From 1901 through mid 1974, the federal government balanced its budget the majority of the time. However, beginning in the mid 1970′s, the deficit began to expand. With the exception of fiscal years 1998 to 2002, the federal government has spent more than it has received. Moreover, the deficits have increased substantially since 2002. To some extent, politicians use government revenue as a means to repay political donors. But that’s a subject for another time.

Businesses and individuals also engage in deficit spending, but only so far as they can afford to service their debt. At some point they must restrain themselves. Though individuals and businesses have limits, the federal government has a tremendous amount of latitude. However, limits still exist on the amount government may borrow. It is, however, much harder to determine just where those limits are. The reason is that government can raise taxes to pay for its spending. Typically, new taxes begin with the rich, but when it appears the level of taxation is hitting a ceiling, government sets its sights on the middle class. Then, when the middle class feels it’s being over taxed, the pitch forks and torches emerge. Where is the limit on the amount of debt a government can acquire? It’s very hard to say, because we have yet to see the type of demonstrations which would indicate we have reached it. Yes, we did see the 99% protest a while back, but it was a demonstration against the rich not against higher taxes. Moreover, it was precisely the type of deflection technique and result many politicians were hoping to achieve. In other words, anger was directed toward the rich, not toward the politicians who are responsible for managing the tax revenue we pay. Remember, it is government who makes the rules, the rich just learn how to successfully maneuver them. Today, we have $16.8 trillion in federal debt and the expectation is that it will increase by as much as $15-20 trillion over the next decade.

Fed Tools

The Fed is charged with the dual mandates of maintaining full employment and stable prices. To accomplish this, they have several tools in its box, including: expanding and reducing the money supply; raising and lowering interest rates and bank reserves; and a few additional strategies at the margin. In 2008, when the crisis hit, the Fed introduced the T.A.R.P. program, an $800 billion monetary infusion. Next, we had QEII, a $600 billion expansion over an eight month period. Today, we have QEIII, where the Fed is adding $85 billion per month to the system. Normally, lowering interest rates, expanding the money supply by a reasonable amount and reducing bank reserves were sufficient to stimulate economic growth. However, today, it’s clear this is not enough. Part of the Fed’s current expansion is to buy longer term government securities (i.e.; 7-10 year maturities). This will help push bond prices higher and interest rates lower. Hence, it will also, by design, keep mortgage rates low which will increase refinance activity which will then free up cash flow which can be spent in the economy. This technique was nicknamed operation twist.

A Quick Global Economic Overview

The U.S. economy is the largest in the world and GDP remains weak. Europe, as a whole, is the second largest economy and is in recession. China, the world’s third largest economy, is not exporting as much due to the weak economies of the U.S. and Europe, and its GDP is falling which hurts Japan, the fourth largest economy. Japan has been in a deflationary funk for over two decades now. In fact, deflation fears in the U.S. seem to be central to the Fed.

Possible Scenarios

It’s possible that the U.S. economy could recover and pull the rest of the world out of the doldrums. However, this would be a tall order as Europe has such a tremendous amount of debt to manage and possibly little time until it unwinds. Therefore, here’s my best guess. America will continue to expand its money supply, amass debt, and raise taxes. After the “rich” have had enough and taxes are near a peak, the middle class will be next. That’s when, as I mentioned, we’ll see the pitchforks and torches. Europe will likely face a depression-deflation-default scenario as they may have found and exceeded this ‘limit’ on government debt I alluded to earlier. America could get serious with austerity or as they say back home, budget cuts. Will Americans put up with cuts in its entitlement programs? Entitlements are the largest items in the federal budget, but it would be a tough sale for politicians, that is, until such time as it becomes evident that there no other options exist.

Whatever the case, here at home, we probably have some time until it unravels. How long? That’s anyone’s guess. But unless Washington begins to make the tough choices, everyone will pay the price and there will be a lot of finger pointing. Of course, it is possible that consumers could begin to borrow heavily and our economy would expand, thereby helping the rest of the world. But it was excess borrowing that brought us to where we are today. To summarize, it’s not a foregone conclusion that the U.S. economy will collapse. However, I do see rough times ahead as I find no evidence that Washington understands what’s at stake. In essence, it seems to be politics as usual.

Stay tuned for more!

See the original article >>

Inequality on the Horizon of Need

by J. Bradford DeLong

BERKELEY – By any economic measure, we are living in disappointing times. In the United States, 7.2% of the normal productive labor currently stands idle, while the employment gap in Europe is rising and due to exceed that of the US by the end of the year. So it is important to step back and remind ourselves that the “lost decade” that we are currently suffering is not our long-run economic destiny.

This illustration is by Barrie Maguire and comes from <a href="http://www.newsart.com">NewsArt.com</a>, and is the property of the NewsArt organization and of its artist. Reproducing this image is a violation of copyright law.

Illustration by Barrie Maguire

As Paul Krugman recently reminded us, John Maynard Keynes perhaps put it best:

“This is a nightmare, which will pass away with the morning. For the resources of nature and men’s devices are just as fertile and productive as they were. The rate of our progress towards solving the material problems of life is not less rapid. We are as capable as before of affording for everyone a high standard of life – high, I mean, compared with, say, 20 years ago – and will soon learn to afford a standard higher still. We were not previously deceived. But today we have involved ourselves in a colossal muddle, having blundered in the control of a delicate machine, the working of which we do not understand. The result is that our possibilities of wealth may run to waste for a time.”

But what is our long-run economic destiny? Keynes looked forward to a time, perhaps 2050, when everyone (in England, at least) would be able to have the lifestyle of a Keynes. And, because he imagined that no sane person could want more of the necessities, conveniences, and luxuries of life than a Keynes had, the economic problem would be solved.

We are wiser – and perhaps sadder – than Keynes. We know that we want hip replacements and heart transplants and fertility treatment and cheap air travel and central heating and broadband Internet and exclusive beachfront access. Already nearly everybody in the North Atlantic region has enough food to avoid hunger, enough clothing to stay warm, enough shelter to remain dry. And yet we want more, feel resentful when we do not get it, and are self-aware enough to know that luxuries turn into conveniences, and then into necessities – and that we are very good at inventing new luxuries after which to strive.

So the economic problem will certainly be with us for a long time yet. But at least we can count on being able to generate a relatively egalitarian middle-class society as we collectively slouch toward our consumerist utopia, right?

It was Karl Smith of the University of North Carolina who explained to me that this was likely to be wrong. The long post-Industrial Revolution boom, which carried unskilled workers’ wages to previously unheard-of heights – keeping them within shouting (or at least dreaming) distance of the lifestyles of the rich and famous – is not necessarily a good guide to what will come next.

To create wealth, you need ideas about how to shape matter and energy, additional energy itself to carry out the shaping, and instrumentalities to control the shaping as it is accomplished. The Industrial Revolution brought ideas and energy to the table, but human brains remained the only effective instrumentalities of control. As ideas and energy became cheap, the human brains that were their complements became valuable.

But, as we move into a future of artificial intelligence that observers like Kevin Drum expect (or even of the artificial moronity that is already clearly at hand), and into a future of biotechnology that grows itself as biological systems do, won’t human brains cease to be the only valuable instrumentalities of control?

It is not necessarily the case that “unskilled” workers’ standards of living will fall in absolute terms: the same factors that make human brains less valuable may well be working equally effectively to reduce the costs of life’s necessities, conveniences, and luxuries. But wealth is likely to flow to the owners of productive – or perhaps fashionable – ideas, and to owners of things that can be imitated only with great difficulty and high cost, even with dirt-cheap instrumentalities of control, dirt-cheap energy, and plentiful ideas

The lesson is clear: the market is not guaranteed by nature to produce a long-run future characterized by a reasonable degree of wealth inequality and relative poverty. Unless and until we recognize this fully, we will remain at the mercy of Keynes’s poorly understood “delicate machine.”

See the original article >>

Japan’s equity and bond markets: Shocking

by Economist

Volatile bond yields may spell trouble for Abenomics

IT IS the one thing that was not supposed to happen. On April 4th the Bank of Japan (BoJ) announced its shock-and-awe plan to hoover up ¥7 trillion ($68 billion) of government bonds a month and double the monetary base. But instead of producing rising bond prices and falling yields, the central bank’s actions have so far led to the opposite. On May 23rd the yield on ten-year Japanese government bonds touched 1%, three times higher than before the BoJ’s April announcement. And on the same day Japanese stocks plunged, with the Nikkei 225 index dropping by 7% (see chart). Could “Abenomics”, the economic-revival plan of Shinzo Abe, Japan’s prime minister, already be coming unstuck?

The most tangible success for Abenomics had been a soaring stockmarket: the Nikkei share index rose by 79% in the year to May 22nd. Although its fall since its peak reached 13% on May 30th, this partly reflects profit-taking. But the spike in bond yields is continuing to unnerve investors. In April Haruhiko Kuroda, the governor of the BoJ, had said the bank would encourage further falls in nominal interest rates. Given the rise in bond yields since, says Naka Matsuzawa, chief strategist at Nomura Securities, an investment bank, “you can say that the easing by the Bank of Japan has in one sense already failed.”

The nub of the problem is that the bank’s twin aims—generating inflation and bringing down yields—are somewhat contradictory. Holders of low-yielding government bonds who believe that the BoJ will achieve its inflation target of 2% in two years may respond by selling. Their sales over the past few weeks have pushed up nominal yields far more quickly than the BoJ expected. Higher inflation, which would bring down real rates, has not yet arrived. Pessimists therefore argue that borrowing costs are rising, posing a threat to any early economic recovery.

Optimists see things differently. First, they point out, bond yields may have simply returned to their recent trading range; at around 0.3% just before the BoJ’s April announcement they were unusually low, even for Japan. Second, the bank’s aim to generate inflation expectations seems to have succeeded (at least in the case of bond traders). And third, higher volatility in bond yields is to be expected after such a big intervention by the central bank.

Both Taro Aso, the finance minister, and Mr Abe last week called on the BoJ to reassure the bond market. Mr Kuroda has made some confusing statements. On May 22nd he said that the spike in rates would not affect the economy. But he also argued that the central bank does not have full control over long-term rates. After plunging stockmarkets compounded worries about bond-market volatility, Mr Kuroda pledged to do more to keep rates stable.

A particular fear is that higher volatility could provoke a repeat of the value-at-risk shock of 2003, when market-risk models spurred further selling once volatility triggers had been breached. The worst scenario is that bond-market volatility could focus attention on Japan’s public debt, which stands at nearly 250% of GDP. Owning so many government bonds, banks are heavily exposed to any rise in yields: an increase of only one percentage point would mean a loss of ¥10 trillion for Japan’s banks overall, according to J.P. Morgan.

“So far there is no connection between volatile bond yields and the fiscal position,” says an official at the finance ministry. Mr Kuroda reminded the government this week that it, too, has a role to play in reassuring bond investors—by pursuing fiscal consolidation. It soon has to decide whether to go ahead with a planned rise in the consumption tax in April 2014 to boost tax revenues. A package of structural reforms to boost long-term economic growth, the details of which will be announced soon, would also calm nerves.

See the original article >>

EU27 Youth Unemployment Hits 23.5%

By tothetick

We are told that it’s the youth that is our future. These are the people that supposedly will be governing us one day not in the not too distant future when we sit comfortable doing whatever we have to (or rather, will be able to) do as retirees. That means we will be probably grafting hard to pay for the money that the state won’t be able to pay us because the pensions have all gone topsy-turvy and we won’t be sitting on the stash of cash like some people might have been able to do in the past.

But, when those young people of today get to power (if by some pure stroke of luck there is any money left) will probably turn around and say something like this: “Where were you when we needed you?”

How right they will be! New figures that have just been released on youth unemployment in the EU27 have seen an increase yet again for the first quarter of 2013. Unemployment for young people aged between 15 and 24 edged higher yet again and now stands at 23.5%. And they dare tell us that we are seeing an improvement in the economic situation, that the light at the end of the tunnel?

Perhaps they should ask nearly two thirds of Greeks in that age bracket (58%) that are not currently in employment. Spain comes in at a close second place with 55.8%. What sort of prospects do those young people have? It’s probably not surprising that unemployment in the top four countries in the ranking are those that have the worst economic situation, at the present time. Portugal is third with a figure of 38.2%, closely followed by Italy in fourth position (36.9%).

In the top ten countries that are suffering from high unemployment for young people seven of them belong to the Eurozone. Clearly, the knock-on effect has had drastic consequences for young people. But, it’s high time that Mrs. Merkel, Mr. Hollande and Mr. Cameron (to name but a few) actually took decisions that were going to create jobs. At the present time, we can only see budget cuts and austerity measures. We hear of how we must grin and bear it and hold on and things will get better. France has an unemployment rate for young people aged 15-24 years old at 26.3%. The UK has 20.6% of its youth unemployed at the present time and Germany is the best of the bunch (top of the class?) with just 7.6%.

While youth unemployment has increased in overall terms across all countries, it has in fact, however, declined in Germany, Austria and Finland, for example in the past three years. There are some out there that are saying that youth unemployment is a myth, however. Perhaps they might like to jump on a plane to Greece or Spain and ask the young people there.

Greece has 39% of those that are in this bracket that are long-term unemployed. Spain stands at 35.6% long-term unemployed. Germany has 23.3% of long-term unemployed. That means unemployed for more than 12 months. This is not a myth. This is not scaremongering. This is the reality of people aged between 15 and 24. In the majority of countries of the EU, we have a ratio of young people to total population that represents approximately 7%.

Merkel and Hollande think that they have the answer (but don’t they always?). They have announced a plan that will save the youth of the EU27. It has just been unveiled in Paris. They are going to provide cheaper credit to companies in the EU and thus ease unemployment for the youth and create jobs (on a massive scale no doubt). Higher company financing has been the object of all criticism from both the German and the French Finance Ministers (Schaeuble and Moscovci). That’s what’s stopping economic recovery. Easy! Why didn’t we think of that way before? The Franco-German solution is to get the EIB (European Investment Bank) to leverage 6 billion euros (nearly $8 billion) to yield 60 billion euros in loans for SMEs. The EIB is already on target to release more than 70 billion euros in funds between now and 2016 to boost the EU.

There are 6 million unemployed young people in the EU today. The answer for Merkel and Hollande is to make money available, increase availability of loans and that will generate business and create employment. If it were that easy, we would have done it long ago. Create as many loans as you wish Mrs. Merkel and Mr. Hollande, but will that create jobs? It’s not throwing money at companies that creates jobs. It’s far more complicated than that. Hollande already promised to create 150, 000 jobs for the young as an electoral pledge. He hasn’t succeeded.

Changing the system in various countries might mean that young people get better chances of being employed. France has the highest rate of university education in the EU (42.8%), but that hasn’t stopped the youth becoming unemployed. The countries that have the highest rates of unemployment for young people are those that are the most educated, in fact. They have young people that are over-educated and a limited supply of jobs in certain sectors. Young people out-bid themselves in the market and they are over-qualified in the race to get more and more university degrees. Greece has 30.9% of its young people that are university educated. Spain is at over 39%. They offer few programs of apprenticeship (contrary to Germany, which has a low unemployment rate). Manual jobs are looked down upon in countries like France, where you have to go to a Grande École. It’s a shame that the jobs are not so grand at the end of it for the youngsters of today!

See the original article >>

3 Reasons For Higher Market Highs

by Lance Roberts

Howard Marks once wrote:

“Resisting – and thereby achieving success as a contrarian – isn’t easy. Things combine to make it difficult; including natural herd tendencies and the pain imposed by being out of step, since momentum invariably makes pro-cyclical actions look correct for a while. (That’s why it’s essential to remember that “being too far ahead of your time is indistinguishable from being wrong.”)

Given the uncertain nature of the future, and thus the difficulty of being confident your position is the right one – especially as price moves against you – it’s challenging to be a lonely contrarian."

It is from this viewpoint within which I most often find myself being at odds with the mainstream journalists, economists and analysts.  I prefer to look at the data as "it is" rather than as "I hope it will be," for in the long run, it is reality that will win out over fantasy.  This was the premise from which I recently wrote "Evaluating 3 Bullish Arguments"  wherein I analyzed three of the most common fundamental arguments used to support "bullish outlooks."  Those arguments all failed under real scrutiny.

While the average "saver" chases the stock market, salivating at every tick higher, what they often fail to recognize is the mounting risks that will eventually lead to larger than expected losses of investment capital.  History is replete with evidence that shows that the longer an up cycle lasts the larger the losses are when it contracts.  It ALWAYS contracts eventually.  Individuals, despite the television commercials that promote the latest do-it-yourself trading platforms, are not capable of navigating the financial markets over a full cycle.

It is important to understand that I am not "bullish" or "bearish." I have no bias towards the markets other than participating when it is rising and protecting client capital when it isn't.  However, I am often given the moniker of a "bear" because I choose to point out the risks to investment capital rather than joining in with the lemmings all merrily marching towards to their eventual demise.  My job, as a portfolio manager, is to navigate the markets for the "full cycle" - both the up cycle as well as the down.  While the media chastises individuals for not chasing the market to the upside - I have never met an individual yet that was happy with matching market performance during a 20% decline.  Losses of investment capital hurt individuals far more than missed opportunities.  Lost capital is also far more difficult to recoup.

However, while I have spilt much ink lately pointing out the risks to investors ahead (see here, here and here), it is important that you realize that our portfolio models remain fully invested and that I have been correct in my assessments of the current market trends.  Back in February, which now seems like a lifetime ago, I penned an article entitled "Get Ready For The Run To All-Time Highs"  in which we discussed the reasons why the stock market would likely push to all-time nominal highs.  At that time I stated:

"The bullish trend is supported, at the moment, by excessive bullish optimism and $85 billion a month in liquidity. Market participants, like a marathon runner, are so amped up on endorphins that they lose awareness of their surroundings. Right now, investors see the finish line just ahead as CNBC flashes banners on their screen with countdowns of points to reach a new all-time high.

However, it is important as investors, that we do not simply dismiss the dangers that continue to build in the economy and the markets. To simply assume that there are no excesses being created in various asset classes is short sighted. Asset "bubbles" are never recognized, or acknowledged, until after the fact. Currently the increases being witnessed are primarily due to the inflows of liquidity which is masking the deterioration of fundamental underpinnings. That is an unsustainable trend in the longer term, but, in the short term there is nothing inhibiting further increases as long as complacency remains high."

That analysis, some 160 S&P 500 points later, remains salient.  While the risks are definitely mounting (record margin debt levels, low "junk bond" yields, markets at extreme deviations from long term moving averages) there are several reasons why stocks could continue to climb higher in the near term. 

The Fed's Liquidity Pump

The most obvious driver of stocks currently is the Federal Reserve's ongoing balance sheet expansion program which pushes liquidity directly into the financial markets.  As the chart shows below there is an extremely high correlation, since 2009, between the expansion of the Fed balance sheet and the financial markets.

Fed-Balance-Sheet-VS-SP500-050913

As long as the Federal Reserve remains committed to its "accommodative strategies" the markets are likely to remain buoyant against weaker fundamental and economic underpinnings.  This driver, by all counts, is the sole driver of higher asset prices currently and in the near future.

Complete Complacency

I stated recently that the "lack of fear is what we should fear the most."  When investors are the most complacent that is when bad things tend to occur in the financial markets.  However, complacency is also a tailwind for stocks as long as there are no exogenous shocks to change the course of the flow of money. 

The chart below is the STA Risk Ratio which is a composite index of various sentiment indicators such as the volatility index, AAII bull/bear ratio, Institutional Investor bull/bear ratio, NYSE high/low ratio and others.  When this index is rising, as it is currently, markets are on the rise as well.  While this index is near historical peaks there is current no "event risk" present, that we are aware of, at the moment to send investors scurrying for cover. 

This complete lack of fear, combined with the belief that as long as the Fed is in play there is no downside risk to owning stocks, makes it is very possible for stocks to continue upward trajectory within the context of the current bullish trend.  As we will discuss below, there is currently no overhead resistance for stocks from a historical perspective.

STA-RiskRatio-053013

Bullish Trend

The laws of physics state that an object in motion will remain in motion until it meets resistance.  That is currently the dynamic of the markets.  With the breakout of the bullish uptrend, combined with the break of long term overhead resistance, there is nothing to stop asset prices from rising further until the next major correction occurs.

SP500-bullishtrend-053013

I have drawn three important lines in the chart above.  The break of overhead resistance will now become the first level of support for the markets on any correction.  If the markets do correct, and find support at 1600 while simulatenously working off the much overbought condition in the process, then the market could rally higher from this level.  This same idea goes for the previous two upward trending bullish support lines.  However, if the market breaks below 1400 then a different dynamic comes into play.  The current bullish cycle will end and a bear market investment strategy will need to be put into play.

However, currently, there is little to stop asset prices from rising higher technically as long as:

1) The Fed remains engaged in their current liquidity programs.

2) Economic and fundamental "bad news" remains "good news" for the markets as it keeps the Federal Reserve in play.

3) The other major Central Banks remain engaged in their liquidity programs.

4) No exogenous events spring up such as a resurgence of the Eurozone crisis.

5) Interest rates remain contained below 2.5%

Risks Remain

While stocks could continue to climb higher that does not mitigate the underlying risks.  In fact, it is quite the opposite.  It is very likely that we are creating one, or more, asset bubbles once again.  However, what is missing currently is the catalyst to spark the next major correction.

That catalyst is likely something that we are not even aware of at the moment.  It could be a resurgence of the Eurocrisis, a banking crisis or Japan's grand experiment backfiring.  It could also be the upcoming debt ceiling debate, more government spending cuts, or higher tax rates.  It could even be just the onset of an economic business cycle recession from the continued drags out of Europe and now the emerging market countries.

Regardless, at some point, and it is only a function of time, reality and fantasy will collide.  The reversion of the current extremes will happen devastatingly fast.  When this occurs the media will question how such a thing could of happened? Questions will be asked why no one saw it coming. Fingers will be pointed and blame will be laid.  While I am absolutely certain this will happen - I just don't know when.  It could be later this year or even next year.  Timing is always the problem and as Howard Marks stated - being early, even if you are right, is the same as being wrong.

This is why it is more important than ever that you remain aware of the risks and pay attention to exposure that you take on within your portfolio.  I point out to you the risks that we are watching, the detail behind the headlines and historical precedents that have led to massive losses of investor capital in the past, so that you can take appropriate risk management actions in your portfolio.  There is no prize for beating the market from one year to the next, however, there are severe penalties when things don't go as planned.

Enjoy the ride - just don't forget that our job as investors is to "sell high" so that we can "buy low."   This is the one simple rule that is always overlooked by the media, analysts and economists who are chiding you to chase extremely overbought, over extended and excessively bullish markets.

See the original article >>

Thursday, May 30, 2013

Dario per Franca

di Dario Fo

dario_fo_franca_rame.jpg

di Dario Fo

"Franca ed io abbiamo scritto quasi sempre i testi del nostro teatro insieme. Io mi prendevo l’onere di mettere giù la trama quindi gliela illustravo e lei proponeva le varianti, spesso li recitavamo a soggetto, all’improvvisa, come si dice... Questo era il metodo preferito ma non sempre funzionava. Si discuteva anche ferocemente, si buttava tutto all’aria e si ricominciava da capo. In verità mi trovavo a dover riscrivere di nuovo il testo da solo. Poi lo si discuteva con più calma e si giungeva ad una versione che funzionasse e che andasse bene a tutt’e due.
Anche Franca è stata l’autrice unica di alcuni testi. Ci sono opere, come per esempio “Parliamo di donne”, che furono stese da lei completamente a mia insaputa. Quando mi ha dato da leggere questa commedia già ultimata sono rimasto un po’ perplesso... e seccato! Ma come ti permetti?!? No, scherzavo...
Io ho proposto qualche variante ma di fatto si trattava di un’opera del tutto personale.
Pochi lo sanno ma la gran parte degli spettacoli che trattavano di questioni prettamente femminili è stata Franca ad averli scritti, elaborati e poi li ha recitati al completo spesso anche da sola. E io mi sono trovato a collaborare solo per la messa in scena.
Vi dirò di più: testi quali Mistero Buffo e Morte Accidentale di un Anarchico - che io avevo realizzato come autore unico - hanno avuto grande successo anche all’estero con centinaia di allestimenti dall’America all’Oriente, per non parlare dell’Europa.
Ma dei nostri lavori quello che ha battuto tutti i record di messa in scena è Coppia Aperta, Quasi Spalancata che è stato replicato con diverse regie per più di 700 edizioni nel mondo. Ebbene l’autrice unica di questo testo è Franca. L’ho sempre tenuto nascosto!
C’è in particolare un lavoro o meglio, un monologo, che Franca ha recitato solo qualche volta quest’anno, e di cui bisogna che io vi parli perché è fortemente pertinente alla situazione a dir poco drammatica che io sto in questi giorni vivendo.
Da tempo Franca aveva scoperto l’esistenza di alcuni testi apocrifi dell’Antico Testamento nei quali la Genesi è raccontata in termini e linguaggio molto diversi da quelli cosiddetti canonici.
Attenti, non sto parlando dei Vangeli apocrifi, ma dell’Antico Testamento... Apocrifo!
Ebbene da uno di questi testi Franca ha tratto un racconto che vi voglio far conoscere, quasi in anteprima. Eccovelo!
Siamo nel Paradiso terrestre. Dio ha creato alberi, fiumi, foreste animali e anche l’uomo. O meglio il primo essere umano ad essere forgiato non è Adamo ma Eva, la femmina! Che viene al mondo non tratta dalla costola d’Adamo ma modellata dal Creatore in un’argilla fine e delicata. Un pezzo unico, poi le dà la vita e la parola. Il tutto “prima” di creare Adamo; tant’è che girando qua e là nel paradiso Eva si lamenta che... della sua razza si ritrovi ad essere l’unica, mentre tutti gli altri animali si trovano già accoppiati e addirittura in branco. Ma poi eccola incontrare finalmente il suo “maschio”, Adamo, che la guarda preoccupato e sospettoso. Eva vuol provocarlo e inizia intorno a lui una strana danza fatta di salti, capriole e grida da selvatica... quasi un gioco che Adamo non apprezza, anzi prova timore per come agisce quella creatura... al punto che fugge nella foresta a nascondersi e sparisce; ma viene il momento in cui il Creatore vuole parlare ad entrambe le sue creature, umane. Manda un Arcangelo a cercarli. Quello li trova e poi li accompagna dinnanzi a Dio in persona.
L’Eterno li osserva e poi si compiace: “Mica male! mi siete riusciti... E dire che non ero neanche in giornata... ! Voi non lo sapete perché ancora non ve l’ho detto ma entrambi siete i proprietari assoluti di questo Eden! E sta a voi decidere cosa farne e come viverci. Ecco la chiave. E gliela getta. Vedete, qui ci sono due alberi magnifici (e li indica), uno – quello di sinistra – dà frutti copiosi e dal sapore cangiante. Questi frutti, se li mangiate, faranno di voi due esseri eterni. Sì, mi rendo conto che ho pronunciato una parola che per voi non ha significato: eternità... Significa che avrete la stessa proprietà che hanno gli angeli e gli arcangeli, vivrete per sempre, appunto in eterno! A differenza degli altri animali non avrete prole, perché, essendo eterni, che interesse avreste di riprodurvi e generare uomini e donne come voi, della vostra razza? L’altro albero invece produce semplici mele, nutrienti e di buon sapore. Ma attenti a voi, non vi consiglio di cibarvene! E sapete perché? Perché non creano l’eternità... ma in compenso, devo essere sincero, grazie a loro scoprirete la conoscenza, la sapienza e anche il dubbio.
Ancora vi indurranno a creare a vostra volta strumenti di lavoro e perfino macchine come la ruota e il mulino a vento e ad acqua. No, non ho tempo di spiegarvi come si faccia, arrangiatevi da voi. ... tutto quello che scoprirete; e ancora queste mele, mangiandole, vi produrranno il desiderio di abbracciarvi l’un l’altro e di amarvi... non solo, ma grazie a quell’amplesso, vi riuscirà di far nascere nuove creature come voi e popolare questo mondo. Però attenti, alla fine ognuno di voi morirà e tornerà ad essere polvere e fango. Gli stessi da cui siete nati.
Pensateci con calma, mi darete la risposta fra qualche giorno. Addio.

No. Non c’è bisogno di attendere, Padre Nostro! – grida subito Eva – Per quanto mi riguarda io ho già deciso, personalmente scelgo il secondo albero, quello delle mele. S devo essere sincera, Dio non offenderti, a me dell’eternità non interessa più di tanto, invece l’idea di conoscere, sapere, aver dubbi, mi gusta assai! Non parliamo poi del fatto di potermi abbracciare a questo maschio che mi hai regalato. Mi piace!!! Da subito ho sentito il suo richiamo e mi è venuto un gran desiderio di cingermi, oh che bella parola ho scoperto cingermi!, cingermi con lui e farci... come si dice?! Ah, farci l’amore! So già che questo amplesso sarà la fine del mondo! E ti dirò che, appresso, il fatto che mi toccherà morire davanti a tutto quello che ci offri in cambio: la possibilità di scoprire e conoscere vivendo... mi va bene anche quello. Pur di avere conoscenza, coscienza, dubbi e provare amore... ben venga anche la morte!
Il Padreterno è deluso e irato quindi si rivolge ad Adamo e gli chiede con durezza: “E tu? ...che decisione avresti preso? Parlo con te, Adamo sveglia! Preferisci l’eterno o l’amore col principio e la fine?” E Adamo quasi sottovoce risponde: “ Ho qualche dubbio ma sono molto curioso di scoprire questo mistero dell’amore anche se poi c’è la fine"." Dario Fo

See the original article >>

Butterflies at the Altar - Arson at the Fed

by Market Anthropology

We continue to find ourselves walking in a strange parallel universe exploring the flip side of the long dollar / short euro thesis and wondering if a material pivot lower in the dollar is upon us. Could it just be nerves before a major breakout in the dollar materializes? Perhaps. We have watched these forces come together for some time - butterflies at the altar would be nothing new with these prospective nuptials. And while it has been quite good for us to have a strong read on the dollar and the euro's next move and see the kinetic potential throughout the commodity and currency markets - we recognize cracks forming in the relative strength of the dollar and conversely pressure building within the euro. We also have watched (actually foresaw) as corners of the commodity market - such as the gold miners relative to gold itself - have made an important turn higher this week.  

Click to enlarge image

Further buttressing the case against the dollar - and as we have noted over the past few weeks - silver appeared coiled with underlying upside momentum. In perhaps a first since its large pivot lower in May 2011, the euro's relative strength to silver may be result of a correlation divergence. The conviction of the jury is still out, but if we played devil's advocate to the asset relationship - that's how we would see it. 
The US dollar index comparative that we have utilized quite closely has provided an excellent road map of the dollar's potential and pivots - and a contrasting backdrop to the last time the index broke aggressively higher in 1997. What we have recently seen and pointed out is a notable divergence in the relative strength of the index as it consolidated and broke higher over the past several weeks. In terms of expectations of performance of trend - it's come up short.

Click to enlarge image

You will often find with useful comparative wave or cycle analysis the assets acutely correlate coming through a major pivot structure and volatility event - then closely trend coming out, before eventually diverging as either the analog or current market walks outside of what would be characterized as normal distribution. I have compared it in the past to lobbing a rock into a pond, whereas, the geometry of the disturbed surface will replicate with great congruency at the point of entry and dissipate as you move further away from the epicenter of disturbance. Granted, when the comparison is of the same asset you may also encounter and provide similar kinetic intermarket turbulences at the respective pivots. What we may be witnessing with the dollar - and as I pointed to last week is the trend stalling out and another trip lower through the range.

"With only a few sessions remaining in May - the US dollar index is marginally holding above it monthly breakout ~ 83.50. As we see it, the risk here for dollar bulls and precious metals bears (both of which we have helped chair the Departments since April of 2011) - is the dollar becomes exhausted and similar to 1994 takes another trip lower through the range. All things considered - we still like the dollar, but remain vigilant and open to an audible lower for a spell." Between Mosquitos & Cicadas

Click to enlarge image

Click to enlarge image

Just as the dollar showed significant positive "pressures" in early February (as expressed in the relative strength of the move), the euro is now potentially sitting on similar forces.

Click to enlarge image


Click to enlarge image

What's also interesting here and potentially worthy of extrapolating a bit of past drama - is similar to the failed breakout drive by the dollar in 1994 - the Treasury market soon followed lower with prejudice when the Fed began raising interest rates. Today, the catalyst for the Treasury market blaze appears to be arson as well; motivated by a Fed perhaps uneasy at the pace and character of risk appetites and boxed in by greater transparency and somewhat conflicting data. I suppose the strange silver lining is a little inflation caused by a slouching dollar here wouldn't exactly be the worst thing in the Fed's eyes as inflation data continues to surprise to the downside.

Strange bedfellows indeed - although par for this marriage.

See the original article >>

Follow Us