Thursday, February 23, 2012

A Golden Buying Opportunity


The lightness of the correction in gold is very bullish for the metal as well as its ETF vehicles, and as this drought ends, the next big leg up may soon begin.
The two-week pullback in gold futures from the early February highs was very mild, as it also was in the most popular gold ETFs .
With less than a 3% correction from the highs, last week’s close suggested that the correction might be over. Tuesday’s strong opening and the close above the recent swing high supports this view.
The weekly and daily chart formations have indicated for several months that the drop from the early September highs was just a pause in the uptrend. Thesecontinuation patterns are one of my favorite formations to trade.
The completed flag formations on both the futures and ETFs have initial upside targets well above the September 2011 highs. Therefore, the two key gold ETFs, the Spyder Gold Trust (GLD ) and the iShares Gold Trust (IAU ), both look attractive for new purchases, as the recommended stops make the risk very manageable.
chart

Click to Enlarge
Chart Analysis: The weekly chart of the gold futures shows the completion of the flag formation (lines a and b) in the latter part of January.
  • The tight weekly ranges and triple “dojis” made a deeper correction less likely
  • Once above the 2011 highs at $1,942, the 127.2% upside target is at $2,035
  • As I noted in my article on longer-term Fibonacci projections, the next “major target is $2,274”
  • The weekly on-balance-volume (OBV) closed last week very strong, as it shows a bullish zig-zag formation
  • The weekly OBV is leading prices higher, even though the daily OBV (not shown) is still below its WMA
  • There is short-term support for the April futures at last week’s low of $1,706, with more important levels at $1,652
The daily chart of the Spyder Gold Trust (GLD ) shows the completion of the flag formation, lines d and e.
  • There is near-term chart resistance at $173.80, and then further levels in the $175.40 area
  • The flag formation has a 127.2% Fibonacci retracement target in the $196 area
  • The daily OBV confirmed the price breakout as it overcame its downtrend, line f. The OBV is still below its WMA but has turned higher
  • Short-term support now sits at $170.75 to $169.50, with more important levels at $166
  • GLD’s recent correction held well above the 38.2% Fibonacci retracement support at $162.40, as the recent low was $166.17
  • The breakout level (line d) and stronger support in the $158-$162 area
chart

Click to Enlarge
The hourly chart of GLD shows the completion of the “flag formation” (lines a and b) with the gap higher opening Tuesday.
  • This formation has a short term 127.2% Fibonacci retracement target at $172.60
  • The hourly OBV confirmed Tuesday’s price action as it overcame the resistance at line c
  • The gap support is now in the $168.33 to $169.59 area
Investors should also consider the iShares Gold Trust (IAU ) which has a slightly lower expense ratio than GLD. The daily chart shows that after completing the flag formation, lines d and e, the pullback has also been slight.
  • There is next resistance in the $17.60 area, and then at the September high of $18.63
  • The 127.2% Fibonacci price target is at $17.68
  • The daily OBV has turned up and a move back above its flat WMA will confirm that the correction is over
  • There is minor support now at $16.60-$17 with stronger at $16.30
What it Means: The shallowness of the correction in gold and the gold ETFs is typically very bullish, as it suggests that prices can accelerate to the upside from current levels.
The previously recommended buying zones were not hit, and stops not under the recent lows should hold.
How to Profit: For the SPDR Gold Trust (GLD ), go 50% long at $170.44 and 50% long at $169.12, with a stop at $164.88 (risk of approx. 2.9%).
For the iShares Gold Trust (IAU ), go 50% long at $17.08 and 50% long at $16.86, with a stop at $16.32 (risk of approx. 3.8%).

Sunday, February 19, 2012

Stock Market SPX Uptrend Topping


The market gapped up on monday. Then after a pullback on tuesday, it made three consecutive new uptrend highs the following three days. For the week the SPX/DOW were +1.3%, and the NDX/NAZ rose 1.6%. Economic reports for the week were heavily biased to the upside. On the uptick: retail sales, business inventories, export prices, the NY/Philly FED, capacitiy utilization, the NAHB index, housing starts, the CPI/PPI, the WLEI, the monetary base, and weekly jobless claims improved. On the downtick: import prices, industrial production, building permits and the M1 multiplier. Overall it was a fairly solid week for stocks and the economy. Next week we’ll get reports on Existing/New home sales and Consumer sentiment.
LONG TERM: bull market
It does appear, at least to this observer, many have joined the bull market camp and are expecting, at best, small pullbacks along the way as the market works its way higher. Not surprisingly, this is exactly what the market has done for the past three months. We are thinking, however, this market may have other plans for the medium term. Every one to three months, since this bull market began in March 2009, this market has experienced a significant pullback, if not a correction. While we do not see the technical deterioration which usually occurs before corrections. We do see a short term wave count that suggests the uptrend is nearing a conclusion. More on this later.
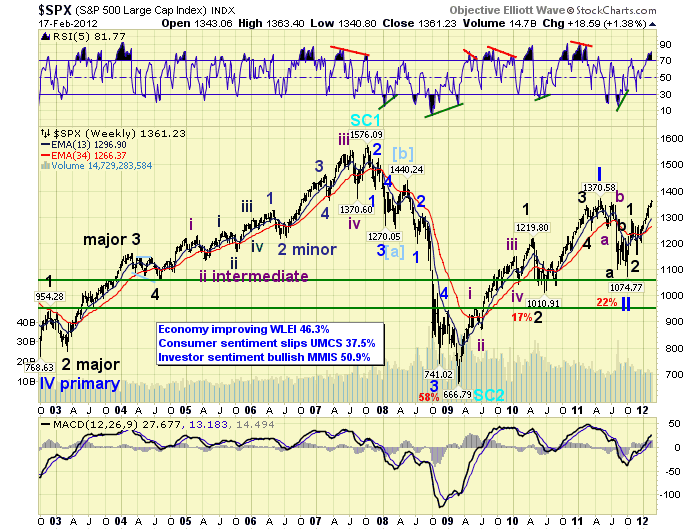
We continue to label this bull market as a five Primary wave Cycle wave [1]. The last time a Cycle wave [1] occurred in the US stock market was between 1932-1937. Right after the 1929-1932 crash. Thus far, Primary wave I rose from Mar09 at SPX 667 to May11 at SPX 1371. Then Primary wave II unfolded in an elongated flat into the Oct11 low at SPX 1075. We are currently in Primary wave III. Since rising Primary waves divide into five Major waves, as illustrated by the five Major waves of Primary I, we are currently counting Major waves 1 and 2, of Primary III, completed in Oct 11 at SPX 1293 and Nov11 at SPX 1159 respectively. We are currently in Major wave 3.
The technicals on the weekly chart, as well as many other technicals, continue to confirm this scenario. The MACD is now well above neutral, which only occurs during bull markets. And, the RSI is now quite overbought, which also occurs only during bull markets. Before this bull market ends it is likely to approach, or even exceed, the Oct 2007 SPX 1576 high.
MEDIUM TERM: uptrend high SPX 1363
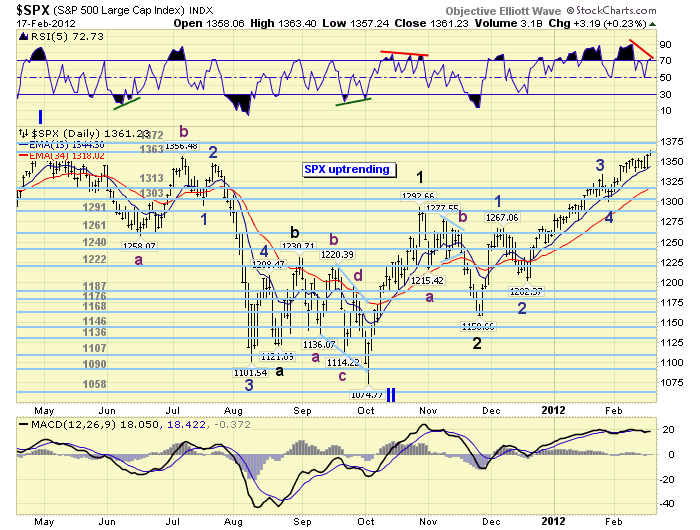
The current uptrend, which started in November at SPX 1159, we have been counting as Intermediate wave i of Major wave 3. Every rising Major wave, during a bull market, divides into five Intermediate waves. Thus far we can count five Minor waves up from that low as noted on the daily chart. While Minor wave 4 looks small in comparison to Minor wave 2. That pullback was the second largest of the entire uptrend. Minor waves, of course, are the subdivision of Intermediate waves.
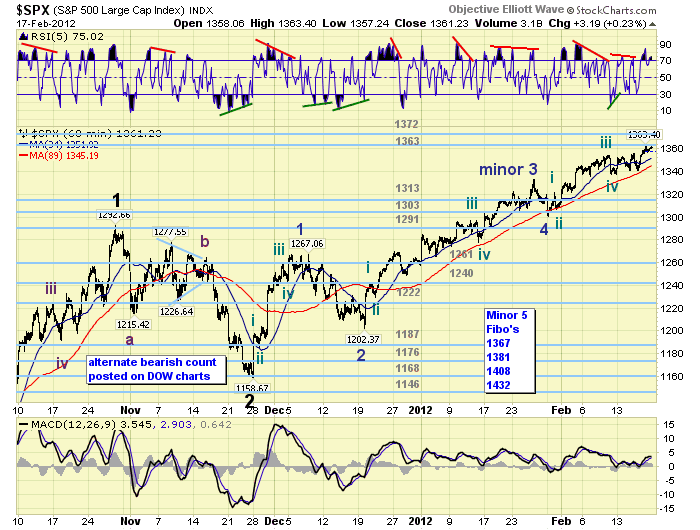
After the Minor wave 4 low at SPX 1300, we calculated some fibonacci relationships for the waves within this uptrend, and arrived with the following: at SPX 1367 Minor 5 = 0.618 Minor 1, at SPX 1381 Minor 5 = 0.618 Minor 3, at SPX 1408 Minor 5 = Minor 1 and 0.618 Minor waves 1 – 3, and at SPX 1432 Minor 5 = Minor 3. Also, this uptrend equals the Major wave 1 uptrend at SPX 1377. Since the three lower figures fell within our 1361, 1372 and 1386 pivot range we considered this zone to be significant resistance for this uptrend. Should the market clear it, then we would be looking at SPX 1408 and then the OEW 1440 pivot. However, we are seeing a negative divergence starting to unfold on the daily charts. This usually occurs as uptrend tops unfold.
SHORT TERM
Our short term count displays the five Minor waves, with each rising Minor wave subdividing into five Minute waves. Notice Minor 1 had a short Minute i and v and an extended Minute iii. Then Minor 3 had only a short Minute i, and an extended Minute iii and v. Minor wave 5 appears to be acting like Minor 3 but on a smaller scale.
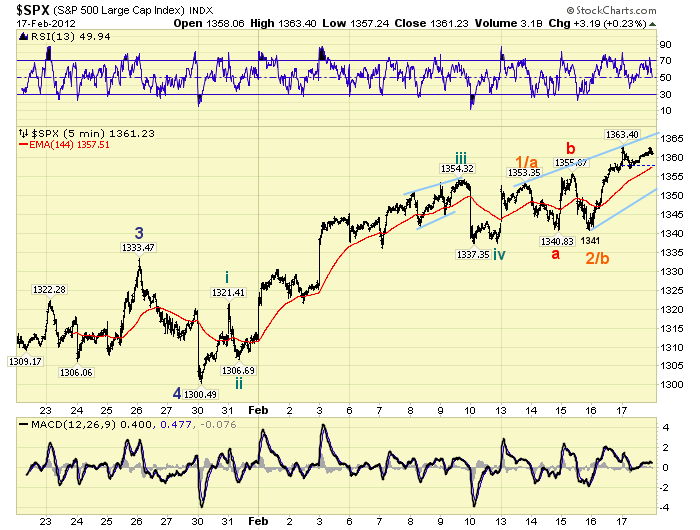
When we take a closer look at Minute wave v of Minor 5 we see two potentials. First, the market rallied from SPX 1337 to 1353 completing a Micro wave 1. Then pulled back in an irregular flat at SPX 1341 for Micro wave 2. And, now it is in Micro wave 3. Second, the SPX 1353 high was a wave A, the 1341 low a wave B, and the current rally wave C of an ongoing diagonal triangle. If this market continues to rally, then the diagonal scenario will be eliminated. However, if the market has a significant pullback into the low 1350′s, then rallies. The diagonal could end on the next new high. Early next week should gives us some indication of what is next.
FOREIGN MARKETS
The Asian markets were mostly higher gaining 1.9% on the week. All are uptrending.
The European markets were mostly higher gaining 1.2% on the week. All uptrending.
The Commodity equity group were all higher gaining 2.4%. All uptrending.
The DJ World index is uptrending and gained 1.5% for the week.
COMMODITIES
The Bond uptrend is beginning to weaken a bit as bonds lost 0.4% on the week.
Crude is uptrending again gaining 5.2% on the week.
Gold continues to consolidate in its uptrend gaining 0.1% on the week.
The USD is trying to reverse its downtrend, gaining 0.3% on the week.
NEXT WEEK
A holiday shortened week as monday is Presidents day. On wednesday Existing homes sales will be reported. Then on thursday, weekly Jobless claims and FHFA housing prices. Then on friday, Consumer sentiment and New home sales. The FED has nothing scheduled. Best to you and yours this extended weekend and week.

Thursday, February 16, 2012

Orange juice volatility, not what you think

Trading Places
Trading Places (Image via RottenTomatoes.com)


It is New Year’s Eve. The Harrisburg Express speeds from Philadelphia to New York City. It thunders down the rails carrying passengers Inga from Sweden, Naga Eboko from Cameroon, Lionel Joseph, an Irish priest, a gorilla and Beeks, with his briefcase. The case contains the crop report for orange juice.

Possibly every single reader of Futures can remember every major scene from the iconic movie "Trading Places." Indeed, it made many of us take up trading futures and commodities. We’ve all likely said some variation of the great line: "Pressure? Here it’s kill or be killed. Make no friends and take no prisoners. One minute you’re up half a million, the next — boom! — your kids don’t go to college and you’ve lost the Bentley!"

"Trading Places" culminates in a wonderful scene in the frozen concentrated orange juice futures pit in New York. Back in the old days, all trading was pit trading. It was hectic and exciting. How exciting? There were times in the 1980s when, in an effort to get an edge, the runners were on roller skates.

The upshot in the movie was the main characters, Winthorpe and Valentine, waiting until Wilson drove the price of orange juice way, way up. They then sold into the market, the Secretary of Agriculture announced the real crop report and the price plummeted. Our heroes cover their shorts and make millions, putting the Dukes into the poorhouse at the same time. It’s a fun story that defined trading for a generation. The movie never gets old.

It also has some good lessons, particularly for the orange juice trader. One topic is the issue of volatility and some widely held beliefs. Does orange juice really swing wildly in January because of the crop report? More important, if such volatility does exist, can we use it to our benefit?

To answer these questions, the monthly range of orange juice prices was recorded starting with January 1996. The monthly range is defined as the high price of the month minus the low price. The closing prices were disregarded for the purposes of this test. Through Nov. 30, 2011, there were 191 pieces of data. The highest trade during the sample period was $2.0940, observed during the month of March 2007. The lowest price paid was $0.5420 in May 2004. The range of the orange juice contract, therefore, is $2.095 – $0.542, or $1.553. In percentage terms, the high is an increase of 286.7% over the low price.

In performing this test, it is important to make uniform comparisons. A 10¢ range with a low of 70¢ is not the same as a 10¢ range when the market is trading at $1.65. The former is a 14.28% range, which is far more volatile than the 6.06% range of the latter. Consequently, all of the range values were converted into percentages by dividing the range by the low price to normalize them across the sample universe. With these data, it now is possible to construct a meaningful statistical test.

If the calendar plays a significant role in orange juice price volatility, we would expect certain months to have much more volatility than others. To test this, we use an Analysis of Variance with an F-test statistic. The null hypothesis is, there is no effect.

For those whose statistics knowledge is a bit rusty, the F test examines different dependent values and assumes there is no significant difference between them based upon the observation of independent values. In other words, all of the fixed variables (that is, the different calendar months) will produce essentially the same dependent observations (that is, the average volatility during the month). The null hypothesis of the test is there will be no statistically significant difference between the mean volatilities of any of the months. The alternate hypothesis is that, yes, there is. Although the F statistic measures the variance, if the variance is low, it follows the means are essentially similar. If the variance is high, the mean volatility must be significantly different among the 12 months.

The Analysis of Variance test has 12 independent variables and 16 observations in each month. (Although December is missing for 2011, it is easy to perform this slightly unbalanced test using any statistical software package.) The F statistic will have 11 and roughly 180 degrees of freedom. This is a powerful test for discovering patterns, and we can have much confidence in its results.

The average volatility for each month is shown in "O.J. monthly" (below). The results of our Analysis of Variance test was p<0.00001. Essentially, there is virtually no significant chance that the means of the months are equal. We can conclude with great confidence that the calendar does indeed play a major role in the average volatility experienced in the orange juice market over time.

Click to enlarge

It is essential to realize that this does not prevent high volatility from taking place in any month. The test simply compares the averages and finds there is more variation between the months than within the given months.


In a blow to Hollywood, and perhaps running against the assumptions of most orange juice traders, the "Trading Places" months of December and January were not the top of the volatility list. Examining the table, it is easy to discern that October, August, January and December experience greater than average volatility, but October is much higher than December. Those four months account for 17.17% of the volatility of the orange juice market.

March, April and November are relatively quiet months by comparison, experiencing only 12.3% of the volatility. It may be concluded that the best trading opportunities are likely to be presented when volatility is greatest. It might also be concluded that the greatest risk occurs at those times as well. Short-term traders might find lots of trading opportunity in orange juice during October or August. March and April may be too quiet, but also present less risk.

On average, volatility throughout the year is 14.64%. As a side note, we can examine if extremely low volatility has been a harbinger of any movement. Indeed, it turns out it is, statistically speaking. When volatility in any month dropped below 7.25%, the market often changed direction within the three months thereafter. Often, the low volatility immediately preceded a major market shift.

For example, in December 2006, the monthly low was $1.96 and the high was $2.0940 (see "Calm before the storm," below). This range of 13.4¢ was only a 6.8% swing for the month. Given December is expected to be a pretty wild month, the volatility was less than 45% of what we might normally see. January 2007 saw a major drop in the market, with volatility falling to 13.35%. The all-time high was hit only two months later in March 2007, and then the orange juice market dropped precipitously, falling to $1.1060 in the next six months.


Similarly, in April 2004, the volatility dropped to 4.42% and the market low for the month was $0.5580. The following month, orange juice bottomed at $0.5420 before beginning its wild climb into the 2007 high. Several other examples of such predictive low-volatility activity may be found.

The lessons of the orange juice market may be extrapolated to other markets and shorter time frames. The trader easily can test different hours of the trading day to see if certain periods present higher volatility than others. Similarly, it may be tested to see if sudden contraction in the range of any time bar vs. its historical norm predicts a sudden change in market direction. After all, the goal, as Valentine and Winthorpe say at the end of the movie is: "Looking good; feeling good!"

See the original article >>

Saturday, February 11, 2012

High Yield Plummets and VIX Flares Most In Almost 3 Months


Credit (and vol) continue to lead the way as smart deriskers as ES (the e-mini S&P 500 futures contract) ends down only 0.5% - which sadly is the biggest drop since 12/28. The late day surge in ES, which was not supported by IG or HY credit (and very clearly not HYG - the HY bond ETF - which closed at its lows and saw its biggest single-day loss since Thanksgiving), saw heavier volumes and large average trade size which suggest professionals willing to cover longs or add shorts above in order to get filled. Materials stocks underperformed but the major financials had a tough day as their CDS deteriorated to one-week wides. VIX (and its many derivative ETFs) had a very bumpy ride today. VXX(the vol ETF) rose over 14% (most in 3 months) at one point before it pulled back (coming back to settle perfectly at its VWAP so not too worrisome). After the European close, FX markets largely went sideways with the USD inching higher (EUR weaker) as JPY strength reflected on FX carry pair weakness and held stocks down. Treasuries extended their gains from yesterday's peak of the week yields as 7s to 30s rallied around 6bps leaving the 30Y best performer on the week at around unchanged. Commodities generally tracked lower on USD strength with Oil the exception as WTI pushed back up to $99 into the close (ending the week +1.1% and Copper -1.1%). Gold and Silver ended the week down almost in line with USD's gains at around 0.25-0.5%. Broadly speaking risk has been off since around the European close yesterday and ES andCONTEXT have reconverged on a medium-term basis this afternoon (to around NFP-spike levels) as traders await the potential for event risk emerging from Europe.
As we warned yesterday, the significance of the divergence with credit in Europe and US was becoming palpable and the Storm that we noted was coming has begun we suspect. Stocks managed to cling to the cliff-edge that is the post NFP spike levels while credit has fallen significantly below pre-NFP levels. No follow through at all in credit on that late day surge in stocks and HYG seeing its single worst day since just before Thanksgiving (chart below).
Let's see how many investors who reached for yield stick with them when they realize that a third to a half of their annual yield just got taken away in 2 days - as we've said before, there is a reason they have a high yield.
VXX (the Vol ETF) was very volatile today as VIX (above) saw its largest jump in three months - as many know this is very typical VIX behavior, slow leak down and abrupt flare-up. We suspect the implied skewness and kurtosis discussions we had earlier in the week are being laid again after normalizing.
Treasuries roared back to life late yesterday and through today as supply ebbed and risk appetites dropped. 10Y seems the most volatile - perhaps on its mortgage hedging exposure - but 30Y outperformed on the week - ending just a little higher in yield.
The USD pulled back towards unchanged today after reaching its lows for the week just around the European close yesterday. Day after day we have seen the most volatility during the European day session with reversals into and around the closes and opens. After hours today EUR is pushing modestly higher on news that the Greek cabinet has approved loan plan but it is staying under 1.32 for now. JPY was the biggest loser on the week though stable as the USD strengthened against the other majors - this carry-pair impact dragged broad risk assets lower - though chatter is that a rotation to the EUR as a funding currency is occurring though we suspect the binary nature of the currency makes it a little too noisy for the risk-sensitive players.
To get a sense of how broad risk assets have been behaving this week we use a medium-term (as opposed to the short-term model that is used for trading and arb) CONTEXT - which as you can see is well synced with last week's pre- and post-NFP behavior. The whole week has seen a very narrow range for US equities that again and again has seen CONTEXT (broad risk asset proxy) and stocks converge around that post NFP spike level (green oval). Monday saw a broader derisking among risk assets but US equities maintained into Tuesday where Oil and Treasuries led risk-on and the faded to convergence. The sell-off and curve steepening in Treasuries along with Oil strength and FX carry all helped to push CONTEXT aggressively higher but the divergence lower in the latter part of the week reflects back to credit's underperformance dragging on stocks. Today saw Treasuries rally, curves flatten, and carry lose ground as non-equity risk assets fell back to earth and reconverged with stocks for pretty much the entire day session today in the US.
On the late-day news from Greece, Treasuries are modestly higher in yield, EUR (and carry) is modestly higher and CONTEXT is leading for now (as ES is closed) suggesting a 3-5pt bounce only. It will be along weekend.

Follow Us