Monday, June 17, 2013

The U.S. Economy and Peak Capacity Utilization

By Walter Kurtz

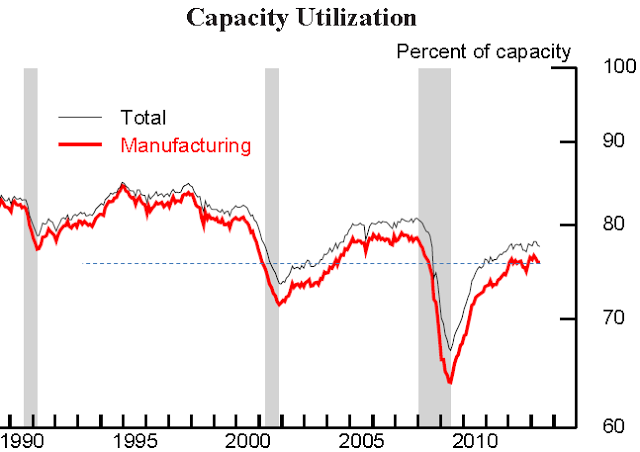
In another sign of recent weakness in the manufacturing sector, capacity utilization in the US has stalled, as demand remains soft. US industries are producing significantly below their capacity and “5.5 percentage points below long-run average” according to the Fed. We are certainly far under the 82-85% level at which economists believe that the traditional measures of inflation are expected to rise (see figure 1).

24/7 Wall St.: – … [US] manufacturing base still matters, as the United States remains one of the top exporters in the world. And a disturbing trend may be forming that signals some underlying weakness in the old core economy. This could be bad news for employment, growth, exports, revenue, capital spending and just about everything else.

Industrial production came in flat for the month of May rather than a 0.2% expected gain. The reading on capacity utilization posted an unexpected drop to 77.6%, versus a Bloomberg expectation for a 0.1% gain to 77.9%. To make matters worse, the 77.8% from April was revised to 77.7%. The peak cycle was 78.3% in March, which makes things look even worse.

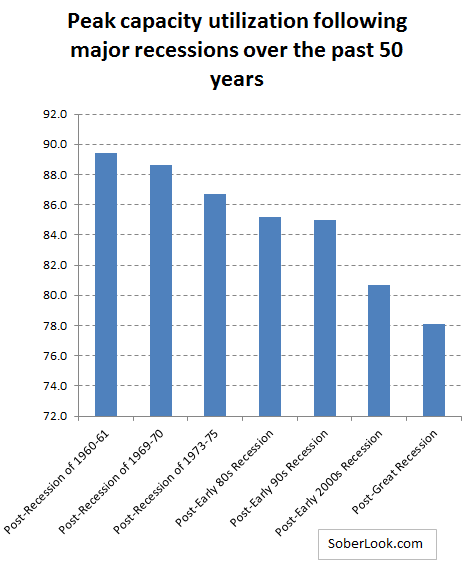
Moreover, the long-term trend in capacity utilization in the US shows a secular decline. After each major recession over the past 50 years, capacity utilization peaked at a lower level than after the previous recession (see figure 2). So far in the post-Great Recession recovery, this trend has not been violated, as the nation struggles from chronic excess capacity.

Capacity Utilization

(Figure 1 – Capacity Utilization)

Peak capacity utilization

(Figure 2 – Peak Capacity Utilization)

See the original article >>

Morgan Stanley, USDA give comfort to soybean bulls

by Agrimoney.com

Farm officials cautioned over expectations of a large switch in US corn area to soybeans even as Morgan Stanley offered supportive comments too for prices, flagging the need to preserve "critically tight" supplies.

The somewhat bullish comments contrast with bearish outlooks from many other observers, including Goldman Sachs and Societe Generale, which last week cut forecasts for soybean prices, besides Deutsche Bank.

The US Department of Agriculture acknowledged the tendency of farmers in wet springs to reallocate area they have been unable to sow with corn to soybeans, which can be later seeded.

"Farmers who were unable to finish planting corn by early June will consider switching to soybeans, which has been a common pattern in other years with similarly wet conditions," the USDA said in follow-on comments from last week's Wasde report on world crop supply and demand.

Indeed, many analysts had expected the USDA, in the Wasde, to lift its estimate for soybean sowings, given the extent of corn planting delays, with the market on average foreseeing a 688,000-acre upgrade to 77.8m acres, according to a Reuters poll.

Linn Group forecast a 79m-acre figure with rival broker Allendale, while saying it was too early yet for a USDA upgrade, believing that the figure will end up at 78.9m acres.

'Drying must develop soon'

However, the USDA highlighted the difficulty that growers are having in sowing soybeans too, saying that "some drying must develop soon for any expansion of soybean planting from farmers' intentions in March", pointing out that crop insurance deadlines have passed for many areas, and imminent in the rest.

"Crop insurance policies sold in the Midwest have final planting dates that generally extend through the second or third weeks of June.

"Benefit levels for crops planted beyond those dates are reduced daily."

In fact, planting conditions appear improved this week, with Mike Mawdsley at broker Market 1, based in Iowa where sowings have suffered particular rain delays, noting that "the outlook is for warmer and drier weather this week. We need it".

'Slowed to a crawl'

If the USDA comments implied support for new crop soybean prices, Morgan Stanley gave vocal backing for old crop futures, despite the apparent headwind to values from an uptick in South American shipments.

Indeed, the USDA, which in its Wasde trimmed the forecast for US exports in 2012-13 by 20m bushels to 1.33bn bushels, said that shipments "have slowed to a crawl, currently averaging 3m-5m bushels a week.

"For most import markets for soybeans, US prices will not be competitive with South American shipments until next fall's new crop harvest."

'Prices may still need to move higher'

Morgan Stanley acknowledged that "Brazil has finally hit its stride" in soybean export, shipping a record 7.9m tonnes in May, a gain of 9% year on year, as the impact of logistical bottlenecks waned.

"This influx of new supply is starting to have an impact on US exports," which, at 21m bushels last month, fell 80% year on year.

However, the bank said that it did "not view the US export weakness as overtly bearish.

"Rather, it is necessary to preserve critically-tight US stocks.

"With cumulative US export sales already topping the USDA's full-year export forecast of 1.33bn bushels, we expect near-dated soybean prices may still need to move higher to discourage the shipment of the full US export commitment."

Morgan Stanley maintained soybeans as the bank's most bullish bet, foreseeing prices averaging $14.90 a bushel this year and $13.00 a bushel in 2014.

See the original article >>

Futures Ramp Higher Ahead Of Key FOMC Announcement As Nikkei Regains 13,000

by Tyler Durden

First it was the "most important" payroll print in years, then the "most important" retail sales number, and now we are just days ahead of the "most important" FOMC statement in years as well, as the fate of the centrally-planned markets lies in the hands of Bernanke's decision to taper, or not to taper. The main catalyst for now still appears to be an ongoing wrong interpretation of Hilsenrath's Thursday blog post in which some still see reaffirmation by the Fed that it won't taper, when all the Fed's mouthpiece said is that the short-end would be anchored even as the long-end is allowed to rise. Looking at the well-known no volume levitation futures action, which in the overnight session has wiped out all of Friday's losses and then some simply due to a 2.73% rise in the Nikkei overnight back above 13,000 driven by the USDJPY briefly regaining 95.00, the market has made up its mind (if only for the time being) that whatever decision the Fed takes regarding the monthly level of liquidity injection is a bullish one. At least until it changes its mind next.

Speaking of Hilsenleaks, the WSJ’s "Fed watcher" was back on the newswires on Sunday evening suggesting that the evolution of these forecasts could provide a strong clue as to the Fed’s tapering intentions. The Fed’s latest projections, made in March this year, saw real GDP growth of around 2.6% for 2013 and 3.2% for 2014. In terms of unemployment, the Fed projected a rate of around 7.4% in 2013, improving to around 6.9% in 2014. If and how these forecasts change could send an important signal about the Fed’s near term intentions. Hilsenrath writes that if the Fed maintains confidence in their economic forecasts, it could signal they think they're on track to begin pulling back on QE later this year.

Heading into the North American open, stocks in Europe are seen broadly higher, with telecoms and industrial sectors leading the gains. The Italian benchmark stock index has underperformed, with Saipem shares trading sharply lower, which in turn weighed on its major shareholder ENI after the company cut its EBIT guidance (again) due to significant deterioration in its Algeria business. The session so far has been characterized by distinct light volumes as market participants refrained from making directional bets ahead of the key FOMC meeting. On that note, Fed watcher Hilsenrath wrote that officials at the Fed are unlikely at this meeting to change their USD 85bn per month bond buying program and that what they say about the economy will send important signals about what they expect to do in the future. Looking elsewhere, overnight in Asia the Nikkei 225 index settled with decent gains and crucially above the key 13,000 level as the USD/JPY edged back towards the 95.00 level. However, a firmer spot failed to support the price action in the options market, where the shorter-dated implied vols remained under-pressure. Going forward, market participants will get to digest the release of the latest Empire Manufacturing report, as well as the NAHB report for the month of June.

SocGen looks at the key overnight macro catalysts:

The financial markets have hit some turbulence triggered by uncertainty in the lead-up to the Fed and the ECB releasing their monetary policies.
What will the Fed do? The market's current nervousness, synonymous with possible disturbances given the approach of tapering, could prompt the Fed to postpone any announcements. On the other hand, improving economic indicators appear to confirm the scenario of an exit. The focus should thus be on the FOMC Tuesday and Wednesday, especially since there will be a press conference afterward along with the presentation of the Fed's new forecasts. We doubt that Ben Bernanke would lay all his cards on the table this week.

Meanwhile, Asia is worrisome. Chinese indicators have been lukewarm. In addition, the BoJ's policy is raising more and more questions about its capacity to control the volatility it ignited on JGBs. The government's timid measures announced last week, along with promises of more substantial measures in the autumn, are anything but a bazooka.

Against this backdrop, and as long as uncertainty remains on both fronts, additional profit-taking on previously overbought assets is highly likely. Nevertheless, we continue to believe that this profit-taking phase will end up losing steam.

In all, even if it is chaotic, the uptrend in long-term US rates remains firmly in place: we are not changing our target of a 10-year Treasury yield of 2.75%. As for the forex market, we still think that the USD will strengthen in the second half: the EUR/USD should then be on its way to our year-end target of 1.20 while the USD/JPY should head toward 110.

* * *

Finally, and as usual, Jim Reid does the full overnight event recap:

Strap in, hold on and get ready for what the market has turned into a crucial two-day FOMC meeting and subsequent Bernanke press conference on Wednesday. If that's isn't enough to get you excited then we also have the G8 leaders' summit today and tomorrow and the latest flash PMIs from around the world on Thursday.

Back to Bernanke, it’s worth being aware of what we've heard from the Fed over the last month and what the market has reacted to. In the recent JEC testimony (May 22nd) Bernanke continued to emphasise ongoing labour market weakness. However in the subsequent Q&A he said tapering “could” happen before Labor Day after responding to a question. The market pounced on this comment even if that maybe wasn't Bernanke's intention. However this reaction was in some respects supported by the FOMC minutes from the May 1 meeting, (also released on May 22nd). They were surprisingly hawkish and showed that a "number of participants expressed willingness to adjust the flow of purchases downward as early as the June meeting if the economic information received by the time showed evidence of sufficiently stronger and sustained growth”. So there is definitely some debate within the Fed but the data 6 weeks on from this meeting is still inconclusive. We suspect that this week Bernanke will continue to say tapering will happen at some point, could happen this year but will be data dependant and that we are still a long way off from removing the very easy policy stance the Fed has in place. We still think that the Fed will struggle to taper very much and very early but the debate is now going to be around for a while.

This week’s FOMC will also be interesting from the perspective that the Fed will be providing an update on economic projections for 2013-2015. Indeed, the WSJ’s Jon Hilsenrath was back on the newswires on Sunday evening suggesting that the evolution of these forecasts could provide a strong clue as to the Fed’s tapering intentions. The Fed’s latest projections, made in March this year, saw real GDP growth of around 2.6% for 2013 and 3.2% for 2014. In terms of unemployment, the Fed projected a rate of around 7.4% in 2013, improving to around 6.9% in 2014. If and how these forecasts change could send an important signal about the Fed’s near term intentions. Hilsenrath writes that if the Fed maintains confidence in their economic forecasts, it could signal they think they're on track to begin pulling back on QE later this year.

Turning to overnight markets, Asian stocks are starting the week on the front foot led by an 2.3% and 1.4% gain in the Nikkei and Hang Seng respectively. In Japan, real estate equities (-1.7%) are the only sector in the Nikkei to trade lower. This comes after Reuters reported that the BoJ is considering expanding its REIT asset purchases above its target of JPY140bn, in a sign that the BoJ may be responding to recent market movements (Reuters). However the incremental purchases are said to be relatively small at JPY10bn, which probably explains the disappointing price action in J-REITs this morning. USDJPY is trading 0.5% higher this morning at 94.8. Chinese stocks (Shanghai Composite –0.1%) remain near a six-month low after the Chinese finance ministry failed to sell all of its bonds at an auction on Friday, the first time in nearly two years that it has fallen short of its bond sale target (FT). The failed auction is being blamed on strained liquidity in the interbank funding market. Meanwhile Central Huijin, China's main holding company for state-owned financial institutions, intervened to buy the stocks of two Chinese FIs on Friday in a bid to boost market sentiment.

While the Fed and Bernanke will be taking the limelight this week, we also have a fairly big week of economic data and global/regional summits. First up will be a two-day G8 leaders’ summit commencing today in Northern Ireland. The Fed and the BoJ’s monetary policy are likely at the top the agenda but the meeting will be missing one key figure in the form of Bernanke who is presumably tied up with this week’s FOMC. President Barack Obama and Angela Merkel meet in Berlin on Wednesday following the G8 meeting.

In the US, this week’s data calendar starts with an update on Monday’s empire manufacturing followed by Tuesday’s CPI, housing starts and building permits, and ending with Thursday’s Philly Fed, existing home sales and flash PMI. On the micro-side, it’s also worth watching Fedex’s Q4 earnings report on Wednesday where the company’s outlook is usually scrutinised by markets for signals on near-term demand.

Across the Atlantic, the European data calendar gets off to a slow-ish start with Euroarea April trade (Mon) and the German ZEW survey (Tues) ahead of Thursdays flash PMIs. Consensus estimates are for a PMI composite Euroarea reading of 48.1, or 0.4pts higher than last month’s 47.7. The market is also calling for a 0.3-0.5pt improvement across the German and French manufacturing and service PMIs. The Eurogroup/ECOFIN meeting starts on Thursday with the expected agenda including latest reviews of the Greek, Irish, Portuguese and Spanish loan programs. Across the Channel, Chancellor Osborne is expected to use his annual Mansion House speech on Wednesday to confirm that the government is looking to privatise Lloyds and RBS banks. The BoE’s latest meeting minutes are released on the same day.

We have a quieter week ahead in Japan with May trade data together and the BoJ’s quarterly flow of funds report due on Wednesday. BoJ Governor Kuroda speaks on Friday at the annual meeting of the National Association of Shinkin Banks. In China, HSBC’s flash manufacturing PMI (prev: 49.2) is out on Thursday, following an official update on nationwide property prices on Tuesday.

See the original article >>

Sunday, June 16, 2013

Analysis: Fed-induced selloff has investors hunting for bargains

By Luciana Lopez, Sam Forgione and Gertrude Chavez-Dreyfuss

Federal Reserve Board Chairman Ben Bernanke listens to opening remarks before testifying at the Joint Economic Committee in Washington May 22, 2013. REUTERS/Gary Cameron

NEW YORK | Sun Jun 16, 2013 12:05pm EDT

NEW YORK (Reuters) - Since Ben Bernanke unleashed a bombshell on May 22 by suggesting the U.S. Federal Reserve could before long start to pull back on its massive monetary stimulus, big stock and bond markets have been feeling the pain.

Rather than run for cover, a number of big money managers have seen the sell-off as a chance to invest cash in a broad array of assets at lower prices. They believe the gloom may be overdone, an overreaction to the concerns that the Federal Reserve won't be throwing money at the economy forever.

The U.S. economy has posted solid if still sluggish growth figures this year, and jobs growth has improved. The euro zone debt crisis has abated somewhat, with the monetary union no longer expected to drag so heavily on world growth. And despite the jitters, global central banks are far from ending easy money policies, pumping money into markets around the world.

Traders with big investors like Pacific Investment Management Company and Loomis Sayles & Company are taking advantage of buying opportunities they say they haven't seen in some time, with in-and-out hot money having flushed out of the system.

"We're finding a lot of opportunities coming out of the volatility," said Curtis Mewbourne, managing director and head of portfolio management for the New York office of PIMCO, which manages more than $2 trillion globally.

Bernanke said on May 22 the central bank "could in the next few meetings ... take a step down in our pace of purchases." This sparked an uptick in volatility that hasn't abated as investors recalibrate expectations for low bond yields that have bolstered borrowing and encouraged investors to take risks in other asset classes.

Japan's stock market has lost 19 percent since that day. The 10-year Treasury yield hit a 14-month high last week. The BofA Merrill Lynch U.S. high yield index .MERH0A0 slumped to a three-month low. The benchmark MSCI EM stock index .MSCIEF is down more than 17 percent this year, and the dollar is near a four-month low against a basket of currencies .DXY.

One place Mewbourne is focused is government debt, even though it is the most sensitive to Federal Reserve expectations. He said it is a good time to buy five- and 10-year Treasuries, since he sees yields falling as the Fed hints it has no intention of slowing its stimulus program. He also sees more potential for gains in mortgages not guaranteed by the government.

The Federal Open Market Committee issues its next decision on Wednesday, and recently Fed officials have remarked that inflation is worryingly low, which might prevent them from reducing the $85 billion-per-month bond buying program, known as quantitative easing.

"We think that the Fed will signal to investors that the markets have overly priced in expectations for a reduction in quantitative easing," he said.

OTHER ASSETS WITH HIGHER YIELDS

Among the other assets that big money managers are now eyeing: high-yield debt; industrials and materials stocks; and some emerging market stocks and bonds.

Junk bonds have been feeling the effect of the rise in Treasury yields, with the Bank of America/Merrill Lynch High Yield Master Index losing 2.91 percent from its peak in early May. The past two weeks have seen outflows of nearly $9 billion from high-yield funds, according to Lipper, a Thomson Reuters company.

The 10-year Treasury yield touched 2.29 percent this week, highest since April 2012.

Loomis Sayles, which manages $191 billion, is picking up what it sees as bargains, said Vice Chairman Dan Fuss. The firm bought 30-year Treasuries last week, adding junk bonds "where appropriate" and some investment grade corporate bonds.

"The high yield market has gotten disorderly," he said. "When was the last time you had discounts like this? Yes, we are buying."

Investors have dumped U.S.-based corporate junk bond funds in droves, pulling out a record $4.6 billion in the week to June 5, according to Lipper.

High yield spreads are almost 500 basis points over Treasuries, said Paul Zemsky, chief investment officer for multi-asset strategies and solutions at ING U.S. Investment Management, which has $180 billion in assets under management.

"That represents good value, roughly six-and-a-quarter percent yield," he said. "If you can earn 6.25 percent from a bond, that's not so bad given we expect inflation to be low."

Emerging markets equity funds had outflows of $2.13 billion for the week ended June 12, the largest since February 2011, while EM debt funds had redemptions of $622 million, their third consecutive week of outflows.

"This has set up an attractive valuation picture both short and long term," said Jim McDonald, chief investment strategist, at Northern Trust Asset Management with assets of $810 billion, who said EM stocks are trading at a 22 percent discount to world equities.

The difference in yield between benchmark emerging markets bonds and safe-haven U.S. Treasuries, measured by the JP Morgan Emerging Markets USD Bond Index .JPMEMBIPLUS, rose to 337 basis points on Tuesday, the widest spread in nearly a year. Emerging markets currencies have also been weak of late as money exits countries such as Mexico and Brazil.

Still, a key exposure indicator in EM bonds from Morgan Stanley showed that EM institutional investors have not abandoned the region and were slightly overweight relative to their benchmark at the end of last week.

Managers are a bit less enticed by Japan right now. Investors flocked to Japanese equities in the anticipation that the heavy dose of monetary stimulus would bolster that market, and it has, at one point being up 54 percent in 2013.

However, domestic investors there have sold into this rally, and that has since turned into a full-fledged selloff. The Nikkei is down 19 percent since May 22, but some still questioned whether it was a time to buy. Japanese equities posted outflows for the week ended June 12 for the second straight week after 28 consecutive weeks of inflows.

"We still expect to see good things out of Japan, but that market has gone up so much it's hard to establish new longs," said Zemsky. "I think there are markets that give you better value for your money."

See the original article >>

Will Gold Price Drop to $500?

By: Peter_Zihlmann

A drop of the gold price to $ 500/ounce is highly unlikely in view of the sharply rising National Debt in the USA but also in Europe.

To quote John Hathaway, manager of one of a most respected gold fund, a sharp rise of the gold price is more likely:

"With gold and silver under continued attack from the mainstream media, John Hathaway warned King World News that we are at the point where global investors will be shocked as gold is quickly repriced a jaw-dropping $1,000 higher, taking gold to new all-time highs.

1980 to 2013: From bear to bull

Spot Gold Monthly Chart

Hathaway also cautioned that global markets are rapidly approaching a loss of confidence in central banks which will cause tremendous turmoil in the paper currency markets. Hathaway, of Tocqueville Asset Management L.P., is one of the most respected institutional minds in the world today regarding gold, and his fund was awarded a coveted 5-star rating."

The long-term picture of the bull market since 2001

Spot Gold Weekly Chart

The bull market of the gold price started towards the beginning of 2002. On the way from $ 255.3 to the recent intraday all-time high of $ 1,923.7 (an increase of 650%), several significant corrections took place, the most severe one in 2008 when the gold price sank by 30% only to jump 182% to a new all-time high.

The bull market is not over! The gold price is in an oversold position, as shown above, which is far worse than in 2008 or even in 2000. Such extremes have always been followed by strong movements to the up-side. After 2008, gold rose almost 200% while gold shares jumped 400%.

What the PMO Indicator shown above clearly demonstrates: extremes will always be corrected. In fact, we had great sell opportunities in 2006, 2008 and 2011. On the reverse side, 2001 and 2008 were unique buying opportunities.

At present, we again have such a buying opportunity! This is not the time to stay on the side-lines. You have to buy now!

Should you rather buy gold shares instead of gold?

First, there are a few basic facts that one has to know:

  1. Gold stocks are more volatile than gold.
  2. It is hard work to select the right companies and to monitor them.
  3. You should know the Management.
  4. You should have a long-term view.

As most do not have the time to devote several hours a day

  • to employ a bottom-up selection process and fundamental, proprietary research to identify companies that are considered undervalued, based on growth potential and the assessment of the company's relative value, and
  • to seek exposure to overlooked and undervalued gold stocks across the world,

this work is best left to an experienced fund manager. The following chart reveals the risk and rewards of such investment:

Tocqueville Gold Fund Weekly Chart

Gold sometimes outperform gold shares, at times however gold shares fare much better? Following some figures:

  • GOLD 2000 to 2011 (high): +652%
  • GOLD SHARES 2000 to 2011 (high): +1,331%
  • GOLD 2000 to 2013: +416%
  • GOLD SHARES 2000 to 2013: +514%
  • GOLD 2011 (high) to 2013: -31%
  • GOLD SHARES 2011 (high) to 2013: -57%

Big companies or rather "juniors"?

  • Every big company was once a "junior"! See Goldcorp.!

Goldcorp Weekly Chart

  • Selecting the right "junior" is high risk. It makes therefore sense to choose a Fund that invests in "juniors" to diminish the risk.
  • To find out more, go to www.timeless-funds.com

Conclusion

To quote John Hathaway once more: "So from a contrarian point of view, the setup is perfect for the commencement of a huge upward leg that will take gold and silver to all-time highs."

See the original article >>

Stock Market Longer Trend Weakening, Daily Trend Turning

By: Michael_Noonan

Charts are not predictive in nature, rather they are instructive on how to best prepare and get an edge when deciding to enter into a position, [or exit one]. It is of the utmost importance to have a game plan in place, beforehand, otherwise, one is relying upon factors more emotionally driven than fact driven.

The function of reading a chart is to gain insight from the most reliable source available, the market itself. What a market does is generate information that reflects the outcome of all source decision-makers, from the most highly informed and experienced to the least informed and weakest, with varying degrees of skills in between

We know that "smart money," [a term to describe dominating forces that move a market], is always active at high areas, distributing, and low areas, accumulating, with occasional participation in between. They are deft at hiding their "hand," as it were. However, there are clues they cannot always hide as they leave behind "foot prints," or a trail to follow, if one chooses to do so. The biggest clue comes in the form of volume.

High volume bars, especially at highs, lows, and important market turning points are created by them as they take positions. The other side of their trades are the public and less skilled participants. When you see such high volumes at these turning points, it is usually a transfer of risk from weak hands into strong hands. Rather than guess, predict, or rely upon gut feel, [emotion], it is better to follow their lead because they ultimately are the trend setters, literally.

Clues can always be found in the charts. Last month, May went into new high territory, but the close was mid-range the bar on a strong volume increase. Markets have much more logic than people realize. The increased volume is created by smart money. It is the public that reacts to it, almost always to their eventual detriment.

Applying logic, we see the market is at new highs. It is axiomatic to state that smart money, [SM], sells highs and buys lows, so it is no stretch to infer SM is actively selling at this current high level. The fact that price closed mid-range tells us that sellers were meeting the effort of buyers, sufficiently to keep the close from being higher. The public see price is breakout out, above the previous 2008 swing high, so they "jump aboard," not wanting to miss the market going yet higher, or so they believe.

It also worth noting that this selling activity is occurring at the previous high, actually, just above it, making it look like a potential breakout, [SM is big on false appearances]. Price stopped at the overbought TL, [Trend Line], as well. There is a converging of a few important observations that raises one's level of interest.

Few market participants pay any attention to higher time frame charts, like a monthly, but a monthly is not used for market timing, anyway. Timing goes to the daily and intra day charts, once the monthly and weekly provide reasons for doing so.

The KISS principle at work. Rather than focus on too many things, there is one factor we can take from the weekly chart, and it may prove critically important. For sure, it alerts us to a change in behavior not seen since the bull market began in 2009. It is highly unlikely that the public, and even many smart traders, would pay attention to this subtle change.

It is the first time that volume has increased as the market sells off from a high area. Most often it is an indication of a transfer of risk: strong hands taking profits and selling to weak hands, eagerly anticipating higher prices.

Some things never change, and noting those changes can be rewarding.

The OKR, [Outside Key Reversal] high is a shot across the bow, a huge red flag when the other noted factors are added into the mix. There are no accidents in life, not even in the markets. Everything happens for a reason.

The May high has a possibility of being a top. The one caveat we personally hold is that this bull market has been Fed fiat-driven, actively managing the market for economical and political reasons. Economically because the Fed is keeping its fiat-house-of-cards afloat and does not want the market to come crashing down, exposing its fiat-Ponzi scheme.

Politically, the Obama regime does not want to world to crash the fiat Federal Reserve Note Ponzi scheme, [Federal Reserve Notes are issued by the Fed and incorrectly called "dollars."], and force Americans to realize the lies and deceptions since the Federal Reserve Act was introduced in December 1913, oddly enough, two days before Christmas when most of Congress was home on holiday. This is another story, but more important than 99% of American can fathom. It is what is impacting the markets, today.

The two strong reversals off important support is the market's way of letting us know that buyers are defending support. Will they succeed is the all-important question? The last rally attempt failed as a retest of the May OKR high. Will this resistance hold, for it is an important piece of information?

We started off saying charts are informative, not predictive. We do not have to know in advance what this chart, and the others, are saying. For now, we are seeing a flurry of red flags to be defensive in participating. This daily chart is telling us to sell out longs or at least place close stops to protect existing profits. For any positions with losses, this is a huge warning to take them now before they become larger. For obvious weak stocks, taking a short position should be considered, always depending upon one's rules and market objectives, profit being the ultimate one.

Wednesday's sell off on increased volume was a strong warning, [3rd bar from the end.] Thursday's rally, [next bar], erased the downside effort of the previous day, but it failed to elicit upside buying, and it stopped under the failed retest.

For now, as long as the retest swing high holds, selling against it would be the order of the day, but only when there are indications to sell. What are those indications? They would be your rules of engagement. If the market does this, then do that, and always in that order. It is how to stay in sync with a trending market, in whatever time frame chosen.

The tech-heavy NASDAQ is showing a little bit weaker, another red flag. You can see how the trend is no longer up, once a lower low occurred after the most recent lower high, as evidenced by the line connecting the swing highs and lows.

The rally attempt on Thursday did not erase the previous down day, like it did in the S&P, and each bar since the failed swing high, [not marked, but 5 bars ago], has been a lower high and lower low.

What the daily charts are telling us about the market and the higher time frames is that the potential for an end to this bull run is increasing. It has not been confirmed on the higher time frames, but the daily is serving ample warning for anyone willing to observe.

There are no Black Swans in the market, just people unaware of being unaware.

See the original article >>
Follow Us