Showing posts with label oil. Show all posts

Saturday, September 24, 2011

September 20 Commitment Of Trader’s Report

by Macro Story

The COT report for the week ending September 20, 2011 shows copper still setting up for further weakness while oil looks flat and the 30 year yield possibly due for a move higher. Most interesting are the moves in the USD.

Copper: Finally after sounding like a broken record copper has broken to the downside. Commercial net has been signaling this move for a while and in fact had to readjust over the summer as copper remained stubbornly high in price. Interesting to note even with the current weakness in copper commercial net has in fact gone net long (buying copper into lower prices) signaling even further selling to come.
Oil (WTI): Oil looks poised to remain slightly pressured to range bound. No major change to report from this week’s report.
Long Bond: Based on a slight reduction in net short positions for commercial accounts it appears the 30 year yield may in fact move slightly higher over the coming week.
US Dollar: Very interesting changes in position for both non reporting (retail) and commercial accounts. The USD did break out of a multi-month trading range this week and has broken through multi-year resistance. Below are two charts, the first shows how commercial net moves relatively to the USD (i.e. they short or sell into strength). The second chart shows how commercial and non reporting move inverse to one another.

USD VS Commercial Net - notice the massive divergence signaling a major move higher in the USD is highly probable or at least anticipated by commercial net.
USD Commercial VS Non Reporting – Notice the extreme changes to positions for both. The non reporting scale on the chart below is inverted to show the correlation. Although easy to dismiss this as a USD selloff is pending as retail is massively net long it is important to note that commercial net is supporting a move higher in the USD.

The Week Ahead: Is the Majority Wrong?


Bearish sentiment and economic troubles continue to take their toll on the markets, but certain sectors look good and a buying opportunity may be right around the corner, writes MoneyShow.com senior editor Tom Aspray.

Even though global stock markets were able to stabilize on Friday, the sharp declines last week added to the overwhelming negative sentiment in the markets.

The technical formations prior to last week suggested that stocks were vulnerable to decline, and the short-term outlook turned more negative Tuesday.

Of course, the magnitude of the decline was a surprise to all, and Thursday’s sell-off was similar to the panic selling that occurred in early August. This gave the investment firms and major banks some vindication, as they have been racing each other for weeks to cut their forecasts for the economy and lower their year-end targets for the S&P 500.

Even the Federal Reserve joined in, as their new plan to lower long-term rates was accompanied by the comment that there are “significant downside risks to the economic outlook, including strains in global financial markets,” something that undoubtedly spooked an already skittish market.

Though I think the Fed’s concern is valid, the general consensus of economists makes me more skeptical. Many believe that if we are not already in another recession, we will be soon. If this turns out to be the case, it would be the first recession that was predicted by most as it was occurring.

These predictions comprise the majority of market sentiment, even though last week’s housing data was better than expected; existing home sales jumped 7.7% in August. Nevertheless, a survey of 100 economists painted a bleak picture of housing, as they expected prices to drop 2.5% this year, and then only rise 1.1% through 2015.

In my experience in the market, the majority is rarely right. When you have a consensus view—especially one that persists for some time—I always look at the technical evidence to see whether it supports this consensus.

For example, my volume analysis on gold turned positive in 2006, but sentiment toward gold was often mixed. In the fall of 2009, however, public sentiment on gold was overwhelmingly positive, right before gold topped out on December 1.

This began a months-long decline. The correction was severe enough to turn enough of the bulls negative on gold, which created another good buying opportunity.

Therefore, while the short-term outlook for the global equity markets is decidedly negative (as I detail later), I think by year’s end the stock market may surprise many of the current bears.
chart
Click to Enlarge

Of course, the problems with the US economy and our leadership are just magnified overseas. Many are suggesting that the Eurozone will eventually break up, as their leaders fail to comprehend the severity of their debt problems.

The focus remains primarily on Greece, but the contagion fear is still hurting the markets. The economic news last week was also grim, as the Eurozone purchasing managers’ index dropped in September for the first time in two years. Rating agencies downgraded many Italian and Greek banks, which did not help. (I would love to see someone start rating the rating agencies.)

Late last week, the G-20 announced that it would take “all necessary action” to shore up the banks and financial markets. I think they will eventually figure out the necessary actions and move accordingly.

Unlike the US stock market, the German Dax Composite has continued to decline after the sharp drop in late July. The Dax was sharply lower early last Friday, but closed higher, and could have formed a very-short-term bottom.

Things weren’t that much better in Asia, as selling was heavy. News that China’s factory activity declined in September reversed some of the positive sentiment that had been building for their economy.

The Hong Kong Hang Seng Index had a rough week, down 7.9%, and as the chart shows, the long term 50% Fibonacci support was broken. The 61.8% support stands at 16,544, which is 7.5% below Friday’s close.

The market is likely to get a good test from the economic data this week. On Tuesday, we get new-home sales figures, the S&P Case-Shiller Housing Price Index, and the latest readings on consumer confidence.

Wednesday will bring the latest numbers on durable-goods orders, followed Thursday by the final reading on second-quarter GDP, jobless claims, and pending home sales.

On Friday, we get the numbers on personal income and consumer sentiment, which is likely to be watched closely by Wall Street.

WHAT TO WATCH

The sharp drop last week pushed many of the market indicators to levels where a sharp rebound is likely. The odds would have been even greater if stocks had been sharply lower again on Friday.

Some charts show potential double bottom formations, and while the volume action does support this view, the evidence is not strong enough to act. Given the overhanging political and economic problems, a new trading range is more likely.

I still think the current decline will be an opportunity to establish long stock positions in some of the sectors that I like, but we need to see a decrease in downside momentum first. Technology and cash-rich, high-dividend stocks are my favorites, followed by the retail sector, as I do not think Christmas shoppers will stay away.
chart
Click to Enlarge

S&P 500

The Spyder Trust (SPY) is holding above the August lows as it is testing the daily Starc- bands. Last Thursday’s gap lower opening took out the prior lows at $114.05.
 
If the August lows are broken, then the 127.2% Fibonacci target from the flag formation is at $106.50, while the width of the flag gives downside targets in the $104 to $105 area.

First resistance stands at the gap in the $114.21 to $116.27 area, with stronger levels at $118.50. The daily trend line resistance is at $121.50.
.
The S&P 500 A/D line is so far holding above both the recent lows and those that were made in August (line d). This is an encouraging sign, but a move through the downtrend (line 3) is needed to confirm a bottom.

Dow Industrials

The Spyder Diamonds Trust (DIA) came very close to the 38.2% support of $105.46 last week, as DIA gapped though the lower boundary of the flag formation (line f) on Thursday.

There is resistance now at $107.95 to $110.69, with a key level to follow at $114 to $115.25.

The Dow Industrials A/D is diverging from prices (line h), but needs a move through the resistance (line g) to confirm the divergence. A convincing break of this support will indicate a further decline.
chart
Click to Enlarge

Nasdaq-100

The PowerShares QQQ Trust (QQQ) also gapped lower Thursday, then closed back above the uptrend (line b) on Friday, which is positive.

It would take a close below the September 6 lows at $51.91 to signal a test of the August lows.

The Nasdaq-100 A/D line overcame its downtrend (line c) last week, which suggests the A/D line could be bottoming. The A/D line shows a slight uptrend (line d) which could be broken on a further decline. A move in the A/D line above last week’s high would be positive.

There is resistance now at the gap in the $54.46 to $55.37 area.

In a recent article, I took a close look at not only the PowerShares QQQ Trust (QQQ), but also the Select Sector SPDR Technology (XLK), Semiconductor HOLDRs Trust (SMH), and Apple (AAPL).

Sector Focus

All of the major sectors were hit hard last week, and three—energy, materials, and industrials—look the weakest.

The Select Sector SPDR Utilities (XLU) is holding first support in the $32.70 to $33 area, and a drop back to the $32 to $32.40 area should be a buying opportunity.

The Select Sector SPDR Consumer Staples (XLP) and Select Sector SPDR Health Care (XLH) are also holding well above their highs, but the short-term momentum is still negative.

Oil

November crude plummeted as expected last week. The support at $85 and the $83.20 level both gave way, with crude hitting a low of $77.55 on Friday.

This could be a final washout, but it will take some time for the market to recover from a $13-plus drop.

There is initial resistance at $82, with stronger levels in the $84 to $85 area

Tuesday, September 20, 2011

Downleg in Crude Oil


Nearby NYMEX crude oil finally proved the chart work correct as it plunged from the upper portion of its September congestion pattern (89.00-90.00) to the lower portion (86.00-84.00). The decline from last Thursday's lower recovery high at 90.15 into this morning's low at 84.93 has the look and structure of a completed downleg.

If accurate, this means that a period of upside backing and filling towards its key near-term breakdown area (86.50-87.50) could be in store in the upcoming hours. It is for this reason we exited our inverse (short) position in the ProShares UltraShort DJ-UBS Crude Oil (NYSE: SCO).
Apart from this shorter-term trading strategy and outlook, my longer-term work on NYMEX crude argues strongly that a counter-trend recovery period from the August 8 low at 75.71 ended at the September 13 high at 90.52 and that a new downleg has commenced that should revisit and likely break the August low. ETF traders may want to keep an eye on the U.S. Oil Fund ETF (USO).


Monday, September 19, 2011

Risk Off Day as correlations spike further


The Day we sold everything. Oil, Gold, Silver, EUR, AUD, Equities all down today. With correlations running high, we could be facing another Flash Crash sooner than later. Only “thing” not trading at day lows, is actually the Athens Index.


and the only asset bouncing is ironically the Greek Market.


Sunday, September 11, 2011

Macro Week in Review/Preview September 10, 2011


Last week’s review of the macro market indicators looked like the moves that revealed themselves the previous Friday would continue. Gold and US Treasuries were ready to continue higher. Crude Oil looked poised to drop further and the US Dollar Index to move sideways in the top of its range. The Shanghai Composite and Emerging Markets looked to continue lower. Volatility looked to remain elevated with the US Equity Index ETF’s SPY, IWM and QQQ ready to continue lower in their bear flags. US Treasuries breaking out and Gold racing higher again could be the catalyst for a break of the bear flags lower.

The week began Gold making a new high before pulling back to consolidate, US Treasuries gapped higher and held there. Crude Oil held narrow range between 86 and 90 while the US Dollar Index marched to the top of the range and then peaked out. The Shanghai Composite and Emerging Markets did move lower but with a mid week blip higher for Emerging Markets. Volatility did hold higher with and the Equity Index ETF’s remained lower, but still in their bear flags. What does this mean for the coming week? Lets look at some charts.

As always you can see details of individual charts and more on my StockTwits feed and on chartly.)

Gold Daily, $GC_F

Gold Weekly, $GC_F

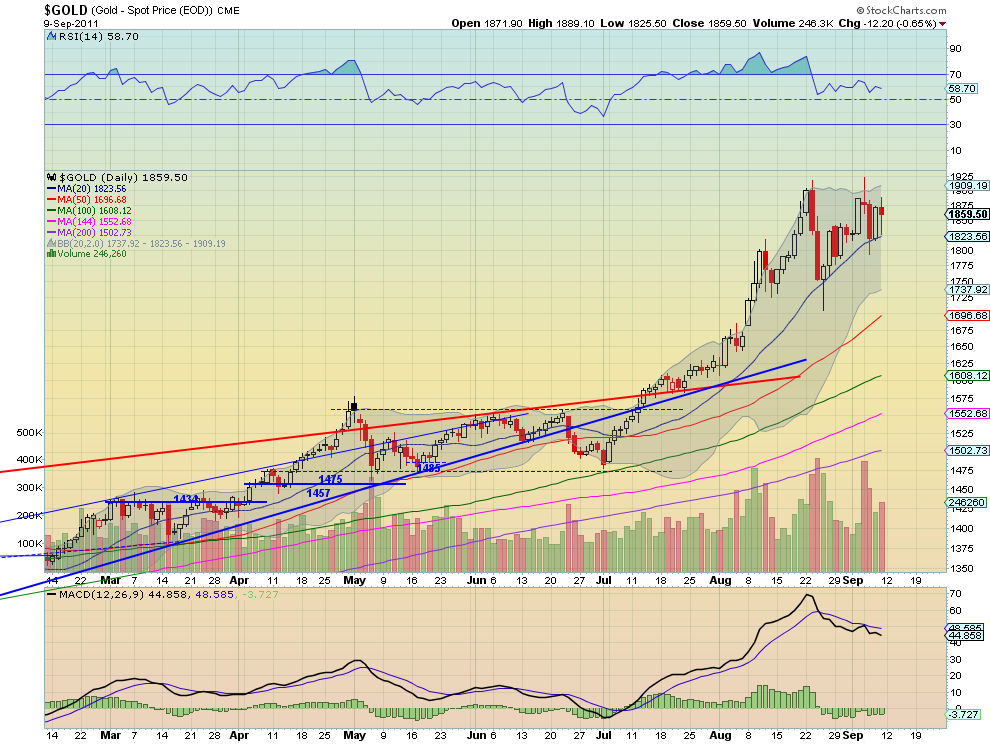
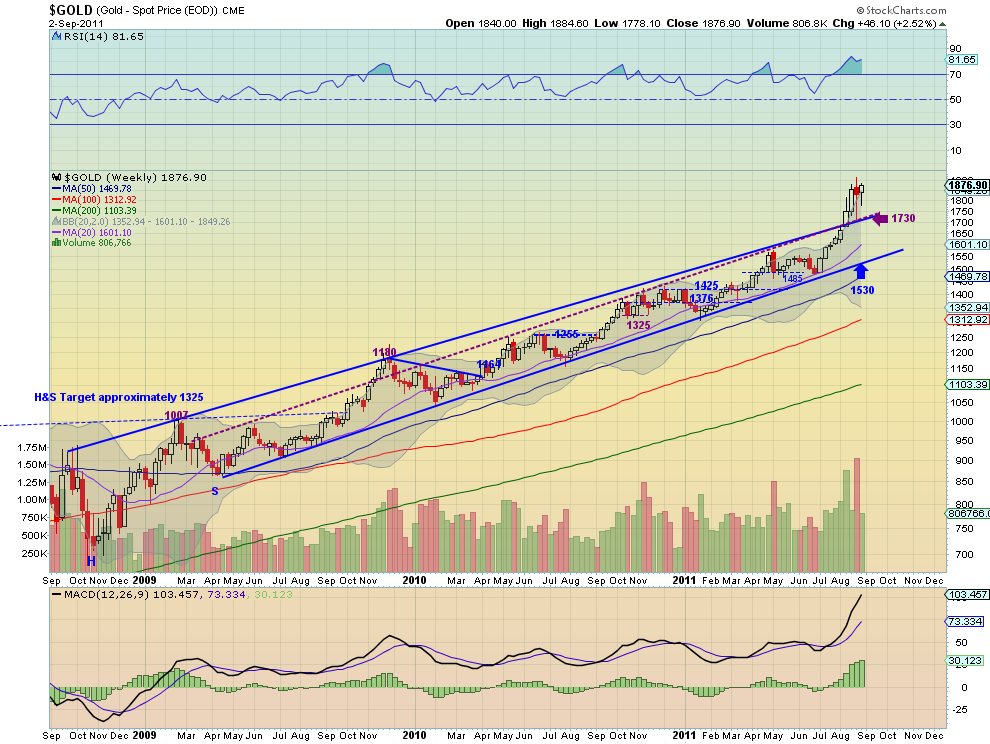
Gold consolidated this week over the break out of the ascending triangle Monday and near resistance at 1875, after it made a new intraday high Tuesday. The Relative Strength Index (RSI) on the daily chart remains in bullish territory but moving sideways. The Moving Average Convergence Divergence (MACD) indicator has been running flat but slightly negative on the daily chart but has been rising on the weekly chart. The RSI on the weekly has held in the high 70′s for several weeks. Look for the bull flag on the weekly chart and symmetrical triangle on the daily chart to play out with either more upside or continuation of consolidation near 1875 in the coming week. Any pullback should find support at 1840 or 1800 lower. A move over 1930 triggers a target of 2250.

West Texas Intermediate Crude Daily, $CL_F

West Texas Intermediate Crude Weekly, $CL_F

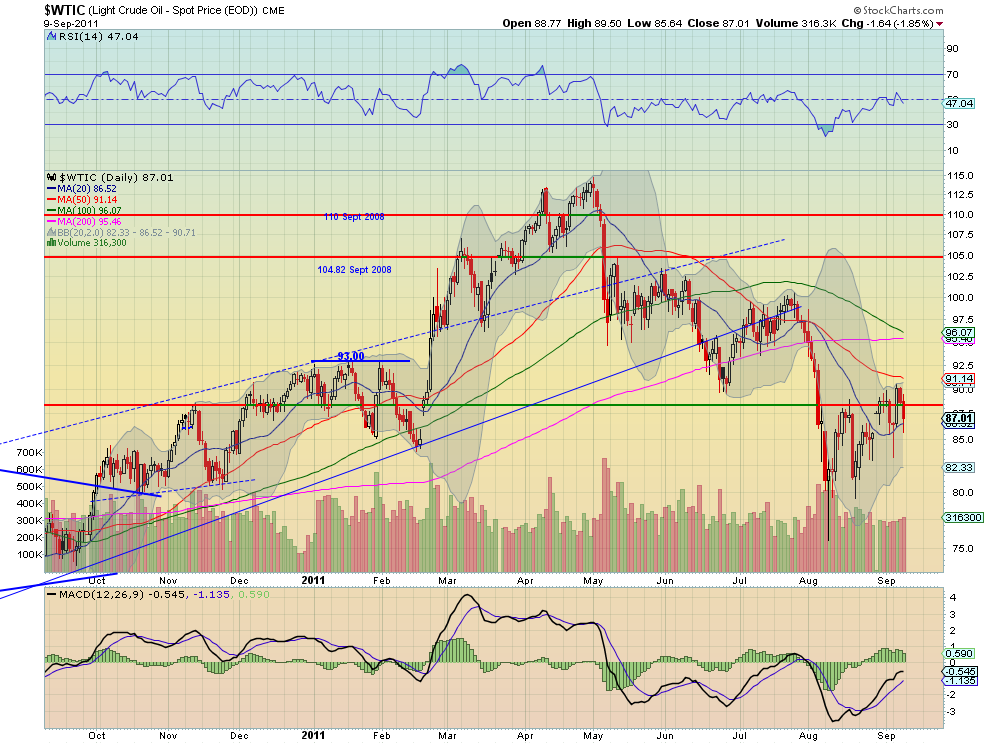
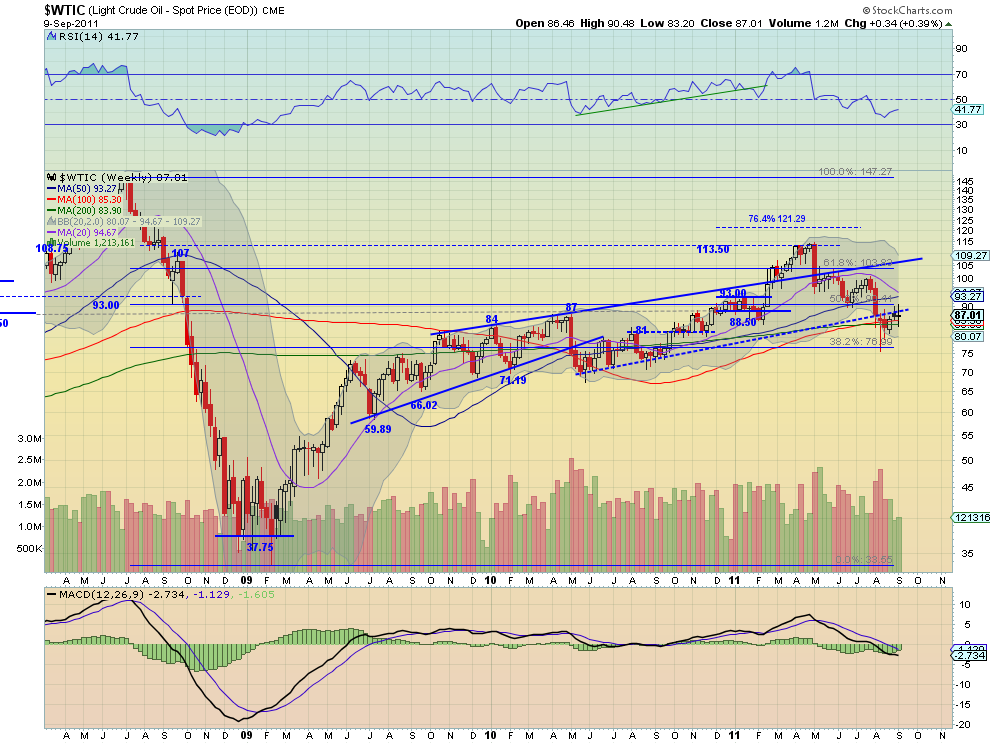
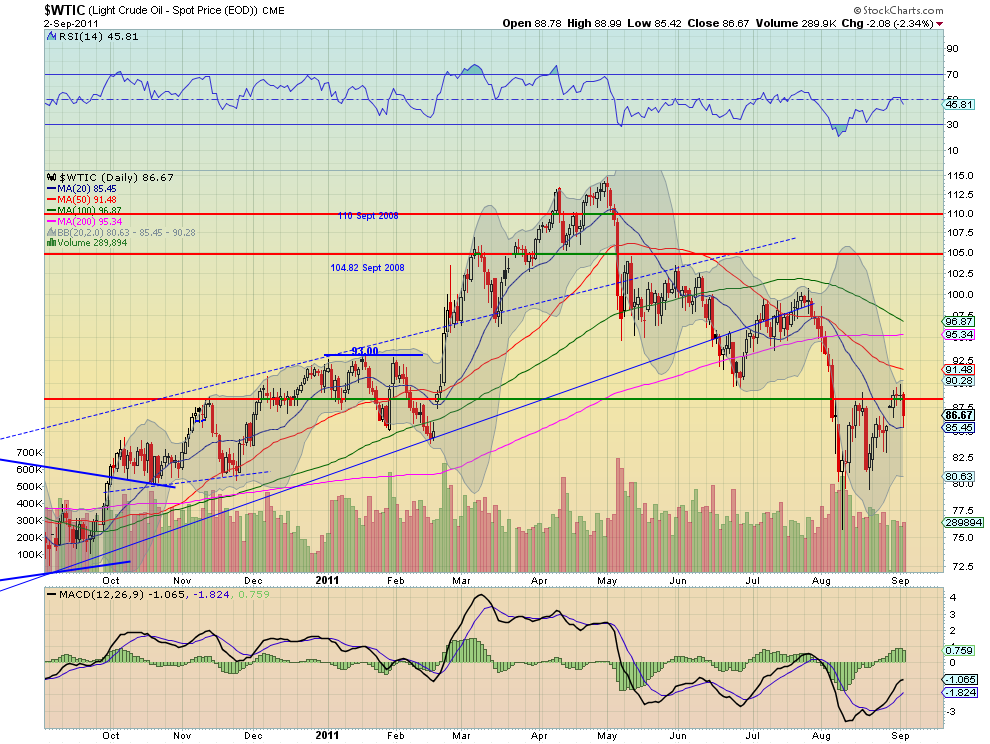
Crude Oil continued its bear flag ending the week little changed and vacillating around the 88.50 support/resistance line. The weekly chart shows that resistance of the rising trendline extension form May 2010 is holding. The RSI on the daily chart has stalled near the mid line and the MACD is positive but fading slightly. The weekly chart shows the RSI currently rising but in a downtrend and the MACD improving. These suggest the bear flag will continue next week. Look for upside to be capped at 90 and a move to 93 above that as a break of the bear flag. A move under 84 finds support at 81 and then 77 lower which would trigger a target of 70 on the Measures Move (MM) out of the bear flag.

US Dollar Index Daily, $DX_F

US Dollar Index Weekly, $DX_F

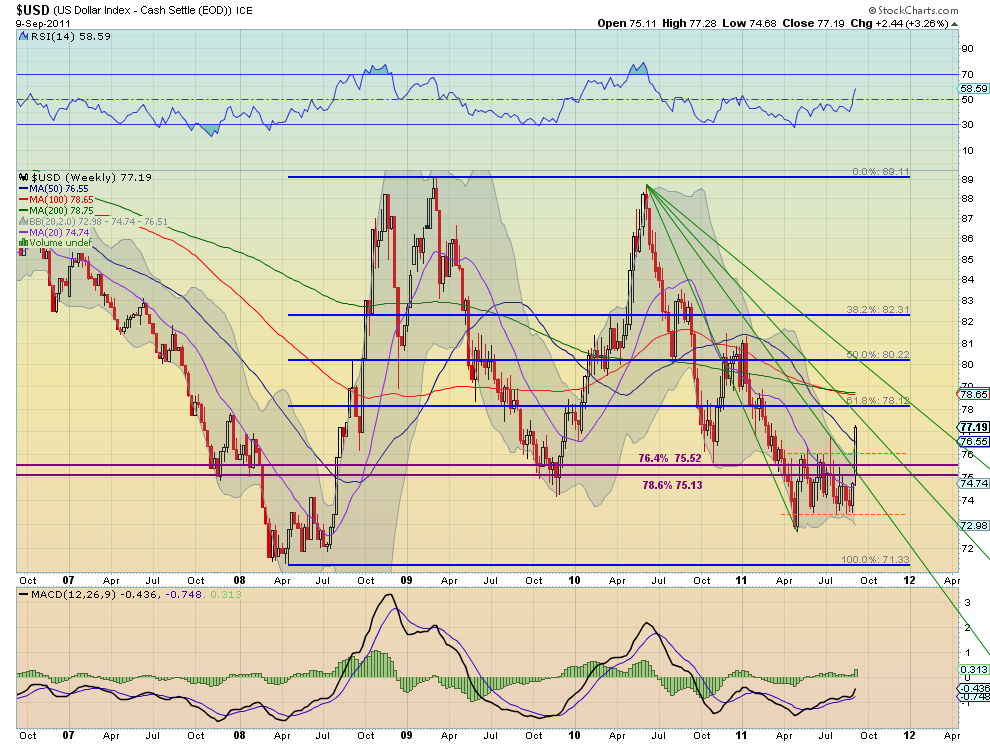
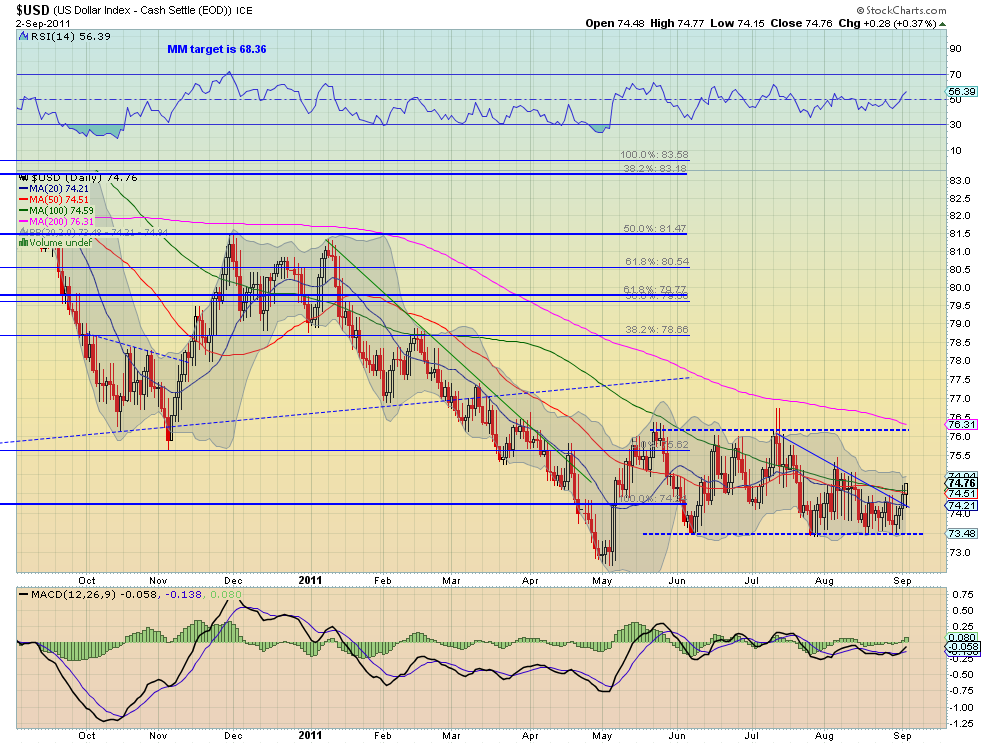
After peaking over the channel Thursday, the US Dollar Index broke the channel higher Friday. It has a RSI that raced higher all week and is strongly in bullish territory, and a MACD that is increasing on the daily chart. The weekly view shows a vault over the resistance area, opening over the Fibonacci Fan line and rising strongly towards the next line. The RSI on this timeframe moved steeply higher and the MACD jumped higher. Look for continued movement to the upside in the coming week with resistance higher at 77.50 and 78.15 as it heads to the channel breakout target of 78.50 near the previous 78.66 resistance area from February. As with any breakout, a retest of the channel at 76 is possible and a move below it has support at 75.52 and 75.
iShares Barclays 20+ Yr Treasury Bond Fund Daily, $TLT

iShares Barclays 20+ Yr Treasury Bond Fund Weekly, $TLT

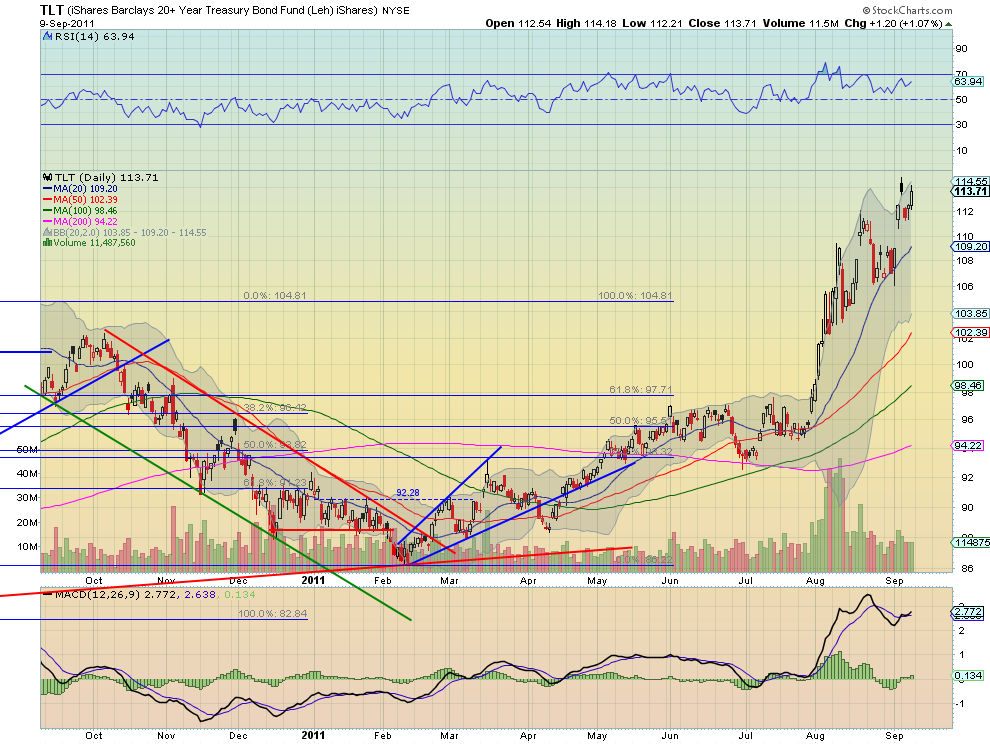
US Treasuries, measured by the ETF $TLT, gapped up higher on Monday and held the gap. The daily chart shows the RSI continuing to move in a range in bullish territory but with a MACD that has crossed positive. The weekly chart adds that it broke the broad consolidation around the 106 to 111.33 area and now has a MM higher to about 120.70. The RSI on this timeframe remains bullish in the high 70′s with a MACD that is increasing. With a touch of 115 this week, next week or shortly after looks a lock to tag 120.70 and above that triggers a target on the symmetrical triangle break at 137. Any pullback will find support 111.33 and 109.30, with a move under 106 signalling a trend change.
Shanghai Stock Exchange Composite Daily, $SSEC

Shanghai Stock Exchange Composite Weekly, $SSEC

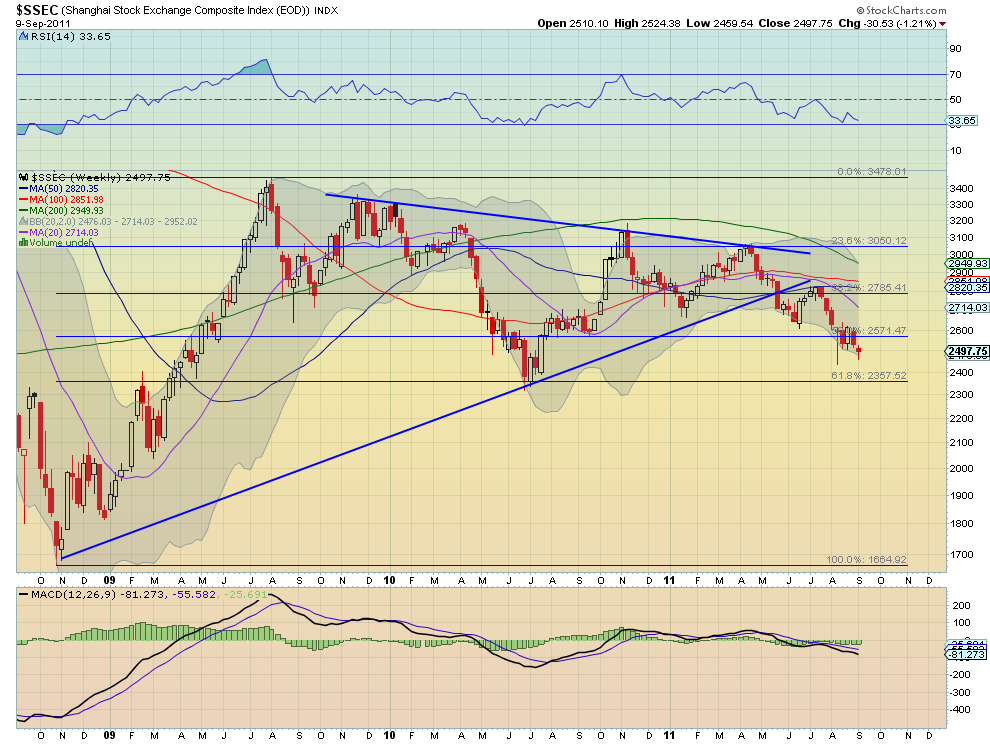
The Shanghai Composite showed continued resistance at the 2500 level holding lower for the week. The daily chart has a RSI that has been bumping along the 30 technically oversold level, but no where near an extreme reading while the MACD fluctuates around zero. The weekly chart shows the long trend of the RSI lower, making lower highs, and the flat MACD. It also shows that it is starting to fall out of the bear flag lower. Continue to favor the downside in the coming week a move below support at 2400 leading to a test of 2357 and a target of 2300 on the bear flag break. Upside should be capped for the week at 2571-2590.

iShares MSCI Emerging Markets Index Daily, $EEM

iShares MSCI Emerging Markets Index Weekly, $EEM

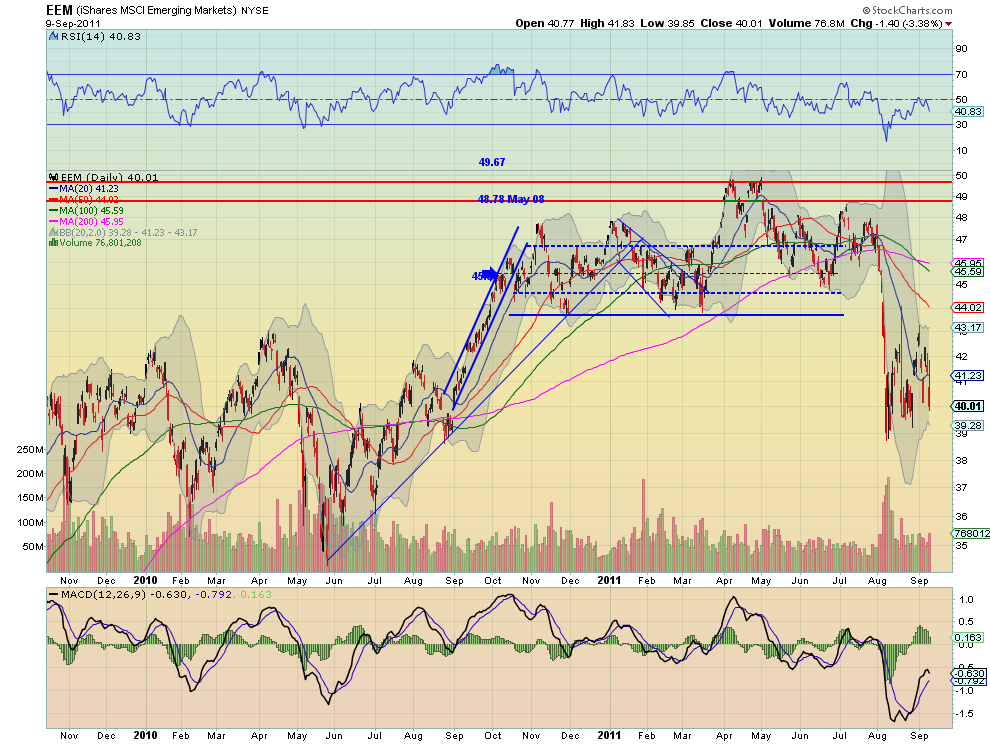
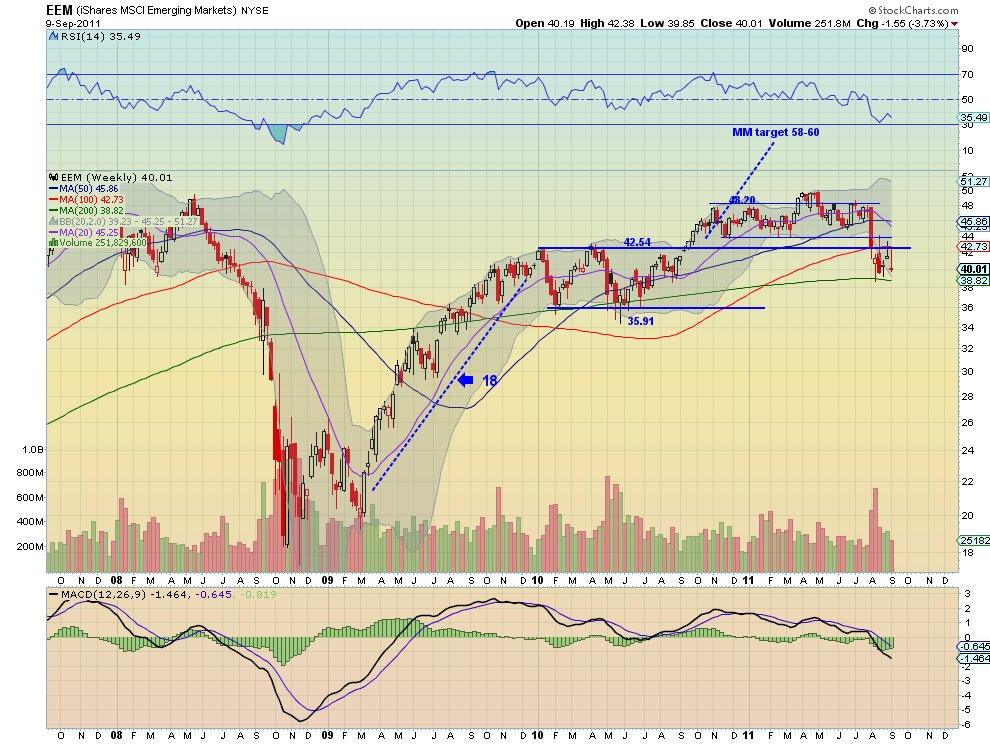
Emerging Markets, as measured by the ETF $EEM, continued in their bear flag similar to the domestic markets. Notice the RSI on the daily chart rejected lower at the mid line continuing in bearish territory as the MACD fades lower. On the weekly chart the bear flag is distinct under the 42.54 resistance level. The RSI on this timeframe is struggling to stay over 30, and is bearish, but the MACD is starting to improve. The downward bias remains for eh coming week with a break below 39, out of the bear flag seeing support lower at 35.91 and triggering a target of 32. Any upside will meet resistance at 42.54 and then 44.10 above that.

VIX Daily, $VIX

VIX Weekly, $VIX

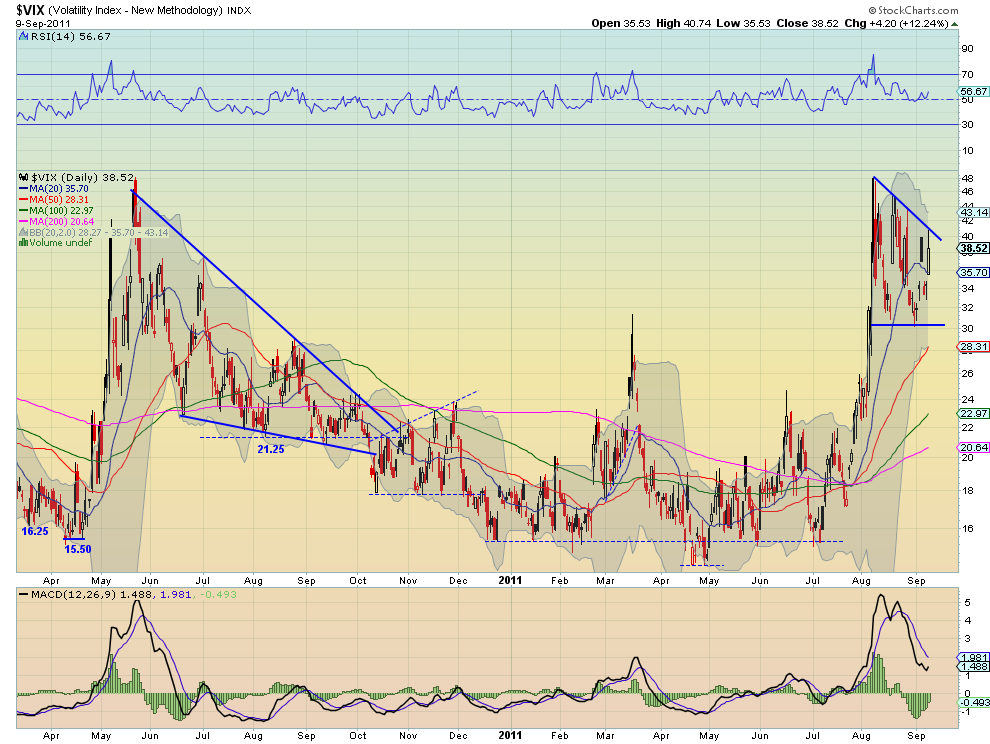
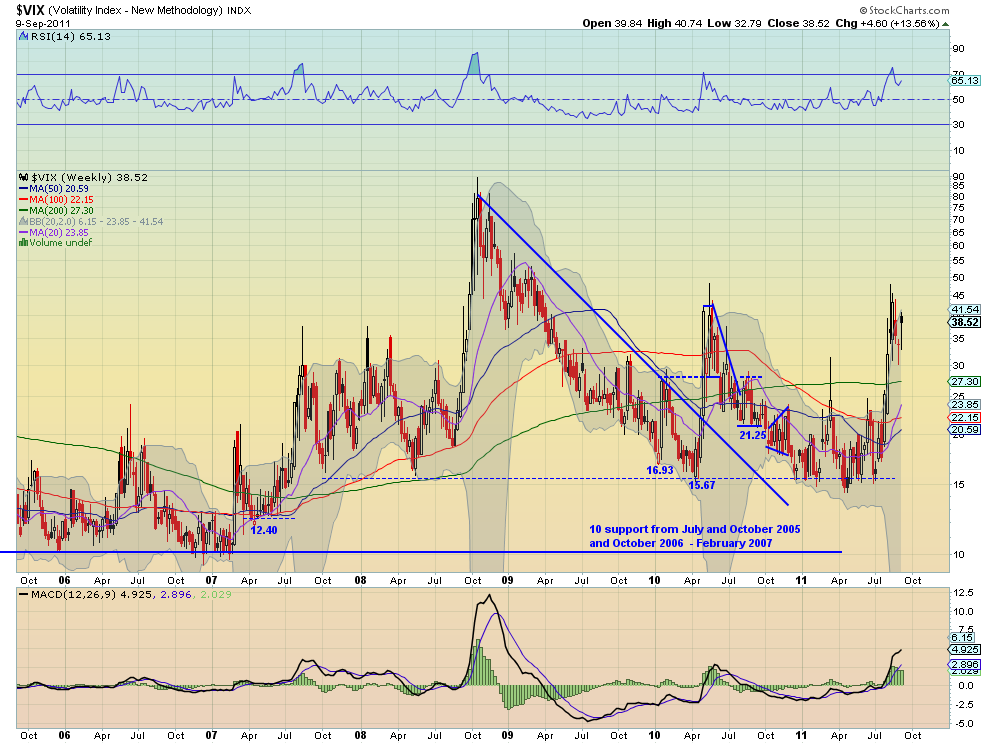
Volatility continues to remain elevated. The daily chart is sporting a descending triangle and is testing the top side resistance with a RSI that refuses to fall back below 50 and a MACD that is improving quickly. The RSI and MACD on the weekly chart equally are supportive of further upside in volatility. Look for volatility to continue to remain high next week with a move above 40 and then 45 triggering a target of 58. It would take a break below 30 to change the mood and expectations for a move to support at 28 or 23 lower. The charts do not show that now.

SPY Daily, $SPY

SPY Weekly, $SPY

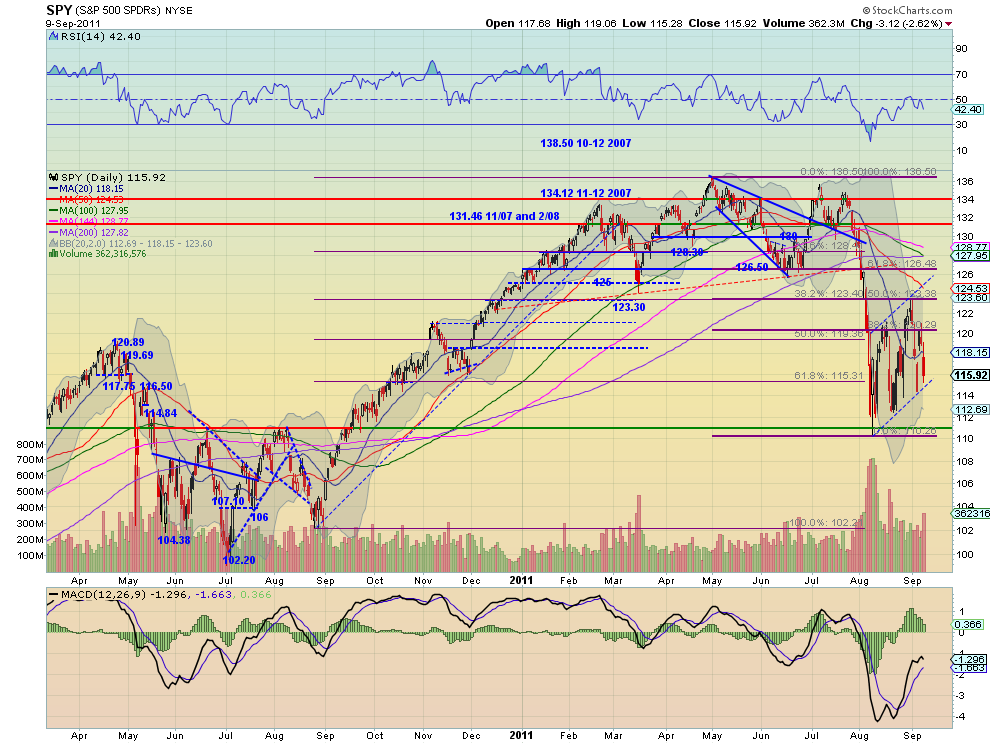
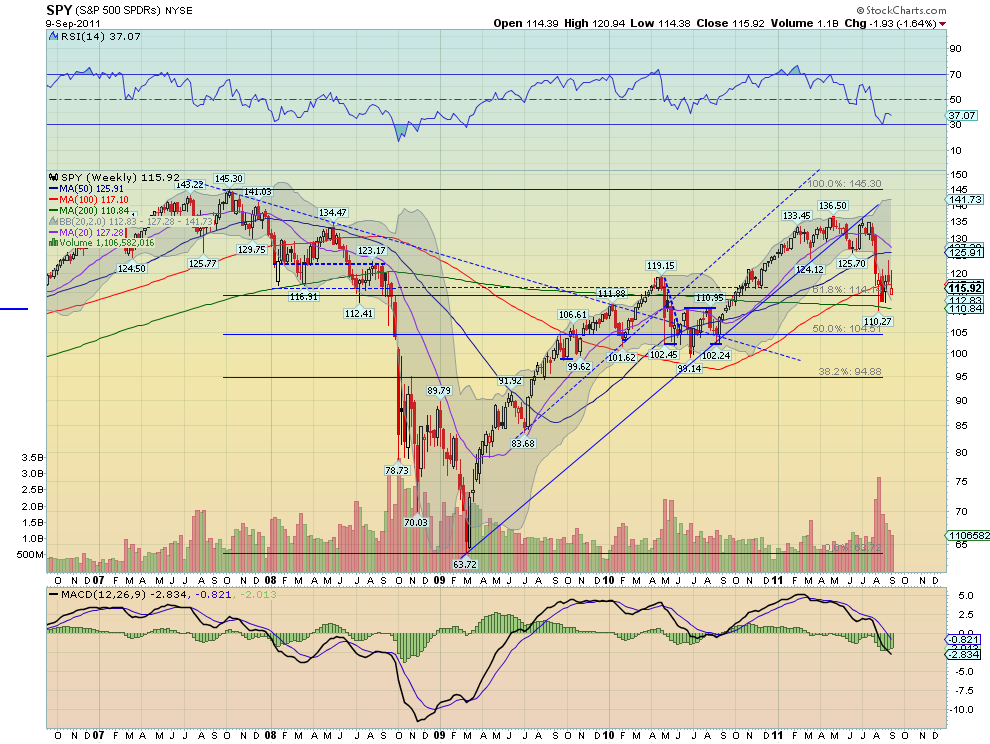
The SPY continued in the bear flag this week moving back lower after rejecting a retest at the 38.2% Fibonacci level from the broad move lower. It has a RSI that also rejected at the mid line and is heading lower on the daily chart and a MACD that continues to fade. The weekly chart shows the RSI bounce off of the 30 level fading back towards it and the MACD remaining negative. The downtrend remains for next week. If it breaks the flag lower under 115.30 there is support at 111.15 and 104 on the way to a target of 95-100. Any upside should find resistance over 121.50 at 123.30. Above that the trend may be changing.

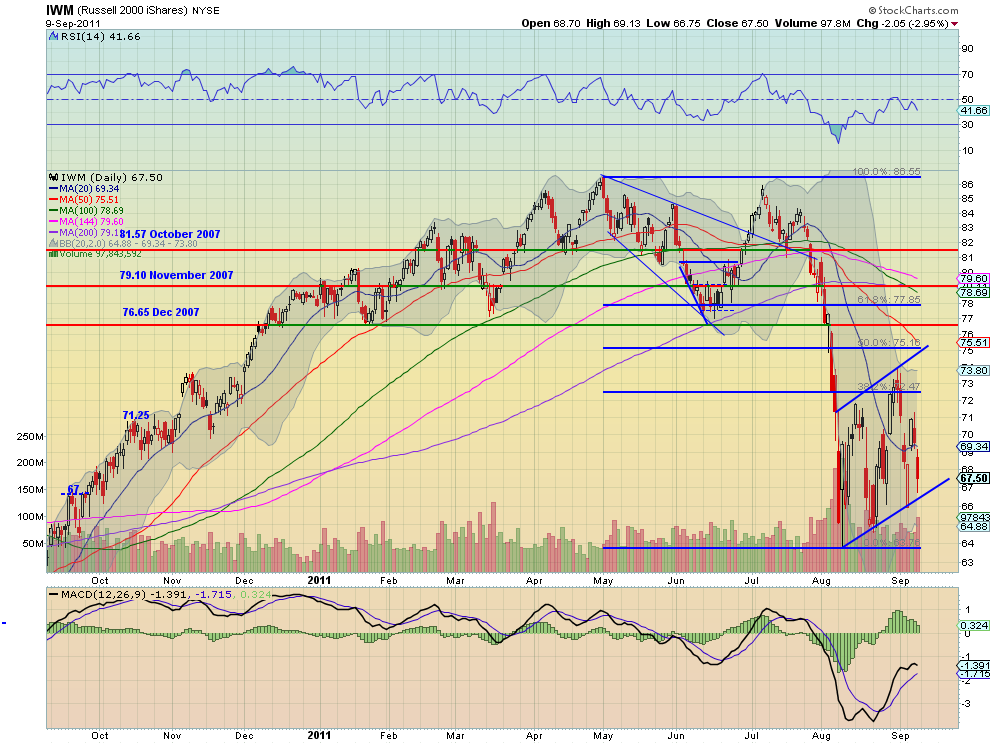
IWM Daily, $IWM

IWM Weekly, $IWM

The IWM moved in its bear flag this week, moving back lower after rejecting at resistance at 71. It has a RSI that rejected at the mid line and is heading lower on the daily chart and a MACD that continues to fade. The weekly chart shows the same RSI bounce off of the 30 level fading back towards it and the MACD remaining negative. The downtrend remains for next week. If it breaks the flag lower under 66 there is support at 62.80 and 58.68 on the way to a target of 44. Any upside should find resistance over 71 at 73.60. Above 75 the trend may be changing.

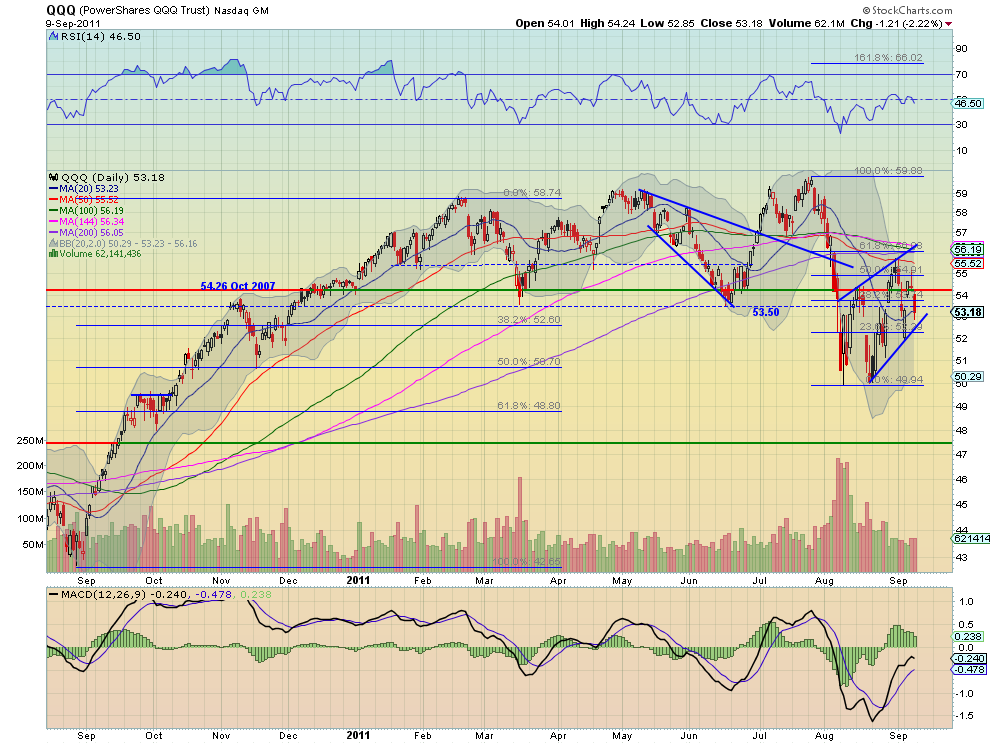
QQQ Daily, $QQQ

QQQ Daily, $QQQ

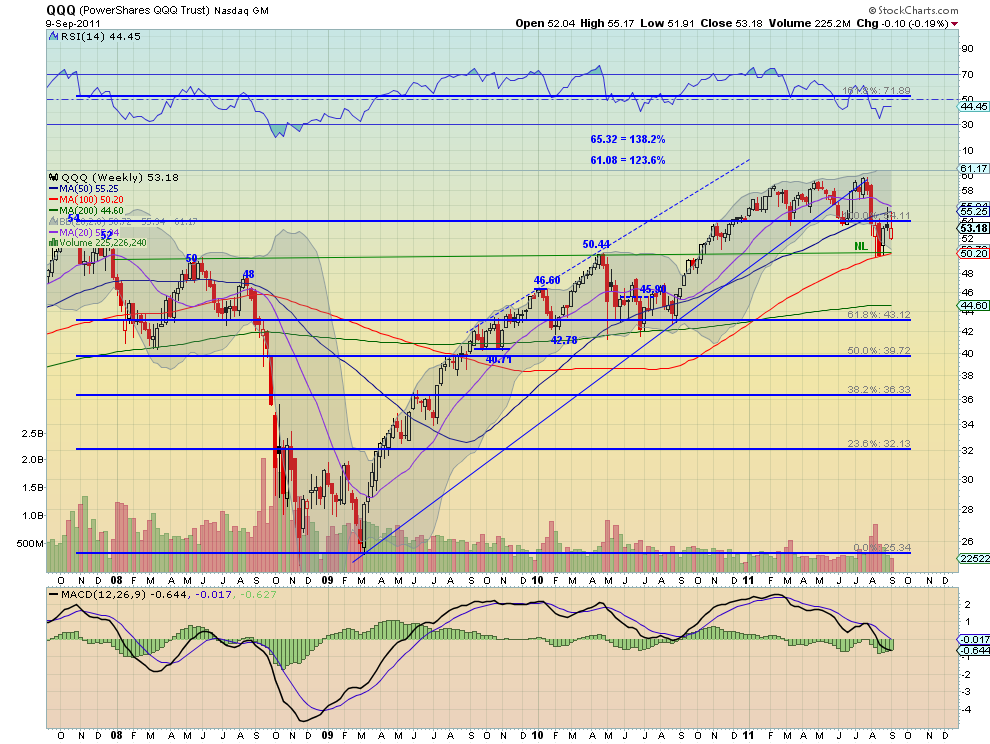
The QQQ moved in its bear flag as well, moving back lower after rejecting at the 50% Fibonacci level. It has a RSI that rejected near the mid line and is heading lower on the daily chart and a MACD that continues to fade. The weekly chart shows the same RSI bounce leveling and the MACD remaining negative as the flag sits on the 100 week Simple Moving Average (SMA). The downtrend remains for next week. If it breaks the flag lower under 52.60 there is support at 50.03 on the way to a target of 46-46.60. Any upside should find resistance over 55.50 at 57. Above that the trend may be changing.

The coming week looks positive for US Treasuries and the US Dollar Index. Gold looks to continue to be biased higher and Crude Oil lower, but both may also continue in the respective bull and bear flags. The Shanghai Composite and Emerging Markets continue to favor the downside. Volatility looks to remain elevated with a bias towards heading higher. This backdrop suggests favoring a downside bias in the US Equity Index ETF’s SPY, IWM, and QQQ. They may continue to hold their bear flags but a big push higher in the US Dollar Index and US Treasuries are likely to push Volatility higher out of its range and lead to the Equity flags breaking lower. Use this information as you prepare for the coming week and trade’m well.

Sunday, September 4, 2011

Macro Month in Review/Preview August-September 2011


Last month in this space my Monthly Macro Review/Preview suggested that the monthly charts had shifted to showing Gold ready to move higher in the coming months along with US Treasuries while Crude Oil and the US Dollar Index are biased to the downside. The Shanghai Composite and Emerging Markets were set to slowly drift lower in a sideways consolidation. Volatility was on the edge of a break higher at a critical level. A move above 28 would signal regime change while a fall back, more of the same. This was reflected in the Equity Indexes as well with the SPY, IWM and QQQ all consolidating with indicators starting to point negative, but holding in their ranges. A catalyst that pushes them higher could lead to a major rally. The QQQ is the strongest of the Indexes as of the end of July.

Gold and US Treasuries held true to the charts and moved higher, a lot higher, while the US Dollar Index and Crude Oil consolidated. The Shanghai Composite and Emerging Markets also drifted lower as anticipated in the charts. Volatility took the high rode and held higher all month concurrent with a move lower in the Equity Index ETF’s. A month that was true to the technicals. How does the month impact the longer term picture. let’s look at some charts.

As always you can see details of individual charts and more on my StockTwits feed and on chartly.)

Gold, $GC_F

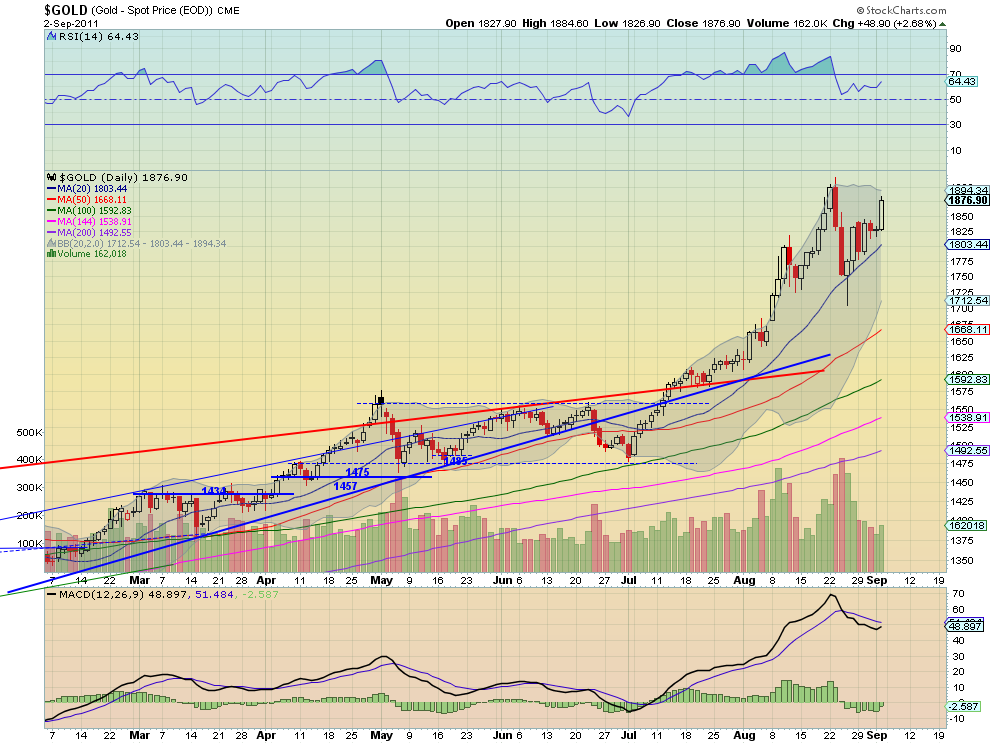
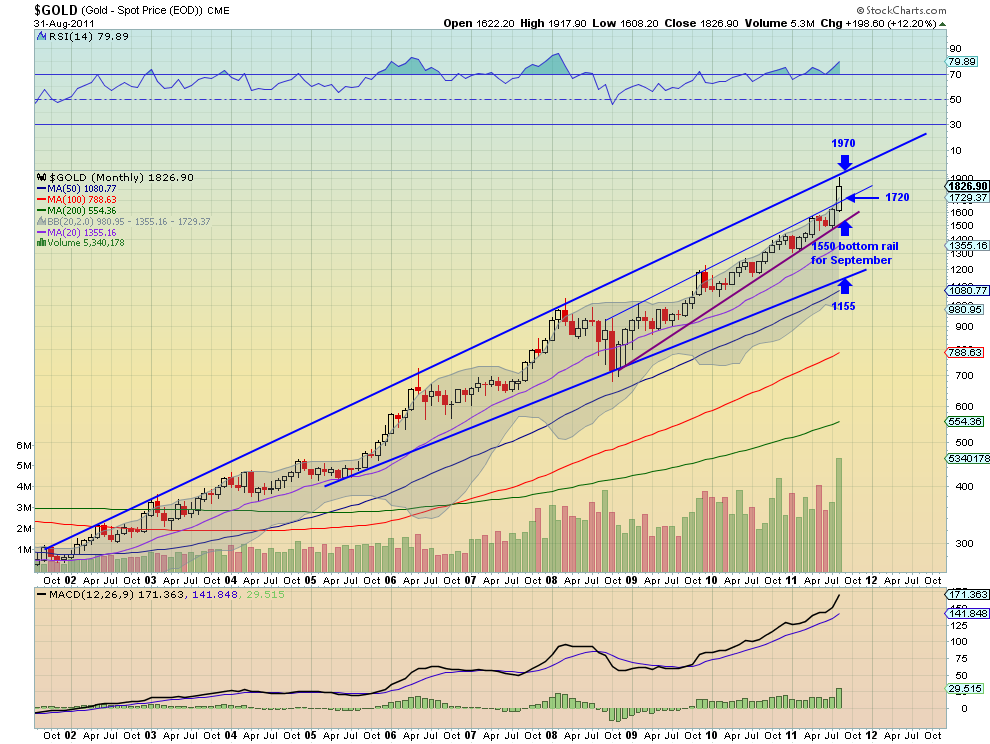
Gold broke above the rising two year trendline resistance and did not look back until it ran near the 10 year resistance line at 1917.00. The Relative Strength Index (RSI) remains elevated, but under 80 and the Moving Average Convergence Divergence (MACD) indicator continues to move higher. These indicators along with the Simple Moving Averages (SMA) sloping higher and volume increasing point to more upside for Gold in the coming months. Support for any pullback now stands at 1720 and 1550 below that while a move over 1970 resistance may slow it down.

West Texas Intermediate Crude, $CL_F

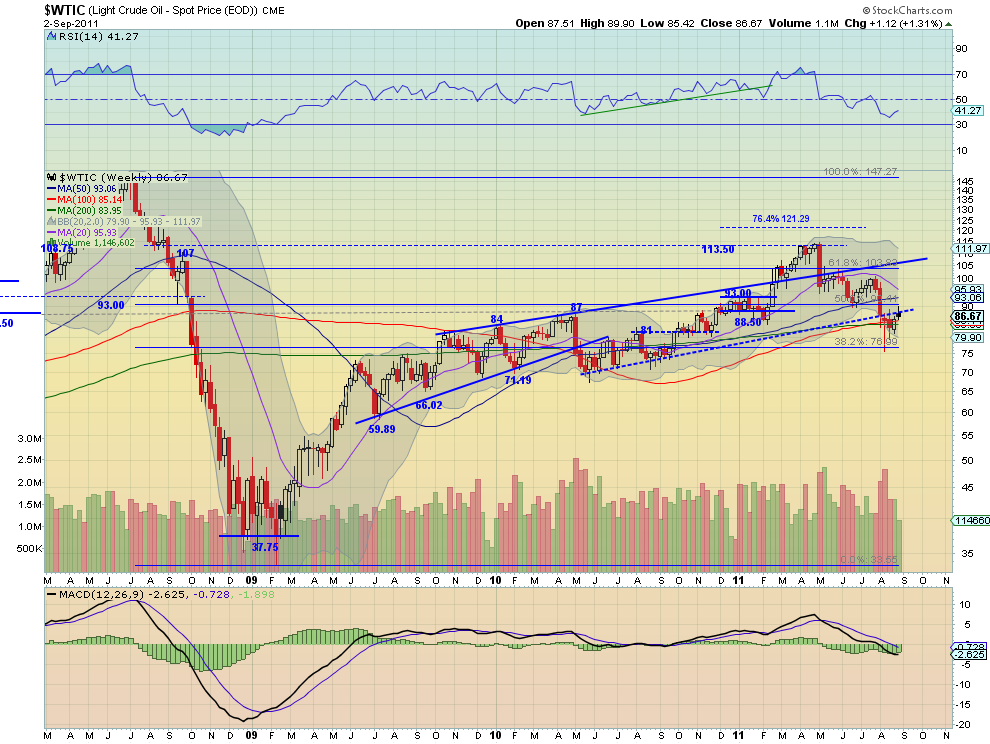
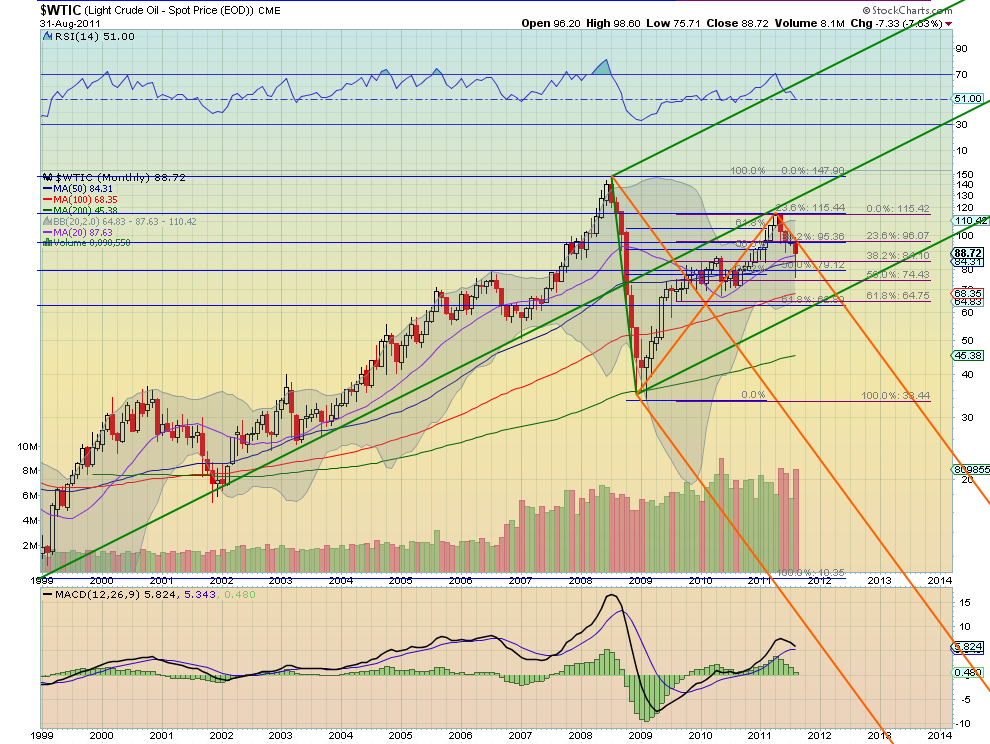
Crude Oil printed a Hammer candle this month, a possible reversal if confirmed higher, giving hope that the short move lower may be ending. But the RSI continues to look lower as it hits the mid line and the MACD is about to cross negative, both suggesting more downside to come. The upside should be capped by the overlapping Fibonacci levels a between 95.36 and 96 if it can get above the Upper Median Line of the bearish Pitchfork. Downside support comes first at 84.10 and then 79.12 and 74.43 before strong support at 71.

US Dollar Index, $DX_F

The US Dollar Index continued its series of tight doji’s after breaking the symmetrical triangle lower in March. The RSI continues to linger near 40 as the MACD stalls in negative territory. Both give no guidance for the future. The SMA’s continue to slope lower adding to the understanding that the trend is still lower. Any upside should be capped at a retest of the triangle near 77.50 and the downside support levels of 73 and 71.50 are the only thing between it and targets of 52 and then 40 on Measured Moves (MM) out of the triangle and from the 120 top in 2002.

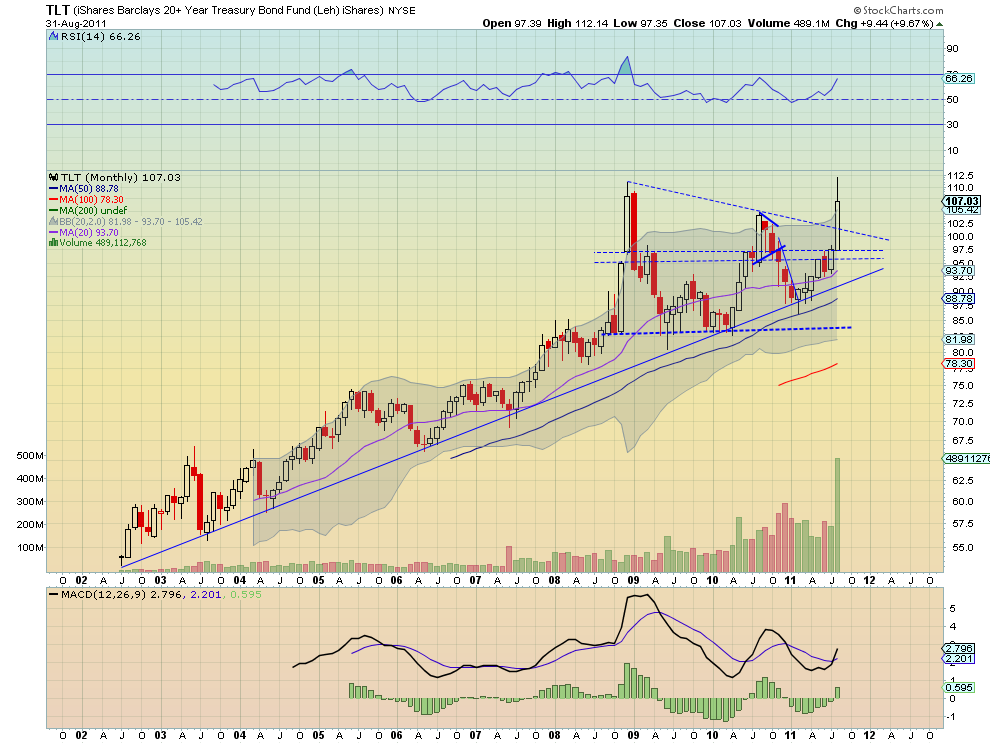
US Treasuries, $TLT

US Treasuries, as measured by the ETF $TLT, broke above the two year symmetrical triangle on massive volume. It has a RSI that points higher and a MACD that has just crossed positive both supporting more upside. It printed a double top near 112 and pulled back slightly just above the Bollinger band top, so it may consolidate. But longer term this chart looks bullish. If it can get over 112 it has a MM on the pattern break to 137! If that double top wins out and it moves lower, suggesting the volume is indicative of a blow off top, then support lower comes at the previous top in 2010 at 104.80 and the top rail of the triangle at 101.26 before a move back to the 95.30-97.50 area. Again, the chart favors the upside.

Shanghai Stock Exchange Composite, $SSEC

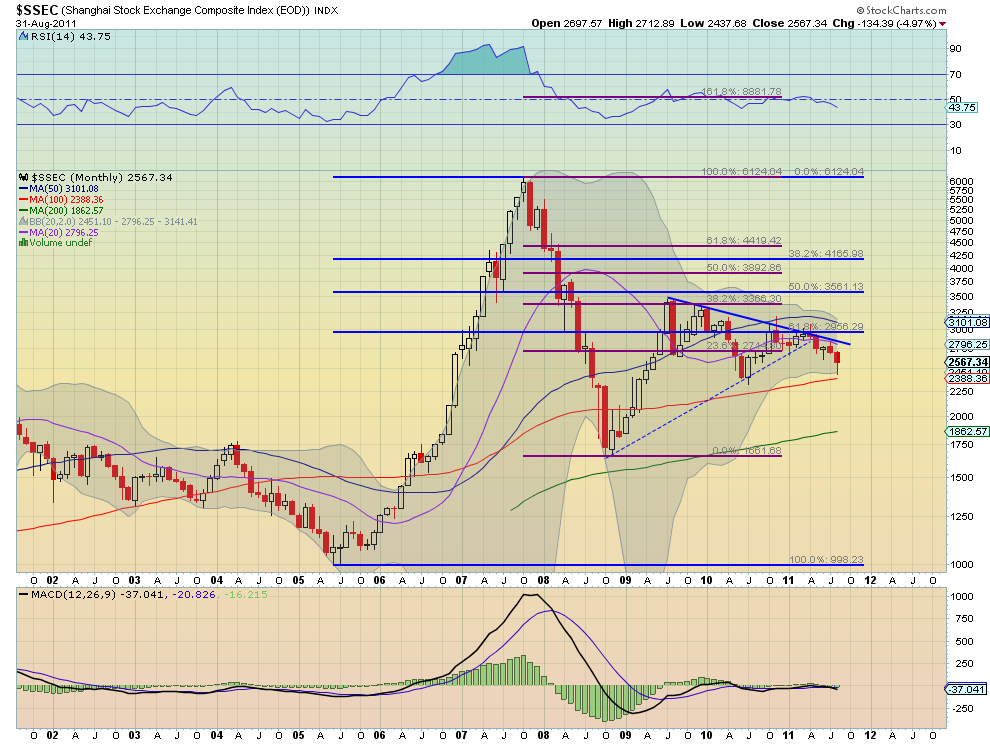
The Shanghai Composite continues to honor the resistance of the falling trendline. The RSI is now moving lower like the shorter SMA’s, and the MACD remains flat and not useful. Look for more grind lower from this Index with any upside moves capped at 2715. Support on the downside comes at 2415 and then 2050.

iShares MSCI Emerging Markets Index, $EEM

Emerging Markets, as measured by the ETF $EEM, rejected at the 48.20 resistance level and fell hard before recovering and retaking the 42.20 support level. The candle for the month, suggests more downside, despite the long shadow, and is backed up by a RSI that is rolling down hard and a MACD that is about to cross negative. Look for more downside in the coming months with any move higher capped at 44 and then the 48.20 area. Support for the anticipated move lower may slow it down at 42.20 followed by 37.40 and 36.

VIX, $VIX

The Volatility Index looks to have printed an interim double top at 48.22 this month with a long upper shadow similar to the other topping candle. With the Bollinger bands expanding it could be prepping for more upside. If so resistance should come at 35 and then the previous top at 48 followed by 60. But it appears more likely that the longer term move will be lower with support at 25.50 followed by 22.30 and 20.50. The charts above give a mixed view on the future of the $VIX so keep watching.

SPY, $SPY

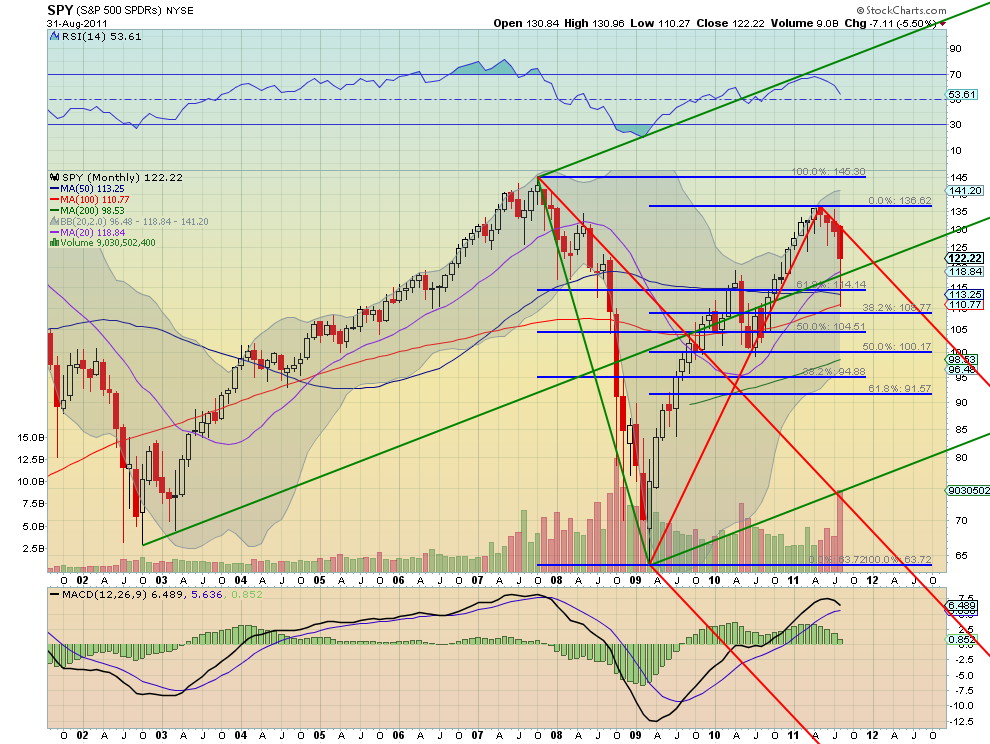
The SPY continued down along the Upper Median Line of the bearish red Pitchfork during August, printing a long bodied red candle with a long lower shadow, technically a Hanging Man since the long uptrend. The RSI pointing lower and the MACD heading towards a bearish cross negative suggest more downside to come. Any move higher over 123 can expect resistance at the Upper Median Line, near 131.20 and then 136.62. Support on a continuation downward comes at 118.50 and then next at 116 and 114 before 108.77.

IWM, $IWM

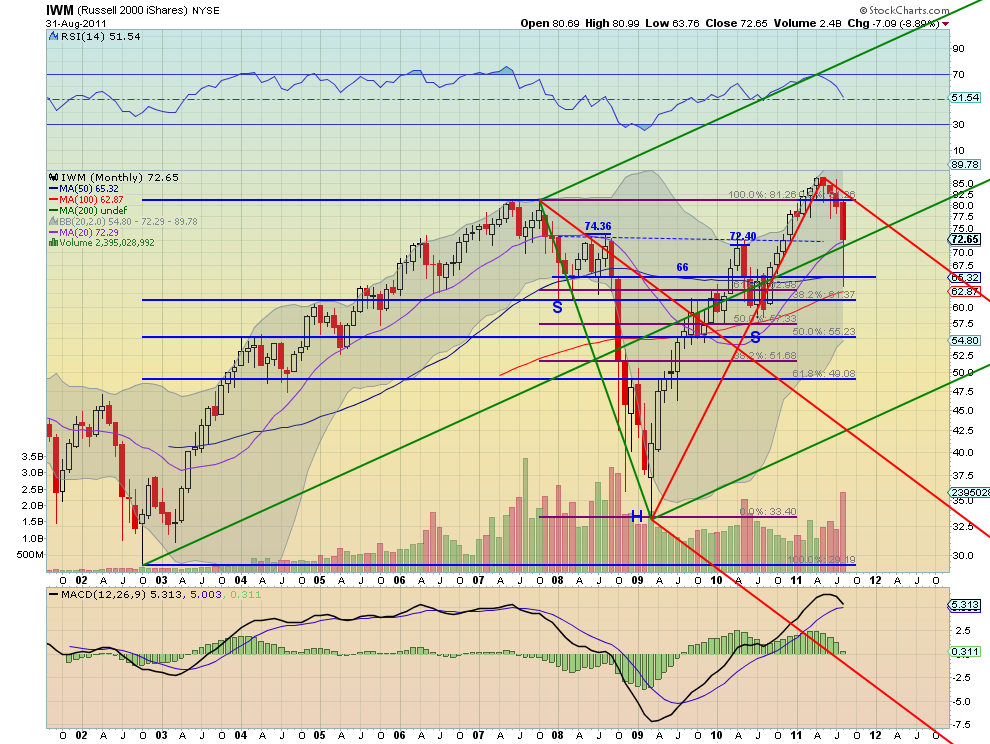
The IWM also continued down along the Upper Median Line of the bearish red Pitchfork during August, with the same characteristics of the SPY. The RSI pointing lower and the MACD heading towards a bearish cross negative suggest more downside to come. Any move higher over 73.60 can expect resistance at the Upper Median Line, near 81.15. Support on a continuation downward under 72.40 comes at 68 and then next at 66 and 63 before 61.37.

QQQ, $QQQ

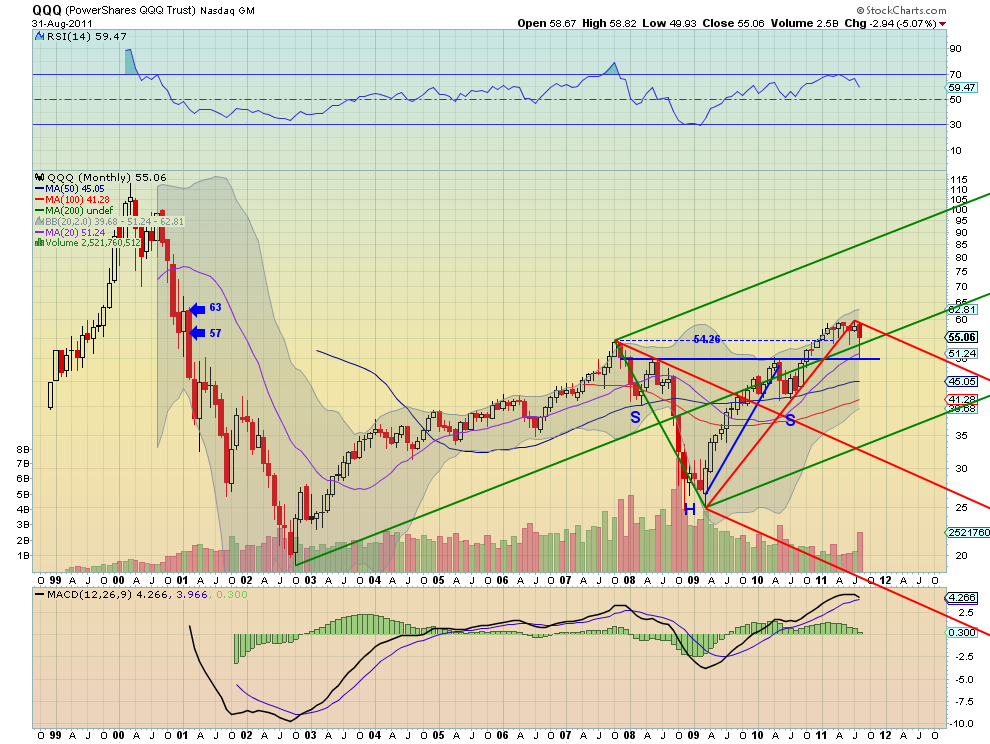
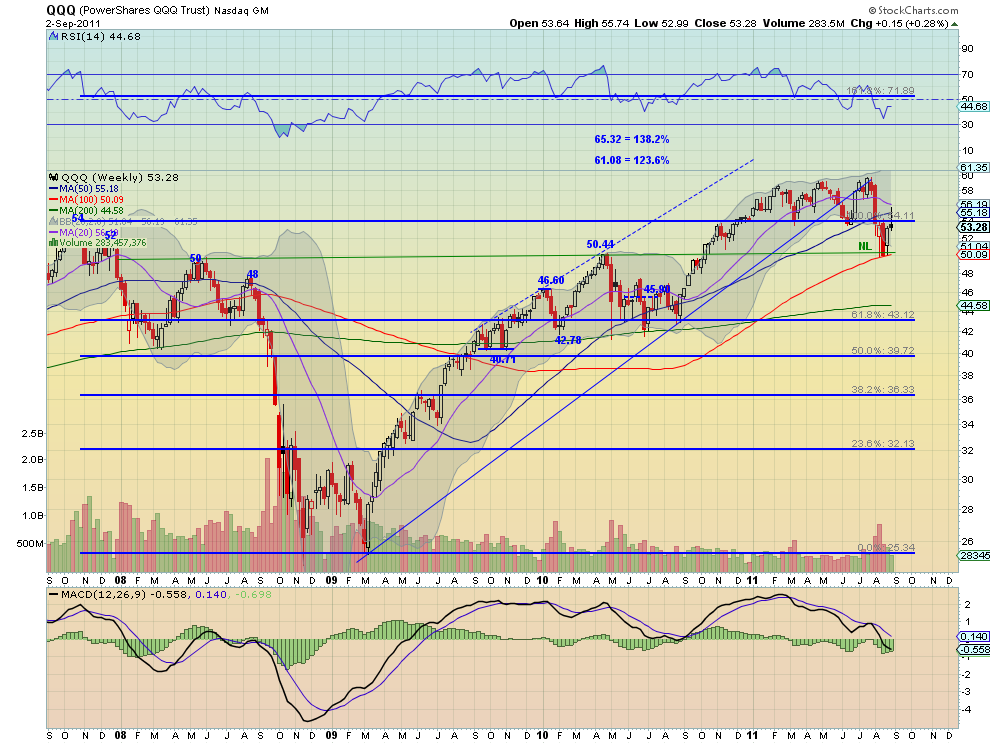
The QQQ continued to consolidate near its highs but with a wider candle reaching down from the Upper Median Line of the bearish red Pitchfork. Also a Hanging Man, it is bearish if confirmed lower next month. The RSI pointing lower and the MACD heading towards a bearish cross negative suggest more downside to come. Any move higher can expect resistance at 57 and then 60. Support on an expansion downward under 54.26 comes at 50 and then next at 46.20 and 44 before strong support at 42.20.

The monthly outlook suggests the upside for Gold and US Treasuries will continue while the trend lower for Crude Oil and the US Dollar Index will also continue. The Shanghai Composite and Emerging Markets look to continue to move lower as well. Volatility can go either way but looks to remain above the lower range experienced in the last six months with the VIX in a wide range between the mid 20′s and 48. Despite that uncertainty, the Equity Index ETF’s SPY, IWM and QQQ are set up to continue lower in the coming months. As noted on the individual charts there is room for some short term upside without breaking the downward bias. Use this information to understand the long term trends in Equities and their influencers as you prepare for the coming months.

Saturday, September 3, 2011

Macro Week in Review/Preview September 3, 2011


Last week’s review of the macro market indicators looked like the unofficial last week of Summer would bring Gold to bounce around in its uptrend while Crude Oil slowed at resistance and turned lower. The US Dollar Index seemed content to move sideways while US Treasuries were biased lower. The Shanghai Composite and Emerging Markets were biased to the downside with risk of the Chinese market running a little higher first. Volatility looked to remain elevated keeping the bias lower for the equity index ETF’s SPY, IWM and QQQ, despite the moves higher the previous week, with the QQQ looking to have the best chance to break the bear flags higher.

The week began with Gold meandering sideways and Crude Oil hitting the breaks at resistance. The US Dollar Index was behaving as anticipated but US Treasuries were finding some support. The Shanghai Composite drifted lower while Emerging Markets caught a bid and moved higher. Volatility tailed off but only marginally as the Equity Indexes SPY, IWM and QQQ rose. And then Friday happened pushing Gold and Bonds higher and Crude Oil and Equities lower. What does this mean for the coming week? Lets look at some charts.

As always you can see details of individual charts and more on my StockTwits feed and on chartly.)

Gold Daily, $GC_F

Gold Weekly, $GC_F

Gold spent most of the week building an ascending triangle under resistance of 1840 before launching over it on Friday to resistance near 1875. The daily chart shows a Relative Strength Index (RSI) that held well over the mid line and is moving higher and a Moving Average Convergence Divergence (MACD) indicator that is about to cross positive. The weekly chart remains bullish with upward sloping Simple Moving Averages (SMA), a MACD that is increasing and a RSI that remains high. The only concern about more upside in these charts is that the weekly RSI is over 80, and volume has been decreasing, but not a reason to sell. The triangle break has a target of 1930 with resistance at 1900 along the way. Look for Gold to head toward that target and possibly beyond in the coming week to the Measured Move (MM) of 2225 if it gets over 1940. Any pullback should find support at 1840 and 1800 below that.

West Texas Intermediate Crude Daily, $CL_F

West Texas Intermediate Crude Weekly, $CL_F

Crude Oil found resistance at the long term support/resistance line at 88.50 and fell back Friday. The RSI on the daily chart is now rolled lower and pointing down and the MACD is starting to fade. The SMA’s have been successively rolling lower also with only the 200 day SMA left. The weekly chart reinforces the rejection with the rising resistance line, but shows both the 100 and 200 week SMA as support underneath. The RSI on this timeframe has been trending lower but currently cricked higher, while the MACD is negative but has been flat. Look for Crude to continue lower next week toward support at 84. A move below 81 would trigger the next leg down with a target of 77. Any move above 88.5 will find resistance at 90.

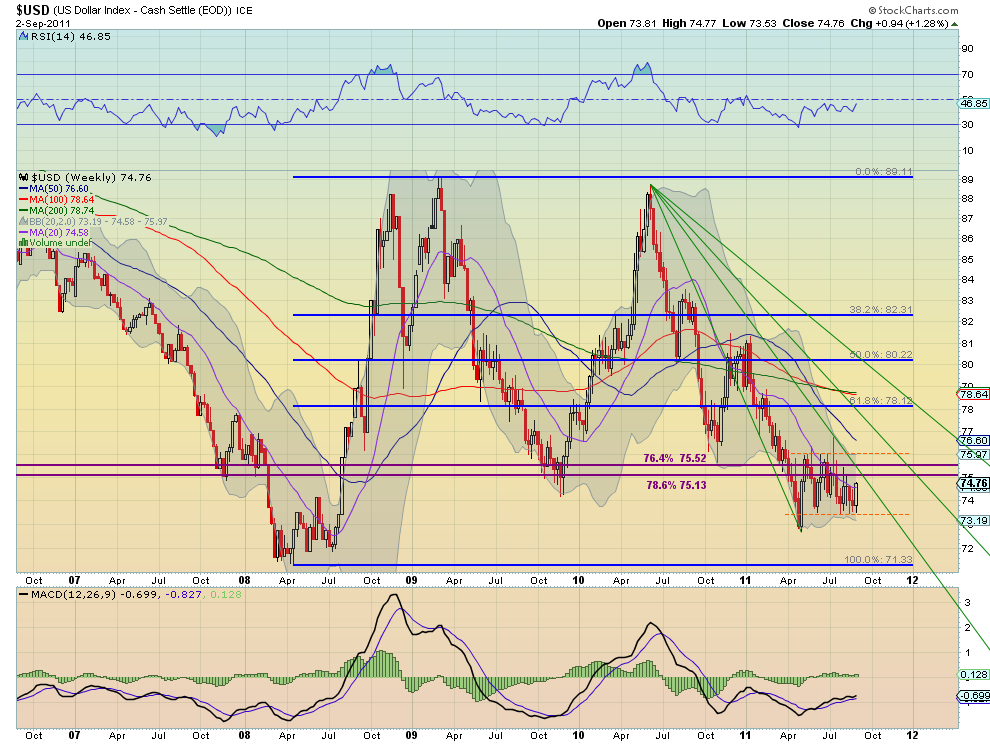
US Dollar Index Daily, $DX_F

US Dollar Index Weekly, $DX_F

The US Dollar Index broke higher above the descending triangle with in the 73.50 to 76 channel this week. It has a RSI on the daily chart that is rising and a MACD that has crossed positive, both suggesting more upside to come. The weekly chart is more middle of the road looking with the range in tact and the RSI shuffling along just below the mid line while the MACD stays near zero as it moves one week closer to the first Fibonacci fan line. Look for the Index to spend time in the top half of the channel next week. Any move over 76 should find resistance at 77.50 and a move below 73.5 support at 73 and 72.

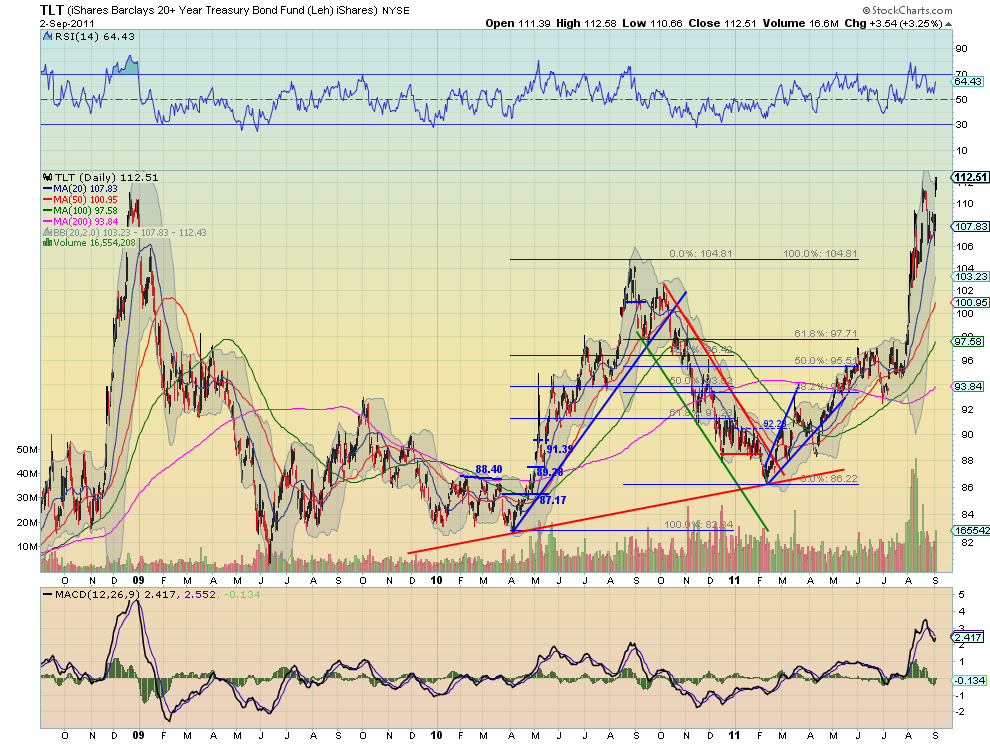
iShares Barclays 20+ Yr Treasury Bond Fund Daily, $TLT

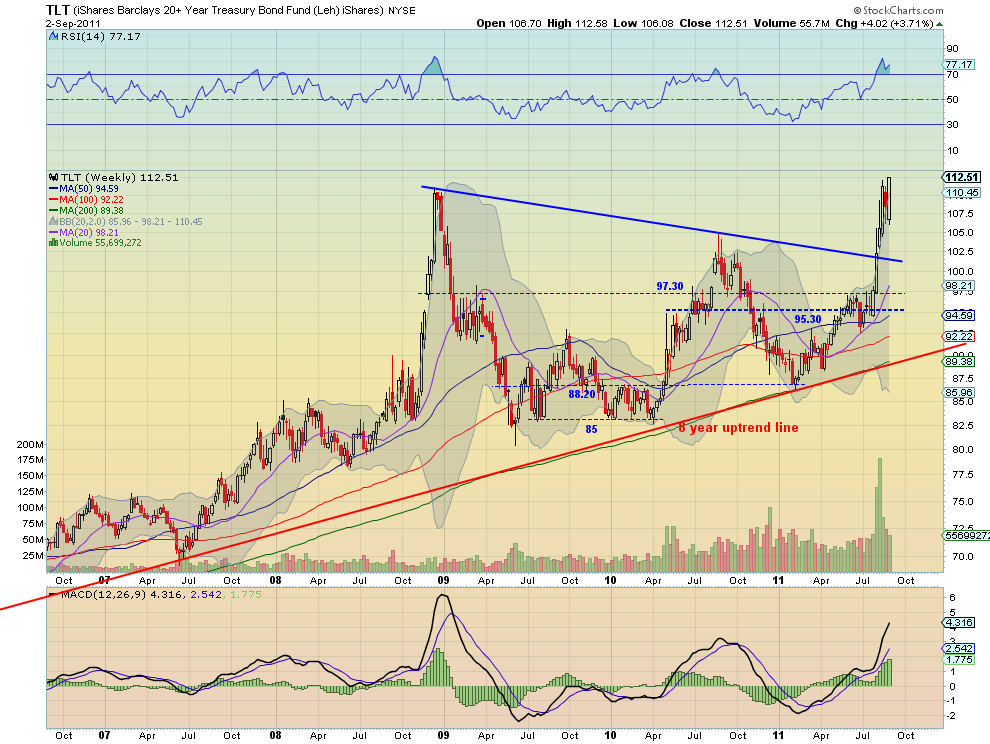
iShares Barclays 20+ Yr Treasury Bond Fund Weekly, $TLT

US Treasuries, as measured by the ETF $TLT, consolidated higher for most of the week before breaking to new highs on Friday. The RSI is in bullish territory and currently rising while the MACD has moved back to the zero line and looks ready to cross higher, on the daily chart. The weekly chart shows a strong white candle closing nearly on the high in a bull flag. The RSI is elevated but not extreme at 77.17 and the MACD continues to increase. Look for more upside in Treasuries next week with targets higher on a MM to 120.70 and then 137 from the symmetrical triangle pattern breakout on the weekly chart. Any downside move should find support before 104.80 at either 108 or 106.

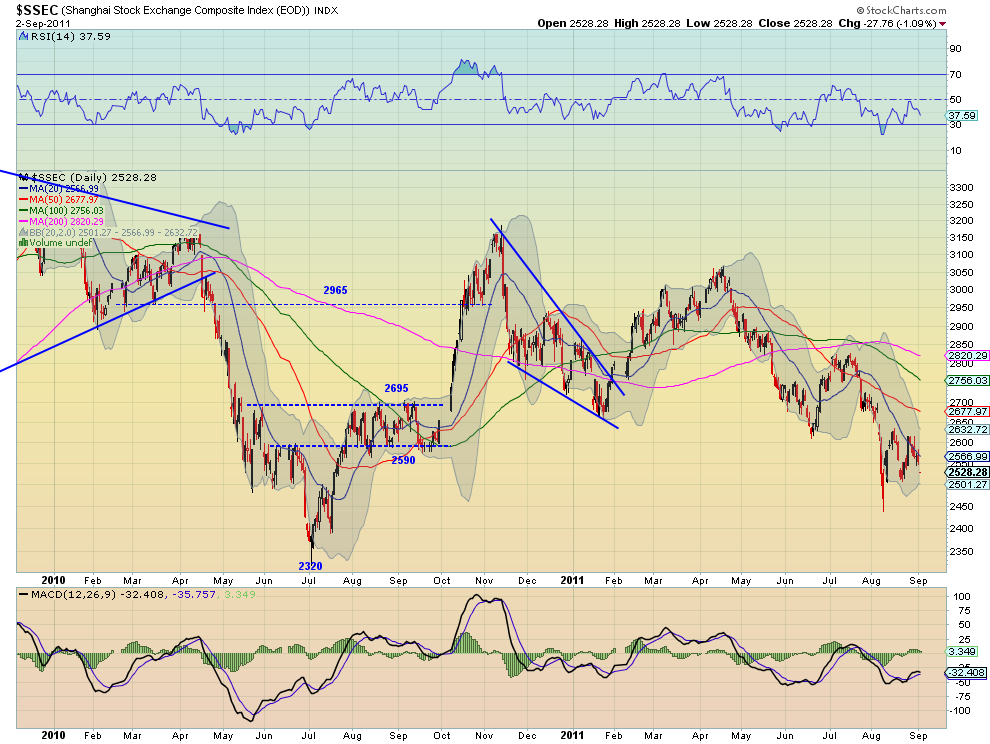
Shanghai Stock Exchange Composite Daily, $SSEC

Shanghai Stock Exchange Composite Weekly, $SSEC

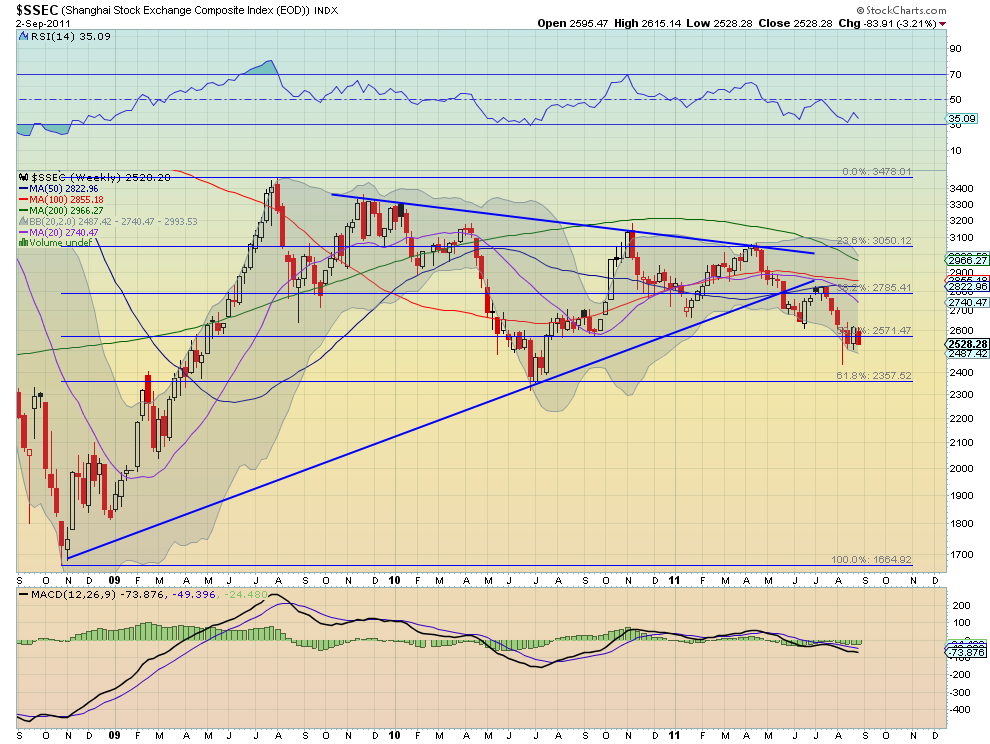
The Shanghai Composite is in a bear flag or continuation symmetrical triangle and moved lower in it this week. The daily chart shows the RSI indicating for more downside with a MACD that is rather flat. The weekly chart shows the flag is right at the 50% Fibonacci level of 2571 form the move up from 2008 to 2009. The RSI is heading lower and the MACD is flat on this timeframe. Look for more downside in the coming week with support lower at 2500 and then 2450. A break below that leads to a test of the 61.8% Fibonacci at 2357 and a target on the MM lower at 2260. Any upside surprise should find resistance at 2590 and then 2695-2700.

iShares MSCI Emerging Markets Index Daily, $EEM

iShares MSCI Emerging Markets Index Weekly, $EEM

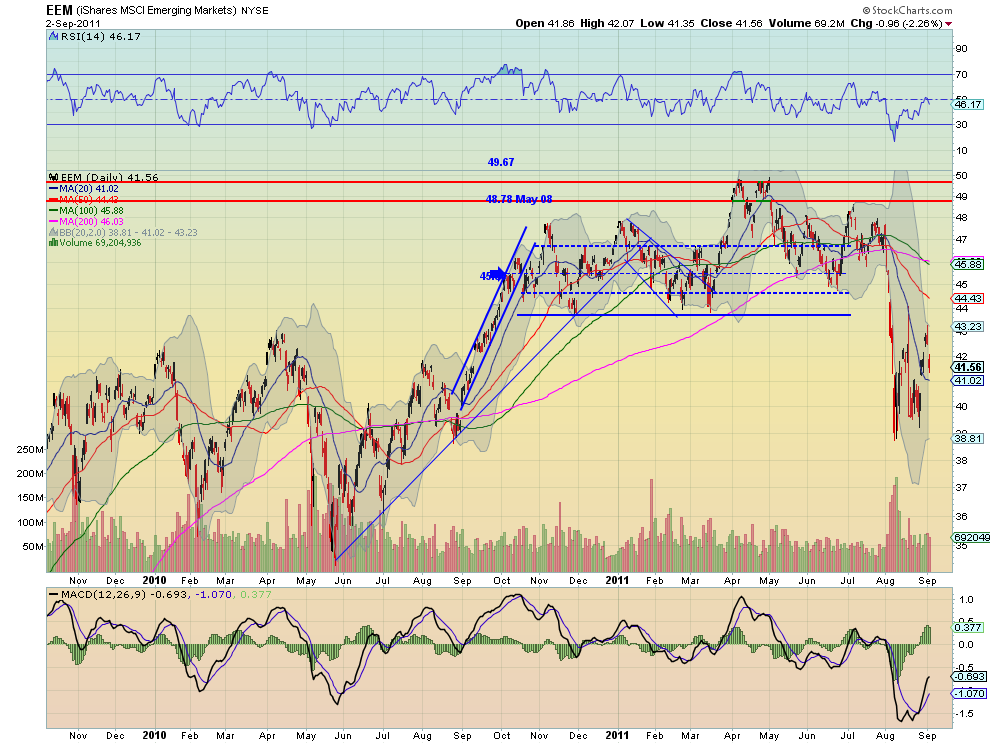
Emerging Markets, as measured by the ETF $EEM, made a move higher early in the week only to be contained by what might be the beginnings of a symmetrical triangle as resistance and close lower Friday. The RSI met the mid line and rejected lower while the MACD peaked and is now waning on the daily chart, with all of the SMA’s sloping lower. The weekly chart shows the reach higher with the long shadowed candle but unable to hold over the 42.54 support/resistance level. The RSI is suggesting upside on this timeframe and the MACD is starting to improve. The path in the short run looks lower with any upside contained at 42.54 with a hold over that level leading to a shift in thinking. Next week support comes at 39 and a break below that puts a move to to support at 35.91 on the way to a MM at 32 into play.

VIX Daily, $VIX

VIX Weekly, $VIX

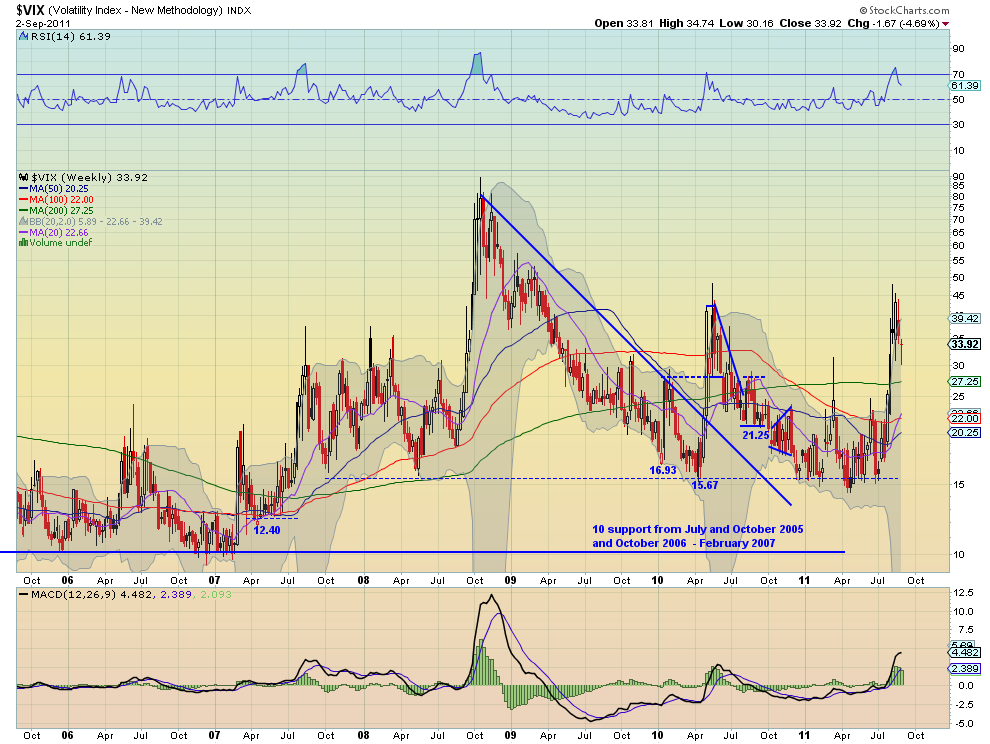
The Volatility Index pulled back but held support at 30 before rising to close the week. The RSI on the daily chart bounced higher after hitting the mid line and the MACD peaked negative and is now improving. The weekly chart has the RSI falling and the MACD starting to move back toward zero. Divergence between timeframes. Look for volatility to remain elevated relative to the first 7 months of the year but a move below 28 could change that quickly. Conversely a move over 38 should lead to a retest of the 44 to 48 range. Look for more in the 28 – 38 range next week.

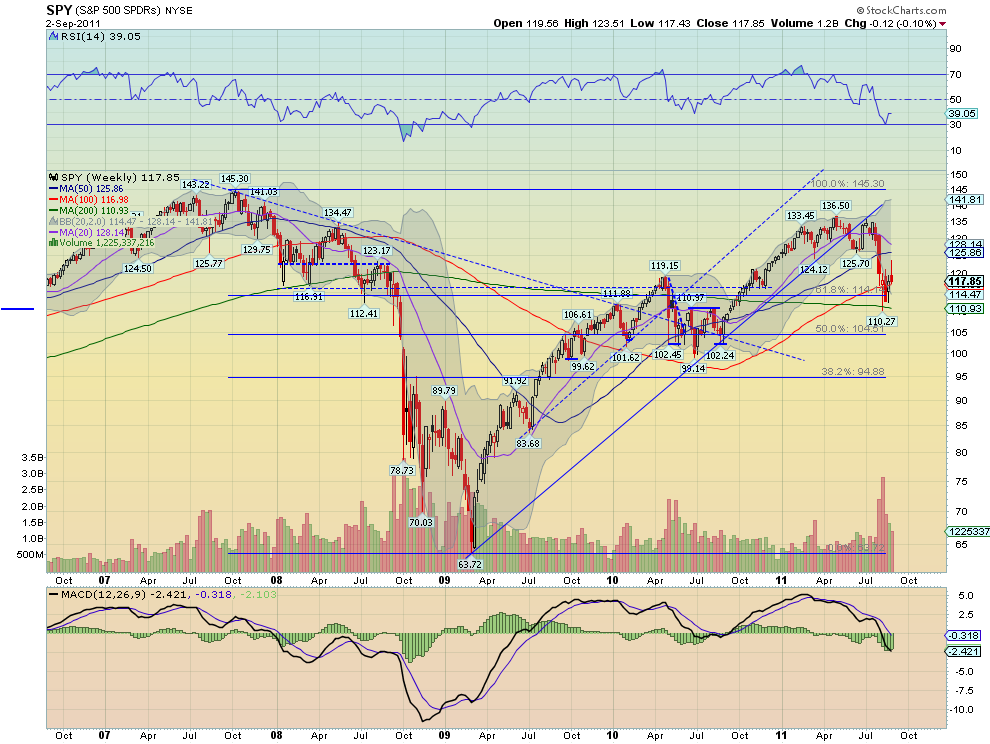
SPY Daily, $SPY

SPY Weekly, $SPY

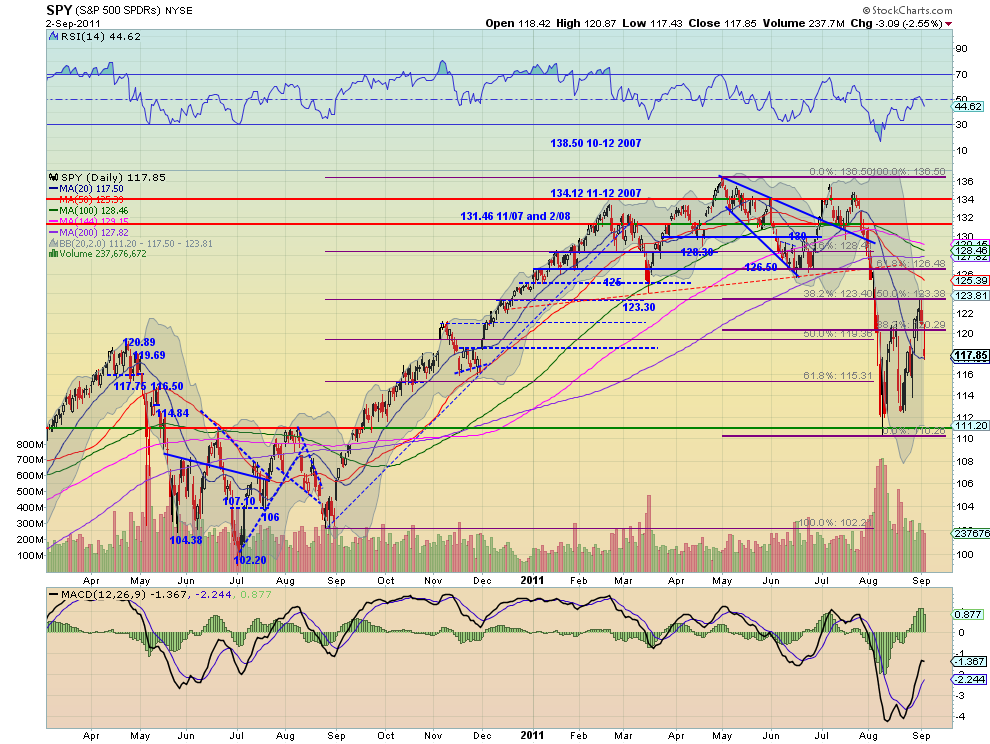
The SPY rose early in the week but fell hard Friday after printing a Tweezers Top with topping tails halting at the 20 day SMA. The RSI on the daily chart turned lower at the mid line and the MACD is waning. On the weekly chart the long upper shadow may be foreshadowing more down side out of the bear flag. The RSI however is rising off of the low and the MACD is improving on this time frame. The trend is lower and look for that to continue next week with any upside move held at 121.50 or 123.40 above that. Any more and the down trend is in question. To the downside if support at 112.4 does not hold then the next levels down for support come at 111.15 and 104 on the way to the MM target of about 95.

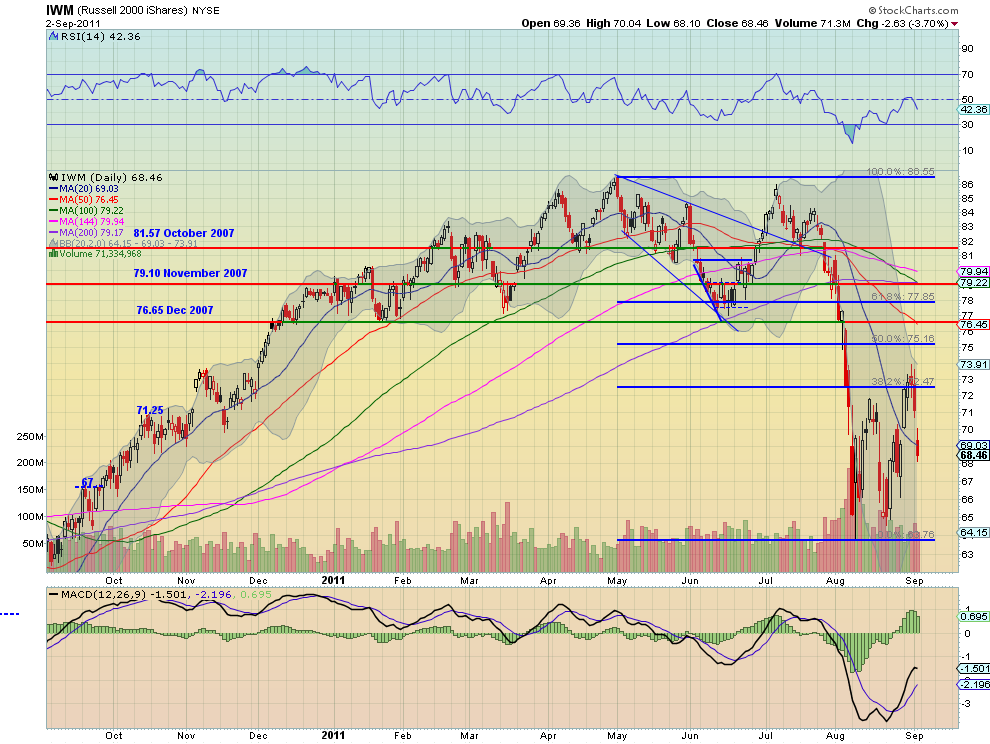
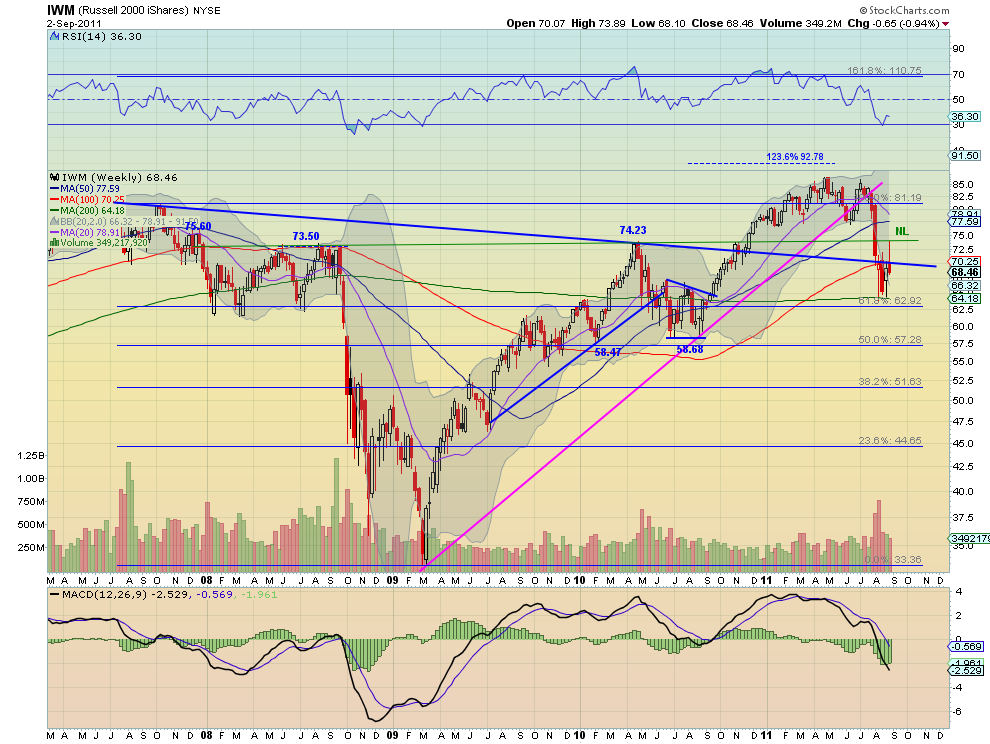
IWM Daily, $IWM

IWM Weekly, $IWM

The IWM rose early in the week but also crashed Friday after printing a topping tails at the 38.2% Fibonacci retracement of the move lower, halting under the 20 day SMA. The RSI on the daily chart turned lower at the mid line and the MACD is waning. On the weekly chart the long upper shadow at the extended neckline of the previous inverse Head and Shoulders is showing more down side out of the bear flag. The RSI is rising off of the low but cricking back down and the MACD is improving on this time frame. The trend is lower for next week with any upside move held at 71.60 or 73.60 above that. Any more and the down trend is in question. If the downside support at 65 does not hold then the next level down for support comes at 62.8 on the way to the MM target of about 48.

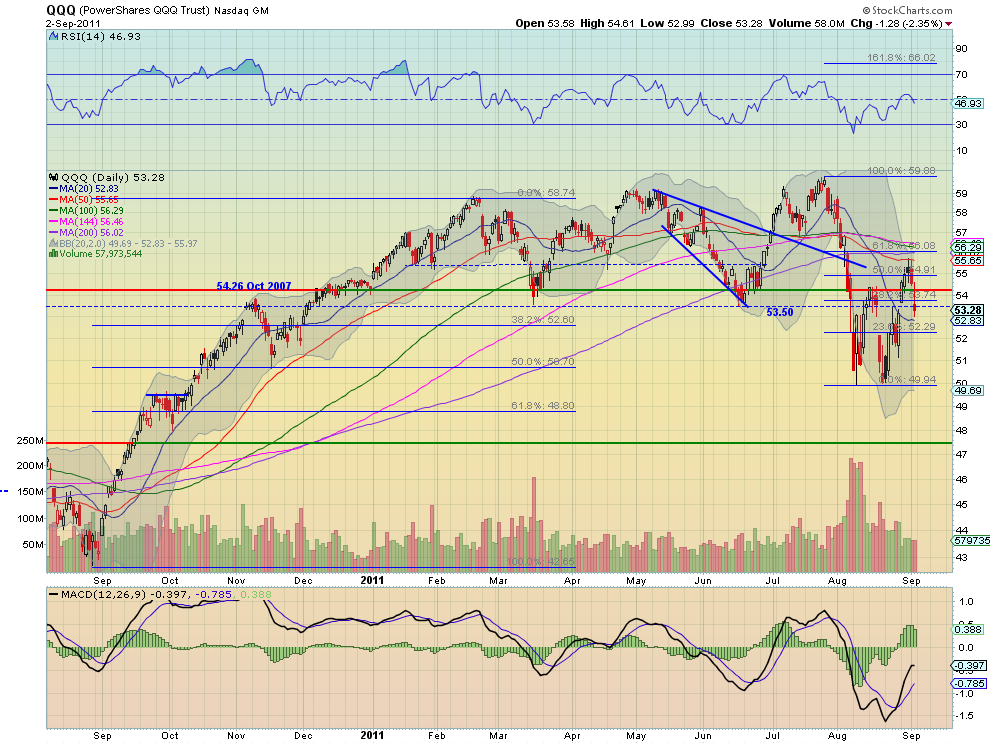
QQQ Daily, $QQQ

QQQ Weekly, $QQQ

The QQQ also rose early and fell hard Friday after a Tweezers Top with topping tails at the 50 day SMA halting just above the 20 day SMA. The RSI on the daily chart turned lower under the mid line and the MACD is waning. On the weekly chart the long upper shadow may be foreshadowing more down side out of the bear flag. The RSI however is rising off of the low but cricking lower again and the MACD is improving. The trend is lower for next week with any upside move held at 54.26 or 55.50 above that. Any more and the down trend is in question. if the downside support at 50.00 does not hold then the next levels down for support come at 48 and 46 on the way to the MM target of about 40.

Next week looks like the moves that revealed themselves Friday will continue. Gold and US Treasuries are ready to continue higher. Crude Oil looks poised to drop further and the US Dollar Index to move sideways in the top of its range. The Shanghai Composite and Emerging Markets look to continue lower. Volatility looks to continue elevated with the US Equity Index ETF’s SPY, IWM and QQQ ready to continue lower in their bear flags. US Treasuries breaking out and Gold racing higher again could be the catalyst for a break of the bear flags lower. Use this information as you prepare for the coming week and trade’m well.

Follow Us