Showing posts with label copper. Show all posts

Saturday, September 24, 2011

Dollar Index Joining Treasuries in the Smack Down


Wednesday US Treasuries ($TLT) delivered a smack down, putting the US Equity Markets ($SPY) and Gold ($GLD) in their place. This was detailed in the link below. Thursday this continued with the US Dollar Index, Copper and Crude Oil taking sides. Let’s take a look.

US Dollar Index, $DX_F

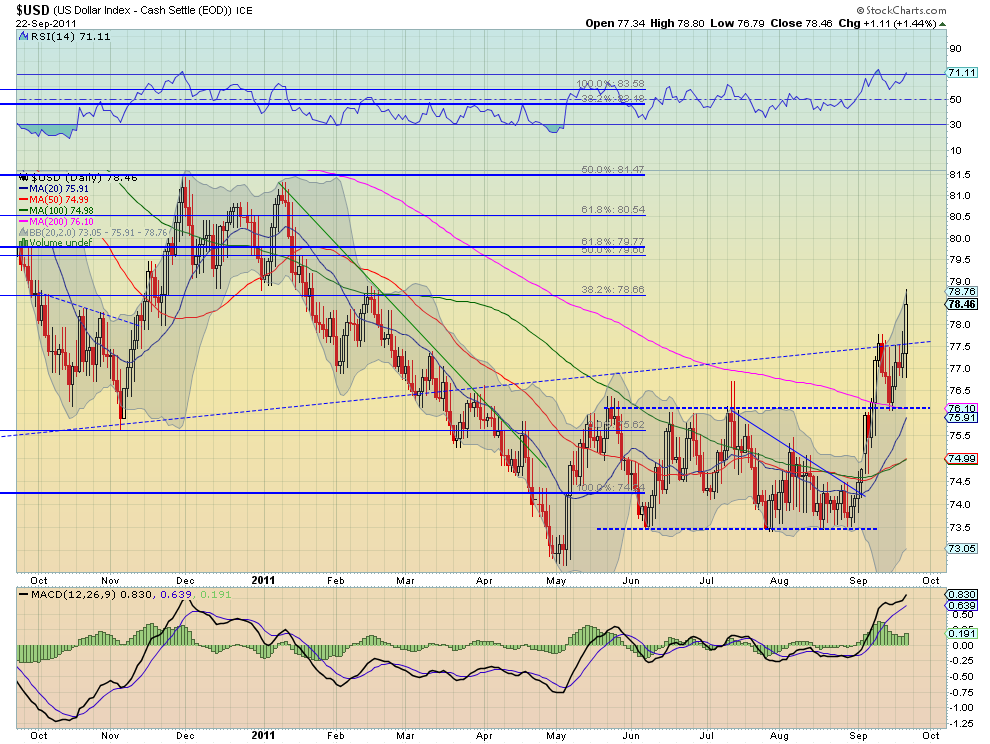
The US Dollar Index ($DX_F, $UUP) was the big winner launching through the 3 year rising trend resistance out of a bull flag. The measured move out of the flag is to 80.10 but it has some resistance along the way at 79, and then 79.28, and 79.60. The rising Relative Strength Index (RSI) and increasing Moving Average Convergence Divergence (MACD) indicator support more upside. Like Rocky Balboa, almost down for the count, it is rising up off the mat to take on the world, joining Treasuries.

Copper, $HG_F

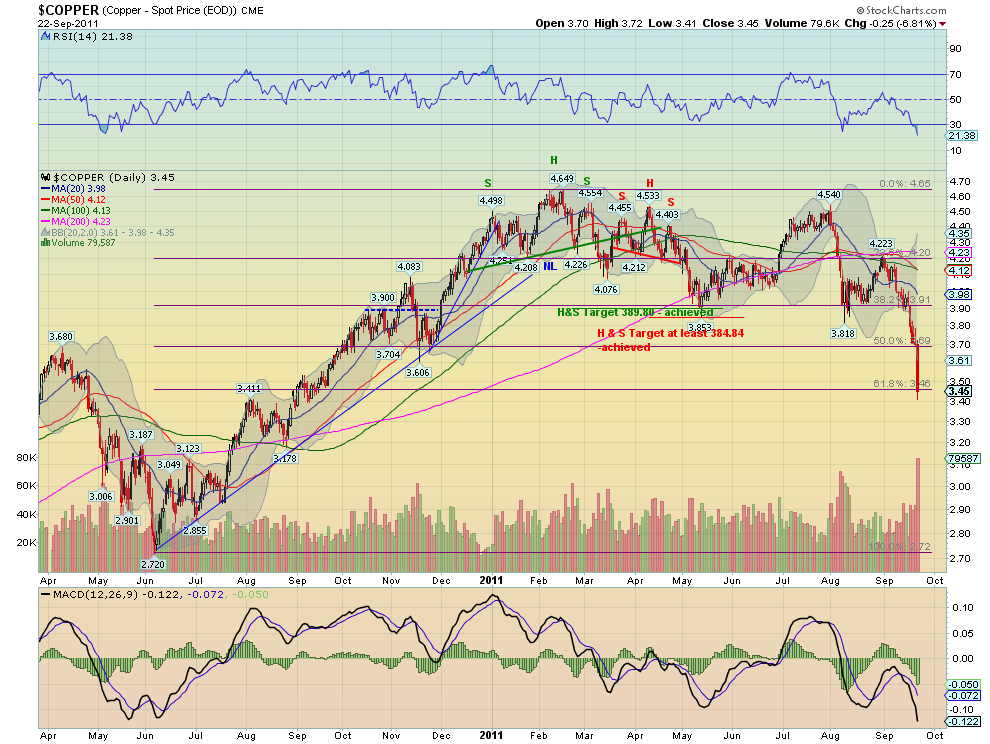
Copper ($HG_F, $JJC), thought by many to be the tell for future market direction, responded with only bad news. Falling through support at 3.69 and now attempting to hold support at the 61.8% retracement of the move higher from June 2010, at 3.46 it’s best hope is that the RSI is becoming oversold. That said the trend is down and the indicators suggest more to come. If it is a market tell then this is not a pretty story to come.

Crude Oil, $CL_F

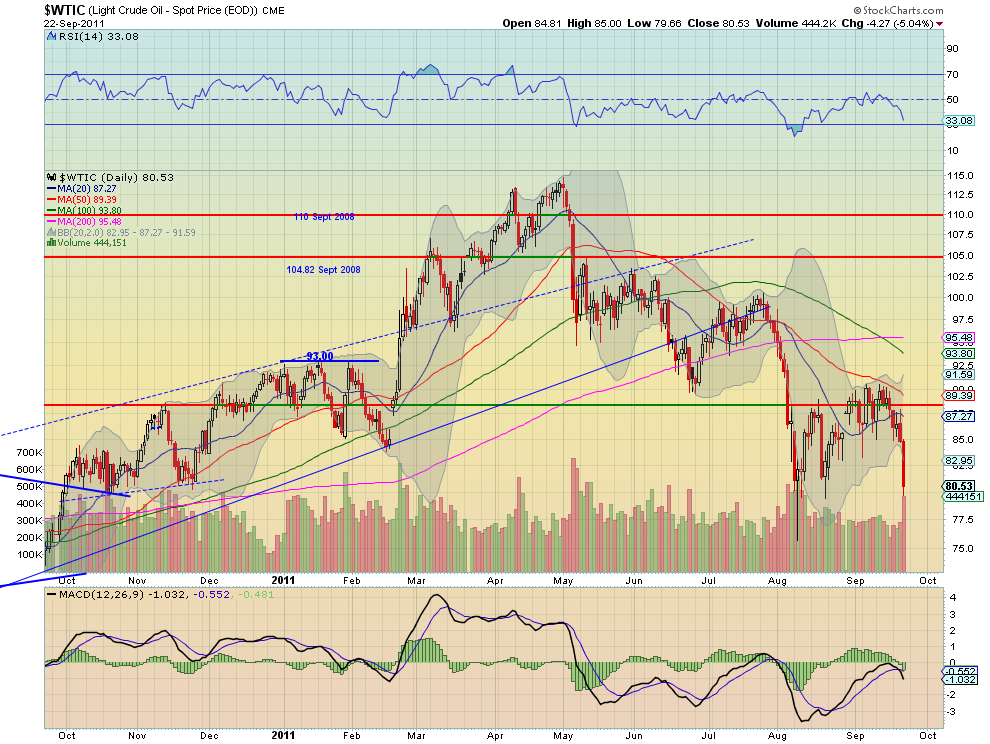
Crude Oil ($CL_F, $USO) was also a casualty of the recent global moves. It finally broke the bear flag lower, and now sees its next support at 77 and has a target on a Measured Move to 70. The RSI and MACD also point to more downside.

Looks like the new world order, at least for the short run, has been set over the last two days. US Treasuries and the US Dollar are in charge and driving all risk assets and economically sensitive assets lower. Treasuries and the US Dollar up, at the expense of the US Equity Indexes, Gold, Crude Oil, and Copper. Paper promises outperforming hard assets and profitable companies. May God help up.

Sunday, September 18, 2011

Copper Says the Markets Still Suck….Everywhere


Many use Copper as a tell on the future direction of the market. So what does Copper say about the current market? Using the iPath Dow Jones-UBS Copper Subindex Total Return ETN, $JJC, it is not a pretty picture. The chart below shows that it is testing support at 51 for the fourth time

since May. And as it does the Relative Strength Index (RSI) has rejected at the mid line and is heading lower and the Moving Average Convergence Divergence (MACD) is about to cross negative. Translation: On support but set up to go lower. But the US is not the only place in the world that uses Copper. China is supposed to be a growth engine. What doe Copper look like priced in Yuan? The ratio chart below translates the $JJC into Yuan using the WisdomTree Dreyfus

Chinese Yuan Fund, $CYB. This is also testing support, with deteriorating technicals. Hard to say that the Chinese are drag the world out of the economic morass from looking at the demand for Copper in Yuan. But what about that block of people in Europe working and trading together as an economic unit? The ratio chart below of the $JJC against the the Currency Shares Euro trust, $FXE, translates Copper into Euro. Although it has been in an uptrend for two weeks and now holding above the gap support at about 0.375, the RSI and MACD are pointing to a move lower. Perhaps it will also move back to test support at 0.36. Nothing strong about that.


Friday, August 19, 2011

A Panic Low in Copper, FCX?


Copper prices peaked in February as concerns over the growth rate in China, and therefore, the overall demand for copper, was a reason to sell. The Chinese cut back copper imports severely in the spring and prices have continued lower. Copper prices were hit hard last week when concerns over a new recession in the US added additional pressure on prices.

Though copper rebounded sharply from last week’s lows, Germany’s disappointing GDP numbers have increased concerns over the nation’s economy and dampened bullishness.

Chinese imports started to increase in June and recent reports from the London Metals Exchange indicate that Chinese buying has caused the copper inventories to decline in Asian warehouses.

So what’s ahead for copper prices? Technically, the decline from the highs early in the year just looks like a normal correction. Last week’s drop may have marked a panic low in copper prices and copper-mining stocks like Freeport-McMoRan Copper & Gold (FCX).

Let’s look at why another drop in copper prices could provide a good buying opportunity.
chart  

Chart Analysis: The S&P GSCI Copper Spot Index is based on the spot price of the copper futures traded on the London Metals Exchange. The index tested its weekly uptrend from the 2009 low, line a, last week, but closed well above it. The low last week was below the weekly Starc- band.
  • The trading range, lines a and b, looks like a continuation pattern that should be resolved to the upside with targets in the 790-810 area. This is about 26% above current levels
  • There is initial resistance at 657-665 with stronger resistance in the 686 area
  • A close above the 705 level would complete the continuation pattern
  • Initial support now stands at 614 with major support in the 570 area, which corresponds to the highs from early 2010
  • The major 38.2% support level is at 521.25

One of the best ways to trade copper prices—besides futures contracts—is the iPath Dow Jones-UBS Copper Sub-Index Total Return ETN (JJC). The weekly chart shows a long-term pattern of higher highs and higher lows going back to the early-2009 lows, line c.
  • The flag formation (lines a and b) is typical of a correction within an uptrend, and last week’s low at $50.59 held above the 50% Fibonacci retracement support at $49.30
  • This support also corresponds to the trend line support (line b) and the November 2010 lows at $49
  • The weekly on-balance volume (OBV) did confirm the early-2011 highs, but the heavy selling over the past few weeks has taken the OBV below support at line d
  • There is initial resistance now at $54.30 and then in the $56.50 area
  • A completion of the chart formation (lines a and b) has upside targets in the $65 area, which also corresponds to the 127.2% Fibonacci retracement targets
Freeport-McMoRan Copper & Gold (FCX) peaked at $61.34 in January, and with last week’s low of $41.20, it had dropped 32.8% from the highs.
  • FCX closed well of the lows last week at $45.40, leaving a long tail on the weekly candle chart. Similar action was seen at the March lows (see circles)
  • The weekly uptrend, line f, was broken on last week’s drop, and the 38.2% support from the 2010 lows ($40.90) was almost reached
  • The relative performance, or RS analysis, appears to be reaching a critical juncture. The long-term support, line h, from the 2009 lows was broken early this year. It has rallied from the lows and needs to move through its downtrend (line g) and its previous peak (see arrow) to signal it is outperforming the S&P 500
  • A drop in the RS below this year’s lows would be negative
  • The on-balance volume (OBV) is acting much stronger than prices, as it shows a pattern of higher lows in contrast to the price action. It is well above short- and long-term support (line i)
  • FCX has rebounded back to first resistance in the $47 area. The 38.2% resistance has been overcome, which indicates the 50% resistance at $51.20 should eventually be reached
What It Means: Though copper prices, FCX, and JJC have all been correcting from the highs made early in the year, the weekly chart patterns suggest that this is just a pause in the longer-term uptrend.

Tuesday, July 26, 2011

Copper On The Rebound?


Copper slightly disappointed investors, ending the first half of the year with a decline of 3.50 percent. Worries about global inflation and, more specifically, the potential slowing of China’s economy weighed on copper’s price. The red metal rose 5 percent quickly in the new year, but similar to zinc, lead, palladium and platinum prices, declined sharply at the beginning of May.


Copper on the Rebound?

Since the end of June, copper has been slowly inching its way up, with the past three weeks having produced positive results. Part of this rise is due to reduced supply issues. Chile, the world’s largest copper producer, has been plagued by power outages, strikes, accidents and heavy rains.

Reuters recently reported that a “once in a half century winter storm” caused more than 12 mines to slow or stop operations after the open pit roads became too slippery in the South American country that mines about one-fifth of the world’s copper.

The election of Ollanta Humala in Peru–the second-largest producer of copper–has also been a drag on copper prices as investors debate the probability of Humala electing a mining friendly cabinet. As I discussed in “Is Peru’s Humala Jekyll or Hyde for Mining?,” investors have worried the president-elect could retract policies that encourage mining investment and help grow their economy.

The announcement came this week that Humala will appoint Luis Miguel Castilla, Peru’s former deputy finance minister, as the new finance minister. Carlos Herrera will lead the mines and energy ministry. However, according to the Financial Times, it is still not clear whether Humala will increase the corporate tax rate paid by miners and enforce tighter state controls. The actions of this leader will have an influence on the direction of copper prices for the remainder of the year.

In terms of demand, copper is a necessary ingredient for numerous building projects. Electrical power cables, electrical equipment, automobile radiators, cooling and refrigeration tubing, heat exchangers and water pipes all require copper. With all the construction and infrastructure building in China over the past several years, it’s not surprising that this country is the No. 1 world consumer of copper. It’s estimated that China accounted for nearly 40 percent of global copper consumption last year.

Because of this large demand, similar to our outlook for oil, copper prices hinge on China’s ongoing development. While some have begun to wonder about the health of the country’s continuing growth and development, Macquarie Research believes that “real demand in the country remains robust.”

Take developer activity, for example, which Macquarie says has been a huge driver of construction growth in 2011. The media has focused its attention on ghost cities and lagging sales of property in China. Yet Macquarie thinks it’s important to consider the property sales across all different sizes of cities. In its Commodities Comment, subtitled “Chinese social house – another reason to buy copper and iron ore,” Macquarie acknowledges a weakness in property transactions in China’s larger cities. This was due to the government restricting investment demand to slow growth. However, these larger cities only account for 20 percent of the total market, says Macquarie.

Conversely, many smaller cities, such as Anquing, Guizhou, Luzhou, Mudanjiang, and Shijiazhuang, have had double-digit year-over-year growth in unit sales so far this year. In the case of Hohhot, the capital city of Inner Mongolia, sales growth has tripled. Government investment has led to urban space increasing from 80 square kilometers in 2000 to 150 square kilometers last year, according to the city’s government website. Hohhot, which means “green city” in Mongolian, has grown to more than 2 million people and has become a hub for agriculture and manufacturing.

Property Sales Strong in Smaller Cities

Most importantly, Macquarie says the tremendous sales activity in these smaller cities indicates “there has been enough cash to keep construction activity going.”

In addition, China’s social housing project should drive incremental demand for copper. Macquarie indicated that China is “aiming for 10 million social housing units, up from 5.8 million in 2010.” The country has built only 3.4 million units so far this year, but based on China’s habit of exceeding its objectives, Macquarie thinks the target will be met.

Even if the naysayers think China’s growth will slow because of the government’s monetary policy restrictions, there’s consensus among research experts that the country’s inventory of copper is getting low. Goldman Sachs’ discussion of the copper market indicated that in the second half of 2011, the “winding down of destocking will lead to a stronger Chinese pull on global supply.” China seems to have no choice but to go back to the market for copper, if only to replenish its supply.

Tom Kendall, Credit Suisse’s vice president for commodities research, agrees. In a Mineweb interview on copper’s fundamentals and expectations of further growth, Kendall stated he has seen a “very sizeable drawdown” in Chinese copper inventories this year. He goes on to say, “some point in time, they will get to a point at which they have run down inventory levels to an uncomfortably low level and then there is no alternative to coming back to the international market.”

Portfolio Manager Evan Smith agrees that copper’s pricing looks promising. China is nearing the end of its tightening policies and has shown that its debt is under control based on released results of the country’s comprehensive debt audit. For the Global Resources Fund (PSPFX, he has been incorporating these macro thoughts into the team’s models to identify stocks with superior growth and value metrics that he believes could benefit the most.

Wednesday, July 20, 2011

Saturday, July 16, 2011

Bullish Copper Technicals

By: Zeal_LLC

Copper is growing increasingly popular among speculators, who are catapulting this unassuming base metal up into the rarified ranks of market-darling commodities. Neither precious like gold, nor immediately consumed like oil, copper’s price action is quite unique. And despite some risky headwinds remaining, its technicals are once again turning bullish today.

I last wrote about copper in mid-February, as it hit new all-time highs of $4.60 per pound. My essay then concluded, “The bottom line is copper is due for a major correction. Sentiment in this metal is wildly bullish thanks to its recent massive upleg and new all-time highs. Copper is very overbought technically, it has rallied too far too fast by its own bull-to-date standards. And it has ignored a major trend change in its LME stockpiles in order to follow the stock markets higher.”

This contrarian prediction came to pass. In the 5 months or so since, copper has not only failed to regain those lofty heights but has indeed corrected. Over several months ending in mid-May this base metal gradually ground 15.9% lower. It surrendered nearly 1/6th of its value in the global marketplace! Copper needed to correct for the reasons I articulated in mid-February, and the selling arrived as expected.

But ever since those mid-May lows, copper has been consolidating and gradually clawing its way higher. This was pretty darned impressive considering some of the stock-market action over the 2 months since. Copper is usually highly correlated with the stock markets, heavily influenced by general sentiment. Yet in the first couple weeks of June when the flagship S&P 500 stock index plunged 5.9%, copper only lost 0.8%. It was truly a remarkable display of relative strength for this economically-sensitive metal.

This resilience probably means one of two things. Copper’s correction could have been big enough and long enough to fulfill its mission of rebalancing sentiment. If its magnitude was sufficient to eradicate the greed of mid-February and usher in fear, then most of the bearish traders were probably squeezed out. This means there weren’t many sellers left in early June, which is a bullish sign for copper prices.

Alternatively, copper simply might not have followed the stock markets’ fast swoon lower then because it didn’t generate much meaningful fear. Copper gets crushed in fear-laden stock selloffs because they lead futures traders to assume global economic growth is in jeopardy, which would retard copper demand growth. If this thesis is correct, and the stock markets start falling again, copper could still get hit hard.

But exogenous sentiment influences aside, copper’s intrinsic technicals are certainly looking bullish. So traders ought to give it the benefit of the doubt today, while remaining vigilant for a stock-market selloff that could bleed into this popular base metal. This first chart examines some of the bullish copper technicals today. This metal’s price itself is rendered in blue and slaved to the right axis.


Copper has certainly enjoyed a spectacular run since 2008’s once-in-a-century stock panic. Between its panic low in December 2008 and its latest high in February 2011, this metal soared an astounding 261.0% higher. That might seem excessive, but realize it is mostly just a recovery after that hellstorm of fear spawned by the panic ripped copper to shreds. Between July 2008 and December 2008, it plummeted an apocalyptic 68.7%! Over 2/3rds of its value vaporized in just 6 months!

We capitalized on those ridiculously irrational and oversold copper prices by aggressively buying copper stocks. An elite-copper-stock long-term investment we recommended to our subscribers in the heart of the stock panic was up 277.8% as of this week! Those panic lows were just absurdly silly. That crazy panic anomaly aside, between its July 2008 and February 2011 highs copper only rallied 13.0%. Far from excessive, this is downright trivial.

So it’s not righteous to look at copper’s post-panic surge in isolation and claim this metal must be in a bubble. In broader secular context stretching back several years before 2008’s panic, copper’s bull has actually been very modest. While the blistering pace of copper’s post-panic recovery won’t be sustainable indefinitely, copper should still continue gradually marching higher on balance. At least as long as its secular fundamentals remain bullish, with its global demand growth outpacing supply growth.

As for its current bullish technicals, note that copper’s recent grinding 15.9% correction over 2.9 months dragged it back down to a couple critical support lines. The first, and most important by far, is copper’s 200-day moving average. In ongoing bull markets, 200dmas are generally the highest-probability bounce points for healthy corrections to bottom.

And after copper first hit this key metric in early May, it spent the better part of 8 consecutive weeks bouncing along it. The longer a price lingers and climbs along a major support line after a correction, the more likely a true bottom has indeed been seen. And 8 weeks is an awfully-long time, especially since this span encompassed that big early-June selloff in the stock markets that copper nonchalantly shrugged off.

In addition, since this latest correction bottomed a secondary support line has held for just as long. Note above that the lower support of copper’s well-defined post-panic uptrend has held strong. The last time this particular support line was approached was back in the summer of 2010 after copper’s last major correction. That earlier selloff was driven by a parallel correction in the stock markets, which is one reason why any new stock correction poses big downside risk for copper.

That same uptrend support line that held strong in the summer of 2010 has so far held strong in the summer of 2011. This is a great secondary confirmation of a probable copper trend change from correction mode to new-upleg mode. But personally, I believe the 200dma holding is far more important. Copper can’t continue surging at its outsized post-panic-recovery pace indefinitely, so at some point this recovery uptrend’s support line will fail even though copper’s secular bull remains intact.

But while copper’s technicals look bullish based on holding strong at multiple support lines for a couple months, all isn’t rainbows and unicorns. Relative to its 200dma, copper never hit very-oversold levels in its recent major correction. This significantly increases the odds that the correction might not be over yet, that we may have to see another low before the next upleg begins. This is based on my successful and profitable Relativity trading system.

Interestingly if you take any price in a secular trend and divide it by its own 200dma, the resulting multiple forms a horizontal trading range. This multiple for copper is rendered above in light red, slaved to the left axis. If you flattened the black 200dma line to horizontal, and recast the blue copper-price line as a perfectly-comparable-percentage multiple of it, the result is the Relative Copper (rCopper) line.

Over time, this rCopper construct forms definite support and resistance zones. We define these based on where rCopper has meandered over the latest 5 calendar years. Our subscribers can log in to our website and look at the large high-resolution long-range chart (updated weekly) we used to define copper’s relative trading range. Today it runs from 0.90x on the low side to 1.20x on the high side. In other words, copper tends to trade between 90% to 120% of its own 200-day moving average.

Unfortunately when copper bottomed in mid-May, it was only at 0.971x relative. It wasn’t super-oversold yet, fear simply wasn’t extreme enough, as defined by copper’s bull-to-date precedent. Contrast this with rCopper’s deep 0.883x relative low back in June 2010 after its last major correction. While copper’s recent support-hugging behavior for a couple months after its mid-May low suggests a durable bottom, the lack of a deeply-oversold rCopper reading at that time certainly undermines this.

It’s not that copper remained overbought in mid-May, far from it. But it just wasn’t as low yet as major corrections have tended to drag it over the past 5 years or so. This means that despite copper’s bullish technicals, it likely remains very susceptible to fear splash damage driven by any renewed stock-market selloff. So if the S&P 500 starts falling fast enough to spark real fear, odds are copper will be sold in sympathy. And it will probably hit a new low in this scenario, extending its recent correction.

Because of this ambiguity, I thought about not even writing this essay. But this is simply the way the markets usually work. While there are those rare times when all the indicators line up perfectly to herald a high-probability-for-success buying opportunity or selling warning, most of the time everything isn’t in agreement. The more indicators that agree the better the odds, but they still never approach certainty.

This next chart shows a key fundamental copper-price driver that helps offset the lack of an ideal rCopper low. It is the levels of the London Metal Exchange’s copper stockpiles. The LME runs a global network of warehouses that act as a buffer between copper miners and consumers. While most copper mined is shipped directly from producers to consumers under contract, occasionally a miner will have excess production beyond contract or a factory will need more copper than usual.

So the LME warehouses around the world provide places where this excess physical copper on the margins of global supply and demand can be traded between producers and consumers. Each day the LME publishes these total copper stockpiles, which are eagerly watched by speculators. Rising stockpiles mean copper’s global supply-demand imbalance isn’t as tight, so prices are likely to fall. And declining stockpiles reveal tightening supplies, which usually leads traders to bid up copper.


Because of the wild dislocations spawned by 2008’s stock panic, the relationship between copper prices and LME stockpiles isn’t as clear since then. But if you look at a longer-term chart, it is readily apparent that prices and stockpiles naturally have a strong inverse relationship. The farther the stock panic recedes into the rearview mirror and the more conditions return to normal, the more this logical relationship will reassert itself. With copper now recovered into its pre-panic secular uptrend, stockpiles are important again.

Given the big numbers of and diversity in both the global copper miners and the factories that fabricate finished goods using this copper, it isn’t surprising that changes in aggregate supply and demand move slowly. It takes many months to ramp up mine production or factory production, output changes can’t happen overnight. Thus the LME stockpiles tend to slowly meander in low-volatility trends. Note how straight the red stockpile lines are compared to the blue copper price.

And whenever major trend changes happen, from copper tightness to relative abundance or vice versa, they tend to be gradual and decisive. There aren’t many instances in this bull where LME stockpiles started moving the opposite direction for a month or two where it was merely a head fake. Once supply started outpacing demand or vice versa, the resulting trend changes tended to be durable and sustained.

Note above that back in mid-June soon after copper’s latest bottoming, global LME copper stockpiles peaked near 478k metric tons. In the month or so since, they have been relentlessly drawn down by a material 3.4%. While it is possible this trend change will soon reverse and copper stockpiles will begin rising again, it isn’t probable in light of LME stockpiles’ bull-to-date precedent. And if extra copper continues to be bought out of the LME’s warehouses, traders are likely to bid copper prices higher.

The last couple major draws in LME copper stockpiles are crystal-clear in this chart, a huge 53.2% draw ending in mid-2009 and a longer 37.2% one ending in late 2010. Since stockpiles didn’t get up to their post-panic trading range’s resistance of 550k tonnes in their recent peak, I certainly don’t expect a drawdown of this magnitude. But it would still be perfectly normal for stockpiles to trend down towards their 350k support line. This is another 112k tonnes of copper likely to be drawn over a couple quarters!

If this LME stockpile trend change is durable and sustained, and it gradually heads back down towards its post-panic support, it is hard to imagine speculative capital not flowing back into copper. While copper is still at risk of getting sucked into the fearful sentiment in a material stock-market selloff, falling LME stockpiles will almost certainly dampen its impact on this metal. Bullish fundamentals always generate a tailwind.

So not only are copper’s intrinsic technicals looking pretty bullish, its supply-demand fundamentals are providing confirmation. Though a stock-market selloff could temporarily drag copper to new correction lows, this setup is bullish enough to start a gradual deployment into the beaten-down copper stocks. We just started buying and recommending copper stocks again in our subscription newsletters, with more to come soon if copper’s technicals and fundamentals remain favorable.

At Zeal we’ve been researching and actively trading these secular commodities bulls for over a decade, yielding priceless wisdom, knowledge, and instincts that newer commodities-stock traders can’t match. We’ve generated an awesome real-world track record. Since 2001, all 591 stock trades recommended in our newsletters have averaged annualized realized gains of +51%! Has your capital been growing this fast for a decade? Why not?

We share the profitable fruits of our hard work with our subscribers, who finance our ongoing research efforts. We publish acclaimed weekly and monthly subscription newsletters that help speculators and investors learn to thrive. In them I weave together all our research and experience to show what the markets are doing, why, and where they are likely heading. And when probabilities are favorable, we recommend specific stock trades you can mirror. Subscribe today and start thriving!

The bottom line is copper’s technicals are looking pretty bullish today. Even though copper’s latest correction didn’t leave it quite as oversold as it was after past major corrections, its price action has been excellent since. Major support lines have held strong, even during a sharp stock-market selloff. On top of this, global copper stockpiles appear to have just turned the corner into a new bullish drawdown mode.

Given the stock markets’ strong influence on copper traders’ sentiment, there is still a decent chance that any new stock-market selloff sharp enough to generate fear would drag copper back down. It may even fall far enough to hit new correction lows. Nevertheless, since it has just corrected and its fundamentals are now bullish again, any stock-driven selloff is likely to be short-lived and a fantastic buying op.

See the original article >>
Saturday, July 2, 2011

Investors Still Bullish on Gold and Copper

By Commodities Now

According to a June 2011 survey by ETF Securities, 90% of European investors have increased their holdings in precious metals over the past five years - this has mostly been driven by concerns on sovereign debt and inflation.

Two-thirds of investors expect the price of gold to increase over the next 12 months and over half expect the price of copper to increase over the same period. These are the results of ETF Securities' (ETFS) pan-European client survey* , focusing on metals.

Key findings of the ETFS client survey include:

  • The majority of investors expect to increase their allocation to both precious and industrial metals over the next five years, with copper and gold being the most popular choices.
  • In continental Europe, investors cite inflation hedging and portfolio diversification as the key benefits of investing in industrial metals. However, in the UK, most investors (60% of respondents) cite the strong links to the macroeconomic cycle as the main reason for maintaining exposure to industrial metals.
  • Inflation hedging and portfolio diversification are seen as the key benefits of precious metals investing, according to the survey's respondents.
  • Investors are still undecided on the outlook for silver, with 44% of respondents expecting the price to increase over the next 12 months.
  • Almost half of the respondents prefer to invest in precious metals through physically-backed ETPs versus other methods of investment, including buying the metals directly.
  • Gold, oil and agriculture are the current top commodity picks for investors.
Commenting, Scott Thompson, Co-Head of European Sales at ETF Securities, said: "Whether for inflation-hedging or portfolio-diversification purposes, enthusiasm for precious metals investment shows little sign of abating among survey respondents. Demand for gold remains particularly strong. Yet respondents are also keen to increase their exposures to industrial metals for similar reasons.

Many respondents also perceive the correlation between industrial metals and the macroeconomic cycle to be significant. Interestingly, more than half of respondents (56%) expect to increase their allocations to industrial metals over the next five years. Industrial metals currently account for just 5% of assets in commodity ETPs globally; today's survey results suggest this figure could be set to rise."

(The survey was taken at an annual pan-European conference held by ETF Securities during the week of 14th June 2011 where delegates were asked to take part in a survey. In total, 54 responded. Responses across Europe were consistent; little bias was evident between countries.)

Tuesday, June 28, 2011

Descending triangle in the Copper producer?

by Kimble Charting Solutions


Important Battle at Four Dollar Copper

By DoctoRx, on June 28th, 2011

This multi-year chart of copper prices on the futures market is from Finviz.com.

Headlines are most often about stocks and oil. Special sites focus on precious metals, but they tend to be more fringe-y.. Almost never in the popular press does copper get a mention. But copper prices may well tell the tale of the coming trend of the current biflation. Will it tilt back toward more price inflation or away from it?

With oil having reached my first downside target of $90, I now have no clue short-term.

Unlike oil, copper did not go wild in 2008, and as you see, it surged and then crashed in 2006 before the mega-crash in 2008. Thus unlike oil, it is now within its 2006 price range. Short-term there is a bit of a bearish downtrend, but on a multi-year basis, I can’t discern any trend at this juncture.

Long called “Dr. Copper” for its alleged ability to “diagnose” (reflect) the strength of the US/global economy, this metal is not politicized as is oil. (NATO is not assisting in getting rid of Mr. Qadaffi because he controls 2% of the world’s copper market.) Thus it more fairly than oil represents supply and demand in diverse parts of the world’s economy.

As you see, copper found intense upside resistance for several years at $4/lb.

It then broke through to all-time highs in the inflationary sequelae to the 2008-9 bust. If $4 can hold, I think that would be big for the commodities bulls. If it falls back well into the prior trading range, that will embolden the deflationists.

It’s worth watching this one.

Friday, June 24, 2011

CHINA FLASH PMI UNDERMINES COPPER

By Rohan Clarke

China’s latest flash PMI data was not good (via Markit here) – if the trend continues, next month will see China on the wrong side of the ledger:
You’d think that weakness in the China growth engine would be reflected in commodities prices – but the charts would suggest otherwise. Consider that bellweather of commodity demand – copper:
Apologies for the somewhat crowded chart, but it’s interesting from a few perspectives – starting from the top:

1) The copper price has rolled off its highs but has materially lagged the selloff in Chinese equities. As we have discussed previously (most recently here and background here), the Shanghai Composite has been led down by the resources and financials sectors. Eyeballing the relative price movements suggests that equities tend to lead the copper price – particularly at turning points.

2) The copper price has been diverging from equities since the start of March. With domestic tightening leading to unwinding of copper inventories in China and difficulties in its property development sector, it’d be reasonable to expect copper to follow the equities markets lead rather than the reverse.

3) I’ve included the RSI for copper to illustrate that the price could fall someways before becoming oversold by this measure. Notably, the MACD looks to be crossing over again – suggesting that momentum is turning against coppers price.

Finally, and in some ways following on from yesterday’s post about the impact of the investor class on commodities prices, consider the following chart that maps US equities against the copper price. For mine, the correlation says a lot about US monetary policy, its impact on investors, and the resultant movement in the copper price.

Thursday, June 23, 2011

Dr. Copper and the Chinese Housing Market Bubble

By: Submissions

The mighty Dr. Copper; the only metal has a suffix attached to his name, for his accuracy predating equity prices for years. In the past 30 months or so, copper had a fantastic performance, almost quadrupled its price from December 2008 lows. But recently, this is becoming more of a story about emerging market infrastructure spree than acclaimed shortages.

 An article in daily mail about a Chinese ghost city Kangbashi may give us some idea about the scale of the spree.

From dailymail.co.uk:

One approach road leads past what was until recently a 30,000-seater stadium, costing £100 million and rushed to completion in nine months for last year's Mongolian Games - horse-racing, archery and wrestling. When it was opened, it looked rather like Concorde about to take off. But soon after New Year's Day, a whole white wing, plus the central peak, collapsed during the night. 


As the ancient Chinese saying goes:” one shall invest in art in heyday and own gold in troubled times:” With some Chinese art prices soaring to unprecedented levels, not doubt we are in a boom time. However, anybody who studied some history may ponder the question whether this time is different. Looking at the media flooded with articles about how superior a state-driven fixed asset investment economy is, I couldn’t help but wonder if anyone experiences the same déjà vu as I do. 


Supply wise, for all the Malthusians I’ve got bad news for you. BBC just discovered new source of copper supply! They are in Goldman’s warehouse! Several prominent website has already covered this story in detail:

BBC bubble trouble interview via ftalphavilla.ft.com

MR: In fact it turned out that only about 40% of the copper was on the LME’s official stocks, and therefore visible to the market. 

From Zerohedge.com:

The primary driver of this anti-competitive behavior is the fact that GS, JPM and Glencore now control virtually the entire inventory bottlenecking pathways: "In recent years, major investment banks like Goldman and J.P. Morgan and commodities houses like Glencore have been snapping up warehouses around the world, turning the industry from a disperse grouping of independent operators into another arm of Wall Street. The LME has licensed about 600 warehouses around the world.


Copper guru Simon Hunt explained:

The real story about copper is the size of the financial sector’s involvement in buying surplus copper and warehousing it outside the reporting system both in your country and elsewhere, which probably started in 2006. This is what creates robust demand, which is quite different to consumption. 

I’m also a big believer in seasonality; the chance of a market collapse in autumn is just too high for me to discredit markets seasonal traits. So I examined three major housing bubble in the past 20 years or so, the Japan asset bubble, Asian tiger, and US housing bubble and put them into a seasonal perspective, presidential cycle in this case. These three housing bubbles are each characterized by the same stated-induced cheap credit, reckless speculation, and debt fueled asset inflation. And here is the result:


If the Chinese housing bubble talk is validated, with inflation pressure mounting up and further tightening measures in emerging market, Simon hunt’s prediction of copper price plunging to 7500 level surely could be realized by year end. After that, copper price tend to rally at the beginning of election year, and an even lower copper price in second half of 2012 is not avoided.

See the original article >>

Historic copper prices may be on horizon as inventories drop to critical levels--RBC

by Dorothy Kosich

RBC says China remains the main driver of growth in global copper demand with forecast growth of 8.9% this year, as Western World growth is expected to slow to 2.9%.

RBC Capital Markets forecasts an annual average copper price of $4.25 per pound this year, also predicting that global copper demand growth will slow to 5.2% in 2011, down from 8.2% in 2010.

In the latest issue of Metal Prospects, H. Fraser Phillips, RBC metals analyst, noted, "The copper market remains tighter than the other base metals. Inventories are relatively low, there is little excess mine capacity, and utilization rates remain high, supporting strong pricing."

RBC forecasts a deficit a deficit in copper inventories in 2011 for the second consecutive year, and "for inventories to finish the year below critical levels." However, a predicted surplus in 2012 is expected to push inventories back above critical levels and should result in a price correction.

"In 2013 and beyond, we expect renewed deficits will draw inventories down to minimum levels, driving prices to levels that will restrict demand in order to balance the market," said Phillips.

RBC anticipates that refined copper production will remain constrained by mine supply throughout the forecast period, supporting historically high prices. 

However, by 2015, RBC's analysis suggests production will increase at existing copper operations as previously approved new projects come on line, contributing a total of 6 million tonnes of new copper supply.

"While the number of very large projects is limited, there are a large number of smaller projects," RBC observed. "Our forecast makes provision for new supply from some projects that have yet to be approved. In aggregate, these projects could contribute 2.6 million tonnes in new supply by 2015."

Despite their optimism on future production, RBC's base case supply demand/balance assumes that only 25% or 642,000 tonnes should actually come on line by 2015. "Mine capacity remains the bottleneck."

Nonetheless, Phillips stressed that copper remains "our preferred base metal. We forecast an average price of $4.25/lb in 2011, $3.75/lb in 2012, $4.00/lb in 2013, $4.25/lb in 2014 and $4.59/lb in 2015. Our long-term price forecast is $2.25/lb in 2011 US$."

See the original article >>

Friday, May 27, 2011

Copper, iron ore and coal to lead commodities

by Commodity Online

Copper, iron ore and coal is expected to create a bullish undertone for commodities thanks to insatiable appetite for commodities from developing nations such as India and China.

The rising demand and the supply demand mismatch turn copper into a top contender for leading the commodities pack up in the coming years. The red metal already faces a market deficit and it is expected to widen further when economies emerge out of their protective cocoons as recovery gathers momentum.

Iron ore also has claimed a position among the favourites following the rising demand for steel and the new pricing structure the market has now adopted. The benefit to the energy sector is obvious enough to be over looked, and coal is a major source of it. Countries like China, which relies on coal for more than 70 percent of its energy needs, are sure to bolster prices of coal in the coming days.

Standard Chartered Plc predicts gold, copper, coal and iron ore to be in the forefront of the commodities price rally in the few years to come.

Goldman Sachs also sees raw materials price to climb in the coming days, along with Deutsche Bank and Barclay’s capital, all of which advocate the strength in commodities to stick.

However, rising commodities prices punt up global food prices adding to the inflationary situation, which lead countries such as China, Brazil and India etc to hike interest rates.

The Standard & Poor’s GSCI 24 commodities index beat stocks, bonds and currencies in the last five months, which is the longest winning streak in last 14 years, reports showed. But the index has been on the downside of the late due to the subsequent fall back of commodities market.

The development expectations from India and China are sure to dominate the future path for commodities. India is expected raise the demand for metals by 80 percent in the coming years to complement her investments in infrastructure. Coal demand, on the other hand, is seen at 2 billion tonnes in the coming years, reports showed.

Nevertheless, more immediate concerns dog the commodities markets currently. Slowing growth in the US, debt troubles in the European Union and rising inflation and the apparent real estate bubble in China, all of which present the market with enough and more hurdles.

Wednesday, May 25, 2011

The Metal Family Tree


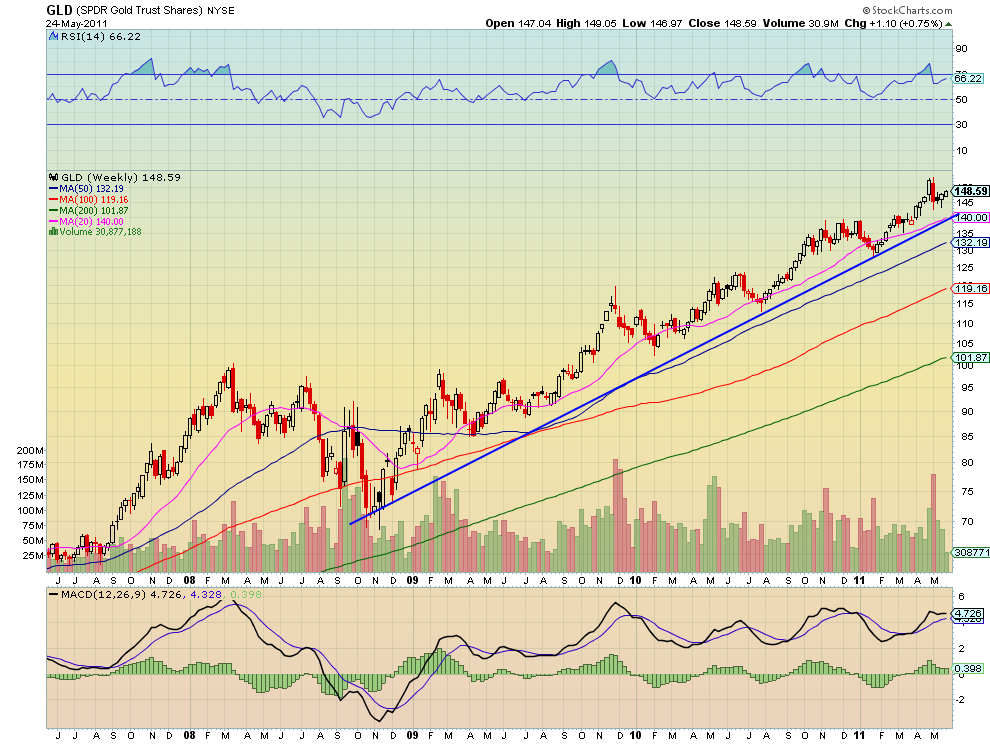
Metals ETF’s have been moving as if they have no connection to each other. But they are a family. With each family member taking on a different role. The dominant first born. The middle child unafraid of authority pushing the boundaries. And old Uncle Jessie who has his ups and downs. Gold (ticker: $GLD) is like that first born child. Look at the weekly chart below.

GLD
gld e1306277043665 stocks
In a steady up trend since making a low in November 2008 GLD just keeps plugging higher. Occasionally it visits the trend line around the 20 week Simple Moving Average (SMA) but there is no confusion about where this confident metal is heading. look for the pullbacks to the trend and 20 week SMA to buy or add to your position.

SLV
slv3 e1306277261357 stocks
The Silver ETF (ticker: $SLV) is like the middle child. It heads forward in fits and starts and then occasionally runs away to test the boundaries, like when it culminated in a parabolic top 4 weeks ago. After being punished for that move it is trying to get back on track now with a bullish candle on the weekly chart through the first 2 days of this week, also off of support of the 20 week SMA. If it can get above 36.20 then it could be off to the races again.

JJC
jjc1 e1306278077828 stocks
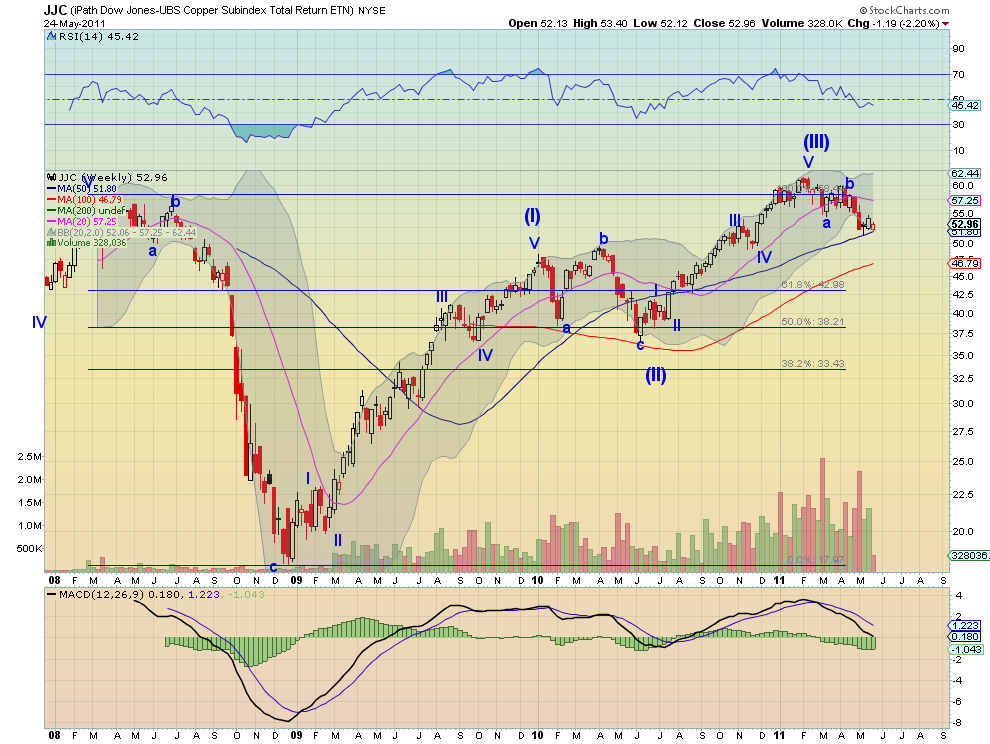
Old Uncle Jessie has put in a hard life working and has his good and bad times. The Copper ETF (ticker: $JJC) is the working man metal like Uncle Jessie. The weekly chart above shows the Elliott Wave count now in corrective Wave (IV) before moving higher. Elliott guidelines suggest that this pullback will end before it hits 50, and then start Wave (V) higher. The quick support of the 20 week SMA does not hold the same magic for JJC. The current bear flag on the 50 week SMA suggests a continuation lower to the 100 week SMA at 46.79 is likely. So how does Uncle Jessie feel? Looks like he woke up with a spring in his step today.

Wednesday, May 11, 2011

Four Guys Walk up to a Copper Mine Field…


Copper is important because it is considered by many to be a market tell. I explored whether this is true or not two months ago in the story linked below. But whether you believe in the correlation long term or not is irrelevant if the collective market does. So what does Copper have to say for itself? Let’s look at it from four different perspectives.

Point and Figure

copper PnF stocks
The simplest interpretation is the Point and Figure chart. Above is a standard 3 Box Reversal chart with 4 point box size for Copper. If you are not familiar with Point and Figure charts they look at price movement solely, without regard to time or volume or anything else. This chart shows Copper in a downtrend since it broke the Triple Bottom by printing the ‘O’ in the 404.0 box. The price objective for the breakdown is 384.0.

Andrew’s Pitchfork

copper pitchfork e1304978738844 stocks
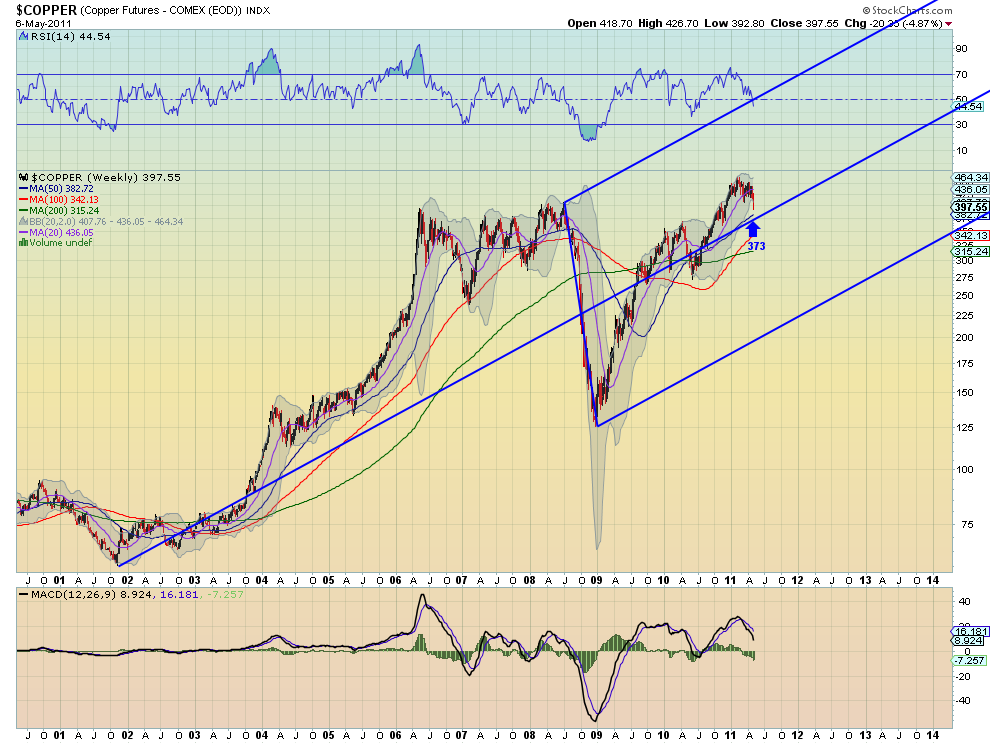
Also a clean chart technique the Andrew’s Pitchfork has been working well in the metals complex lately. The basic premise is that the tines of the Pitchfork or Median Lines, attract the price. This chart shows that Copper rose from the Lower Median Line at the beginning of 2009 to the Median Line and has been contained in the gravity of that line since. It is now being pulled back to the Median Line which is currently at 373. You can see that it can overshoot the Median Line like it did in mid 2010 so 373 is not a price objective.

Elliott Wave Principles

copper e1304979663488 stocks
Contrary to what the media would have you believe Elliot Wave is used by people besides Robert Prechter and does not always give a doomsday scenario. Elliott Wave Principles applied to the Copper chart show that it is in the corrective Wave (IV) of the Primary Motive Wave higher. It is not clear if it is in the intermediate wave c (as the chart shows) or still in wave a. Either one points to more downside. Wave (II) and Wave (IV) often have different characteristics so since Wave (II) was an expanding wave then Wave (IV) can be expected to be more sideways as it has been. Not a rule but an observation. This would mean that the correction does not have much more to go lower.

Fibonacci

copper fibs e1304980754220 stocks
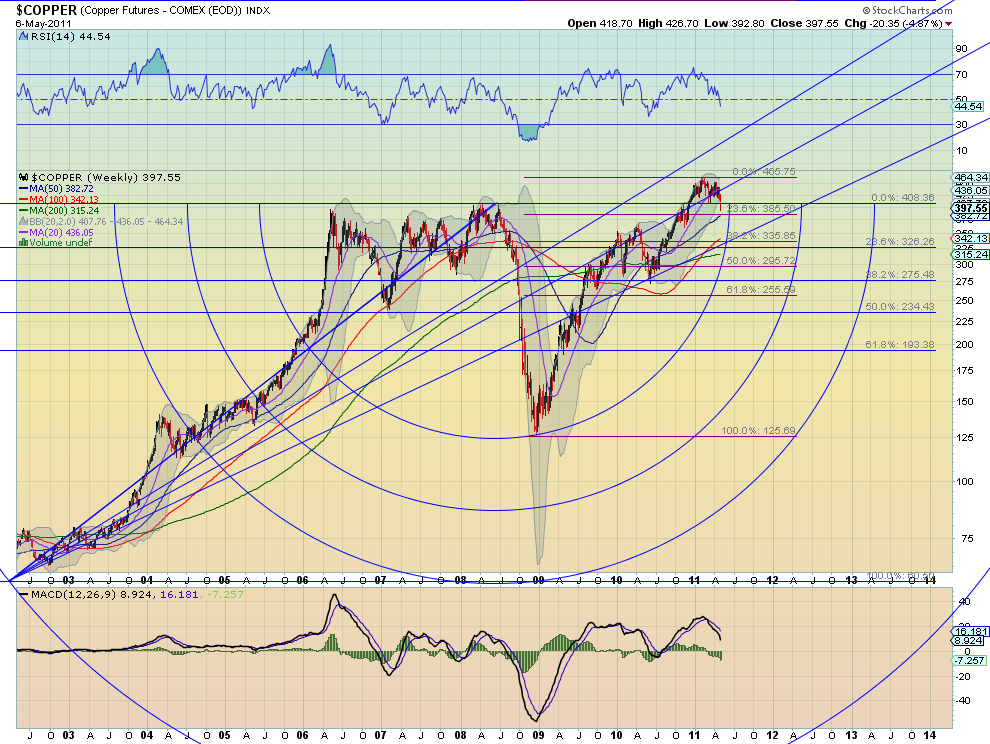
This one is a bit more crowded with two sets of Fibonacci retracement levels (Levels), Fibonacci Arcs (Arcs) and Fibonacci Lines (Lines). The blue Levels and the Arcs and Lines are generated from the low at 60.50 in 2001 and trace to the top at 408.36 in mid 2008. the purple Levels are from teh correction low to the recent high. You can see the Lines roughly bounding the move higher from mid 2009 until the throw over when Copper broke to new highs late last year. Also that the Arc was support at the low at the end of 2008 into 2009. As the price bounces back below the 100% Level on the blue lines it is moving through time toward the Arc again. This view shows the purple 23.6% Level coming into play as potential support at 385.50 and then a drop to 335.85 below that.

So four different perspectives, but each one sees Copper heading lower with targets of 384, 373 and 385.50 at least. One final note that each time chart also had the Relative Strength Index (RSI), Moving Average Convergence Divergence (MACD) indicator and Bollinger Bands on it. The RSI and MACD both also suggest more downside and the Bollinger bands which had been squeezing are now expanding to allow for a run. These indicators suggest that maybe the price objectives above are not the end of the fall. What do your charts say?

Tuesday, May 3, 2011

Stock Market Outlook for May 2011


There is positive pressure for stocks into and around the new moon of May 3rd, then negative pressure after that into and around the full moon of May 17th:

Seasonality fits with that, suggesting a positive bias to the first three trading days of this week:


Source: Market Sci


Source: Sentimentrader / Cobra's Market View

So, expecting gains over the first 3 days of this week I would like to see the below measure reach over the upper grey line into overbought status as a result of that advance:


Source: IndexIndicators.com

Such action should also lift indices into overbought RSI readings, at which point I would expect to be able to present sufficient collective evidence for a pause or pullback in stocks, given that Investors Intelligence sentiment is calling for a pullback imminently:


Source: Traders Narrative / Investors Intelligence

And copper is diverging negatively - copper tends to be a leading indicator:


Source: Mcoscillator.com

Plus, the dollar index should complete its exhaustion selling towards 72-71 over the next few sessions:


Source: Cobra's Market View

In summary, I believe all the above means I may be in a position later this week where I am looking to take some stock indices profits off the table.

I previously forecast that stocks would make a new nominal high at the end of April into the beginning of May, followed by a correction over mid-2011:


One of the composite reasons for that is May to September is the seasonally weak period for stocks, reflected here:


Source: Seasonalcharts.com

And there is a potential Puetz crash window in mid-June. Note that not all Puetz crash windows have worked, but occurences are sufficient to make it worthy of attention:


So are we going to finally see an extended retreat or consolidation for stocks over the mid part of 2011? If so, the first few days of this week could mark an end to a period of bumper gains since mid-2010. Well, should things come to pass this week as outlined above then I will take partial profits on stock index positions in a few days time and leave a core long position, because the growthflation scenario that I previously analysed as currently in play means we could potentially also see this:


Namely, a crawl along the top side of the bullish channel over the next few months, in a continued rhyme with the last cyclical bull. It would be a consolidation of sorts, but one to be long on, not short.

Follow Us