Showing posts with label eMini Nasdaq. Show all posts

Saturday, September 24, 2011

The Week Ahead: Is the Majority Wrong?


Bearish sentiment and economic troubles continue to take their toll on the markets, but certain sectors look good and a buying opportunity may be right around the corner, writes MoneyShow.com senior editor Tom Aspray.

Even though global stock markets were able to stabilize on Friday, the sharp declines last week added to the overwhelming negative sentiment in the markets.

The technical formations prior to last week suggested that stocks were vulnerable to decline, and the short-term outlook turned more negative Tuesday.

Of course, the magnitude of the decline was a surprise to all, and Thursday’s sell-off was similar to the panic selling that occurred in early August. This gave the investment firms and major banks some vindication, as they have been racing each other for weeks to cut their forecasts for the economy and lower their year-end targets for the S&P 500.

Even the Federal Reserve joined in, as their new plan to lower long-term rates was accompanied by the comment that there are “significant downside risks to the economic outlook, including strains in global financial markets,” something that undoubtedly spooked an already skittish market.

Though I think the Fed’s concern is valid, the general consensus of economists makes me more skeptical. Many believe that if we are not already in another recession, we will be soon. If this turns out to be the case, it would be the first recession that was predicted by most as it was occurring.

These predictions comprise the majority of market sentiment, even though last week’s housing data was better than expected; existing home sales jumped 7.7% in August. Nevertheless, a survey of 100 economists painted a bleak picture of housing, as they expected prices to drop 2.5% this year, and then only rise 1.1% through 2015.

In my experience in the market, the majority is rarely right. When you have a consensus view—especially one that persists for some time—I always look at the technical evidence to see whether it supports this consensus.

For example, my volume analysis on gold turned positive in 2006, but sentiment toward gold was often mixed. In the fall of 2009, however, public sentiment on gold was overwhelmingly positive, right before gold topped out on December 1.

This began a months-long decline. The correction was severe enough to turn enough of the bulls negative on gold, which created another good buying opportunity.

Therefore, while the short-term outlook for the global equity markets is decidedly negative (as I detail later), I think by year’s end the stock market may surprise many of the current bears.
chart
Click to Enlarge

Of course, the problems with the US economy and our leadership are just magnified overseas. Many are suggesting that the Eurozone will eventually break up, as their leaders fail to comprehend the severity of their debt problems.

The focus remains primarily on Greece, but the contagion fear is still hurting the markets. The economic news last week was also grim, as the Eurozone purchasing managers’ index dropped in September for the first time in two years. Rating agencies downgraded many Italian and Greek banks, which did not help. (I would love to see someone start rating the rating agencies.)

Late last week, the G-20 announced that it would take “all necessary action” to shore up the banks and financial markets. I think they will eventually figure out the necessary actions and move accordingly.

Unlike the US stock market, the German Dax Composite has continued to decline after the sharp drop in late July. The Dax was sharply lower early last Friday, but closed higher, and could have formed a very-short-term bottom.

Things weren’t that much better in Asia, as selling was heavy. News that China’s factory activity declined in September reversed some of the positive sentiment that had been building for their economy.

The Hong Kong Hang Seng Index had a rough week, down 7.9%, and as the chart shows, the long term 50% Fibonacci support was broken. The 61.8% support stands at 16,544, which is 7.5% below Friday’s close.

The market is likely to get a good test from the economic data this week. On Tuesday, we get new-home sales figures, the S&P Case-Shiller Housing Price Index, and the latest readings on consumer confidence.

Wednesday will bring the latest numbers on durable-goods orders, followed Thursday by the final reading on second-quarter GDP, jobless claims, and pending home sales.

On Friday, we get the numbers on personal income and consumer sentiment, which is likely to be watched closely by Wall Street.

WHAT TO WATCH

The sharp drop last week pushed many of the market indicators to levels where a sharp rebound is likely. The odds would have been even greater if stocks had been sharply lower again on Friday.

Some charts show potential double bottom formations, and while the volume action does support this view, the evidence is not strong enough to act. Given the overhanging political and economic problems, a new trading range is more likely.

I still think the current decline will be an opportunity to establish long stock positions in some of the sectors that I like, but we need to see a decrease in downside momentum first. Technology and cash-rich, high-dividend stocks are my favorites, followed by the retail sector, as I do not think Christmas shoppers will stay away.
chart
Click to Enlarge

S&P 500

The Spyder Trust (SPY) is holding above the August lows as it is testing the daily Starc- bands. Last Thursday’s gap lower opening took out the prior lows at $114.05.
 
If the August lows are broken, then the 127.2% Fibonacci target from the flag formation is at $106.50, while the width of the flag gives downside targets in the $104 to $105 area.

First resistance stands at the gap in the $114.21 to $116.27 area, with stronger levels at $118.50. The daily trend line resistance is at $121.50.
.
The S&P 500 A/D line is so far holding above both the recent lows and those that were made in August (line d). This is an encouraging sign, but a move through the downtrend (line 3) is needed to confirm a bottom.

Dow Industrials

The Spyder Diamonds Trust (DIA) came very close to the 38.2% support of $105.46 last week, as DIA gapped though the lower boundary of the flag formation (line f) on Thursday.

There is resistance now at $107.95 to $110.69, with a key level to follow at $114 to $115.25.

The Dow Industrials A/D is diverging from prices (line h), but needs a move through the resistance (line g) to confirm the divergence. A convincing break of this support will indicate a further decline.
chart
Click to Enlarge

Nasdaq-100

The PowerShares QQQ Trust (QQQ) also gapped lower Thursday, then closed back above the uptrend (line b) on Friday, which is positive.

It would take a close below the September 6 lows at $51.91 to signal a test of the August lows.

The Nasdaq-100 A/D line overcame its downtrend (line c) last week, which suggests the A/D line could be bottoming. The A/D line shows a slight uptrend (line d) which could be broken on a further decline. A move in the A/D line above last week’s high would be positive.

There is resistance now at the gap in the $54.46 to $55.37 area.

In a recent article, I took a close look at not only the PowerShares QQQ Trust (QQQ), but also the Select Sector SPDR Technology (XLK), Semiconductor HOLDRs Trust (SMH), and Apple (AAPL).

Sector Focus

All of the major sectors were hit hard last week, and three—energy, materials, and industrials—look the weakest.

The Select Sector SPDR Utilities (XLU) is holding first support in the $32.70 to $33 area, and a drop back to the $32 to $32.40 area should be a buying opportunity.

The Select Sector SPDR Consumer Staples (XLP) and Select Sector SPDR Health Care (XLH) are also holding well above their highs, but the short-term momentum is still negative.

Oil

November crude plummeted as expected last week. The support at $85 and the $83.20 level both gave way, with crude hitting a low of $77.55 on Friday.

This could be a final washout, but it will take some time for the market to recover from a $13-plus drop.

There is initial resistance at $82, with stronger levels in the $84 to $85 area

Panic Sellers Are Often Sorry


Widespread recent selling in equities and gold looks to be a panic reaction by the masses, as opposed to a calculated response to real market data.

The over 5% decline in the Dow Industrials in the past two days has turned investors’ focus back on the downside, which is different from the positive spin that prevailed just a week ago.

From a technical standpoint, I have been making the case that the rebound from the August lows was a typical flag formation. The Nasdaq Composite has been the strongest since the August lows, but the negative signals from the McClellan Oscillator as of Tuesday’s close indicated even the Nasdaq had likely topped out.

Those who sold at the August 9 lows have had almost two months to watch the market stage a typical 50% rebound. If anyone sold yesterday because stops were hit or as a result of a previously developed plan, that is fine, but Thursday’s drop suggested many were just hitting the sell button in a panic reaction.

The bearish sentiment of individual investors jumped sharply this week, as 48% are now bearish with just 25% bullish. These numbers are as of Wednesday, so they should become more bearish by next week.

Gold was also hit hard Thursday and could be vulnerable to more panic selling before the current correction is over. By looking at the charts, we can get a better idea of what may occur so that you can develop a plan based on data, not emotion.

Chart Analysis: The daily chart of the Spyder Trust (SPY) shows that it gapped below support on Thursday, line b, completing the flag formation. SPY is now just above the August lows at $110.27, which are likely to be tested over the next week.
  • The 127.2% Fibonacci target from the flag formation is at $106.50, while the width of the flag gives downside targets in the $104-$105 area
  • The NYSE Advance/Decline (A/D) line broke support, line d, with Wednesday’s close, setting the stage for Thursday’s plunge. The last rally had taken it just barely above its weighted moving average (WMA)
  • The A/D line needs to move above its downtrend (line c) to turn positive
  • The A/D line shows a band of major support between the March 2011 lows and the November 2010 highs
  • Volume had been declining as the flag developed, but broke its downtrend on Thursday’s drop. It is still well below the levels seen in August, so the volume should be watched closely

The Nasdaq Composite was much stronger than the S&P on the rally, but the PowerShares QQQ Trust (QQQ), which tracks the tech-heavy Nasdaq 100 Index, was even stronger, as it surpassed the 61.8% retracement resistance.
  • Thursday’s drop gapped through support at line b, completing the flag formation
  • The close was at the daily Starc- band with next support at 2330-2385. The 127.2% target from the flag formation (lines a and b) is in the 2250 area
  • As noted Wednesday, the negative divergence in the McClellan Oscillator, line c, indicated the rally was over. It is back to -150 and could fall to the -250 or -300 level before the decline is over
  • A rebound over the next week or so is likely to fail near the zero line
  • Resistance now stands at the gap in the 2500-2550 area
The SPDR Gold Trust (GLD) dropped 2.6% Thursday on volume of 32 million shares and is down another 2% in early-Friday trading. This will take GLD close to the weekly Starc- band at $163. Over the past month, the closeness to the weekly and monthly Starc+ bands had indicated that risk on the long side was high.
  • The break below support at $174.45 last week and the break of the daily uptrend (not shown) this week set the stage for the sharp drop
  • The minor 38.2% support is in the $163.40 area with the more important 50% support at $156.70. This is very close to the weekly uptrend, line e
  • The major 38.2% support from the 2008 lows and the long-term uptrend (line f) are in the $140 area
  • As noted previously, the weekly on-balance volume (OBV) did form a negative divergence at the recent highs (see circle) and is now testing its weighted moving average. A similar divergence in late 2010 led to an eight-week correction
  • The daily OBV (not shown) formed a divergence at the highs and is well below its weighted moving average
  • There is resistance now at $172.20-$177.40
What It Means: If you look at SPY, a test of the August lows would be a 2% drop from Thursday’s close, while a drop to the 127.2% target at $106.50 would be another 5.6% decline. Of course, I expect that the tech sector will hold above its lows.

If you are still holding weak stocks, decide over the weekend how much more pain you can take and then stick to that plan.

Stops under the August lows for stocks or ETFs are risky, as marginal lows could stop you out before prices reverse. I do expect that prices will be 8%-10% higher in the next two weeks. Further weakness should be an opportunity to buy those cash-heavy, high-dividend stocks that others are dumping.

As for gold, a few weeks ago, it looked like gold could fall instead of rally if stocks dropped, and I recommended hedging long gold positions at that time.

The SPDR Gold Trust (GLD) is likely to reach the first downside target in the $163-$165 area over the next week. A drop to the $153-$155 area is possible before the correction is over, but the long-term volume analysis is still positive, so core holdings should be held.

How to Profit: For those who hedged their long gold positions, I would suggest covering half if GLD drops below $165, as there may be an opportunity to put the hedge back on at higher levels.

On Wednesday, I recommended that traders buy the ProShares Short S&P 500 ETF (SH) at $43.36 or better. Unfortunately, the low was at $43.41, just missing the buy level. The fund closed Thursday at $46.28…ouch! Cancel that order at this time.

Monday, September 19, 2011

The "Real" Mega-Bears

By Doug Short

It's time again for the weekend update of our "Real" Mega-Bears, an inflation-adjusted overlay of three secular bear markets. It aligns the current S&P 500 from the top of the Tech Bubble in March 2000, the Dow in of 1929, and the Nikkei 225 from its 1989 bubble high.

The chart below is consistent with my preference for real (inflation-adjusted) analysis of long-term market behavior. The nominal all-time high in the index occurred in October 2007, but when we adjust for inflation, the "real" all-time high for the S&P 500 occurred in March 2000. 


Here is the nominal version to help clarify the impact of inflation and deflation, which varied significantly across these three markets. 


See also my alternate version, which charts the comparison from the 2007 nominal all-time high in the S&P 500. This series also includes the Nasdaq from the 2000 Tech Bubble peak. 


Sunday, September 18, 2011

The Week Ahead: Can Doom and Gloom Save the Market?


As often happens, strong bearish sentiment helped boost the market all week, but it’s best to wait to buy until a pullback occurs, which could come as early as mid-week, writes MoneyShow.com senior editor Tom Aspray.

The stock market got very close to the key levels in the major stock ETFs Monday, and then spent the rest of the week rebounding. This was in spite of very little in the way of positive news, either on the US economy or the Euro debt crisis.

As this sampling of financial headlines reflects, there was little to cheer about:
  • Europe Lending Woes Deepen
  • Economy Clips Factories
  • Greek yields off the scale as 3-year bond hits 172%
  • Number of Americans in poverty at highest in 50 years
Some of the Euro pain was lessened last Thursday, after the world’s central bankers moved to offer unlimited dollar funding through the end of the year. This helped the hard-hit European banks, especially those in France, to rebound.

The news on our economy was not a big help. Retail sales were flat and Best Buy (BBY) reported 30% drop in income for the second quarter. Retail sales were hurt by the several days lost because of Hurricane Irene.

A recent survey of economists by The Wall Street Journal sees a 1 in 3 chance the US will slip into a recession. They also put even odds that the euro would breakup.

The Conference Board was even more negative on the economy, as they see a 45% chance that there will be a recession.
chart
Click to Enlarge

The Michigan Consumer Sentiment Index, released last Friday, shows a slight pickup from August’s dismal numbers. This chart from the Business Insider shows that consumer sentiment is already at levels seen in past recessions.

By the time this index drops below 60, GDP has already turned negative. While almost all economists are still downgrading their GDP forecasts to the 2% to 2.5% range, few are negative.

In light of all this, most were surprised that the Spyder Trust (SPY) was up 4.8% for the week, while the tech heavy PowerShares QQQ Trust (QQQ) led the way with a 6.4% gain.

Clearly, sentiment has shifted—the Investors Intelligence survey of newsletter writers shows that only 35.5% are bullish, compared with over 57% in early April. Also, 40.9% who are bearish, which is not far from the 47.2% level that was recorded near the March 2009 lows.

Another reading of sentiment comes from the option activity. Option expert Larry McMillan reports that put/call ratios have turned positive, as too many are buying puts in expectations of another sharp market decline.

Therefore, stock investors will be helped by an increased feeling of pessimism about the stock market and the economy. As I discuss further below, there has been some technical improvement.

The IMF meeting may set the tone for Monday’s opening. Tuesday, we get the housing starts as well as the start of the FOMC meeting. Wednesday’s existing-home sales numbers are likely to have much less impact than the FOMC announcement in the afternoon.

A clear majority of economists expect the Fed to do something. The prevailing choice is what is being referred to as “Operation Twist,” where the Fed exchanges shorter-dated Treasuries for bonds in an effort to drive down long-term rates.

However, the dramatic rally in the US bond market suggests this already may be priced in.

WHAT TO WATCH

One of last week’s casualties was the euro. Watch it closely this week, because a further break could exacerbate the Eurozone problems. Gold had another sharp setback last week, but finished the week strong and well off the lows.

The stock-market rally last week clearly improved the technical outlook, as many of the major averages came very close to key support on last Monday’s opening. Further strength is needed this week to signal a rally above the prior highs, which would likely stop out a few of the short positions.

After the current rally runs its course, the following pullback will be important. It will give us a better idea of whether a test of the August lows lies ahead.
chart
Click to Enlarge

S&P 500
 
The Spyder Trust (SPY) made it up to $121.97 on Friday, which was just below the prior closing high. Traders likely have stops now above $123.51.

The upper boundary of the flag formation (line a) and the 61.8% Fibonacci retracement resistance is at $126.85. A daily close above this level will suggest that the August lows will hold.

Monday’s low at $114.05 briefly violated the lower support from the flag formation (line b) at $114.38. There is short-term support now at $119, with stronger levels in the $116 to $116.60 area.

The number of advancing issues was strong last week, as the S&P 500 A/D line has moved slightly above its downtrend (line c). It needs to rally higher to suggest that a short-term uptrend is in place.

It is important that key support (line d) holds on any correction.

Dow Industrials
 
The Spyder Diamonds Trust (DIA) dropped below support at $109.18 on Monday, down to a low of $108.15, before reversing to the upside. The next level of resistance to watch is between $115.30 and $117.03, which was the high of the previous rebound.

The 50% retracement resistance stands at $117.78, with the trendline resistance (line 3) at $118.60.
 
First support for DIA is now at $113, with stronger levels in the $109.90 to $112 area.

The Dow Industrials A/D closed for one day below the long-term uptrend (line h) before reversing. It closed Friday just barely above the near-term resistance. A move well above the prior peak will improve the technical outlook.
chart
Click to Enlarge

Nasdaq-100
 
The strength in the PowerShares QQQ Trust (QQQ) got the market’s attention last week, as it gained 6.4%. QQQ was able to close above the 61.8% retracement resistance at $56.07 last Thursday.
In Friday’s article, I took a close look at not only the PowerShares QQQ Trust (QQQ), but also the Select Sector SPDR Technology (XLK), Semiconductor HOLDRs Trust (SMH), and Apple (AAPL). The particularly bullish action in AAPL, a market leader, is a positive for the overall market.

Friday’s high was very close to the start of the next resistance at $56.80 to $57 (line a), with the 78.6% retracement resistance next at $57.71.

There is initial support at $55.20, with stronger support sitting at $54 to $54.50. A close below Monday’s lows of $52.57 would suggest the rally is over.

The Nasdaq-100 A/D line is acting the strongest, as it has convincingly broken its downtrend (line c) and has moved above the prior peak. This is consistent with a bottom formation. This was the only A/D line to hold above the 2011 support.

Russell 2000
 
The iShares Russell 2000 Index Fund (IWM) was up almost as much as the QQQ, but the chart still looks weaker. If we have begun a sustainable new rally, then the small- and mid-caps should eventually start to outperform.

There is next resistance at $72.50 to $73.84, with the major 50% retracement resistance at $74.82. Support now sits at $66.37 to $65.93, which if broken will signal a drop to the major 50% support at $60.54.

The Russell 2000 A/D line continues to look quite weak, as it dropped to new lows before last week’s rebound. It is still well below the previous highs.

Sector Focus
 
All of the major sectors were higher last week, but only technology was able to overcome the previous highs. The Select Sector SPDR Utilities (XLU) was a bit lower Friday, but it still looks like one of the strongest sectors.

For a healthy market, we need more than just these two sectors to push prices higher. It is possible that the Select Sector SPDR Consumer Staples (XLP) and Select Sector SPDR Health Care (XLH) will be able to breakout above the previous highs.

Oil
 
November crude oil held up well last week, and has reached the apex of its triangle formation. Therefore, an upside breakout above the resistance at $90.52 would be suspect.

The daily chart shows an apparent flag formation, which is likely just a pause in the downtrend. There is initial support now at $85, which is almost $3 below Friday’s close. A daily close below the $83.20 level would be more negative.

Tech Buying Opportunity Ahead


Chart patterns indicate that an upcoming pullback in the tech sector will be well supported, providing a good opportunity to go long select sector ETFs and stocks.

While the S&P 500 and Spyder Trust (SPY) have failed to surpass the 50% retracement resistance from the May highs, the Nasdaq 100 is a different story. Technology stocks have been getting lots of press lately, and many hope that this sector will help turn the market around.

Though the Nasdaq 100 is made up of both technology and biotech stocks, it is the technology space that has been getting the most attention. A closer look at the market internals for the Nasdaq 100, as well as the key chart points and the sub-industry tech groups suggests that we should get a pullback in the next week or so that will provide a better risk/reward entry level for those who are not already long.
chart
Click to Enlarge

Chart Analysis: The daily chart of the PowerShares QQQ Trust (QQQ), which tracks the Nasdaq 100 index, shows that it closed above the 61.8% Fibonacci retracement resistance on Thursday. This suggests that decline from the July highs is over.
  • There is next resistance at $56.80-$57 (line a) with the 78.6% retracement resistance at $57.71
  • The McClellan Oscillator broke its uptrend, line c, on September 1. This is often a negative short-term signal, but the oscillator has been able to hold above the most recent lows
  • There is initial support at $55.20 with stronger support at $54-$54.50
  • The daily uptrend, line b, is now at $53.30
The weekly chart of the Select Sector SPDR – Technology (XLK) shows that there is next strong resistance in the $25.30 area, line e. There is major resistance in the $26.80 area, line d.
  • The weekly relative performance, or RS analysis, broke its major downtrend, line f, in late July
  • As I noted in mid-August, the daily RS analysis was positive and was forecasting the recent strength
  • There was heavy weekly volume on the early-August decline and the weekly on-balance volume (OBV) is still below its weighted moving average (WMA)
  • The daily OBV (not shown) is above its weighted moving average and has just moved above trend line resistance
  • There is initial support now in the $23.80-$24.20 area with more important support in the $23-$23.20 area
chart
Click to Enlarge

The Semiconductor HOLDRs Trust (SMH) has rallied 12.7% in the past seven days from the low at $27.28. It is already close to the 38.2% retracement resistance at $31.16.
  • The more important 50% Fibonacci resistance is at $32.30, which also corresponds to strong chart resistance
  • The daily downtrend, line a, and the 61.8% resistance are in the $33.20-$33.50 area
  • The daily RS has broken its downtrend, line b, consistent with the recent strength. Typically, if this is a major bottom, we should see a pullback in the RS over the next week
  • Volume has been strong over the past week but the OBV is still well below its downtrend, line c
  • There is first good support in the $29.30-$29.60 area with stronger resistance in the $28.40 to $28.60 area
One of the tech sector leaders, Apple, Inc (AAPL), completed its bull flag formation (lines d and e) on Wednesday. As I noted in a recent article on flag formations, the potential upside targets were either at $404.50, which was the recent high, or the 127.2% retracement resistance target of $418.90.
  • The OBV has confirmed the upside breakout, as it moved through resistance, line f, one day ahead of prices. The OBV has longer-term support at line g
  • The weekly OBV (not shown) is positive and above its weighted moving average
  • There is first support for AAPL at $380-$382 and the 20-day exponential moving average (EMA). There is stronger support in the $366-$372 area
  • A close below $355 would call the flag formation into question
What It Means: The positive action in the Nasdaq 100 has turned the focus on the technology and biotechnology areas. A rally back to the +160 level in the McClellan Oscillator (now at +103) could mark a short-term top.

The technical action suggests that the next pullback will be well supported. This should provide a good entry point for those who are looking to establish new long positions in the technology sector. Buying in at current levels seems to carry excessive risk and patience would be warranted.

How to Profit: As previously recommended in the August article, buyers should be 50% long the Select Sector SPDR – Technology (XLK) at $23.57 and 50% long at $23.12, as the low was $22.47. Raise the original stop from $21.74 to $22.84, sell half the position at $25.94 or better, and raise the stop on the remaining position to $23.57.

Those who are not already long XLK could buy at $24.12 with a stop at $22.84 (risk of approx. 5.2%).
For the PowerShares QQQ Trust (QQQ), go 50% long at $54.62 and 50% long at $53.62 with a stop at $49.80 (risk of 7.9%).

For the Semiconductor HOLDRs Trust (SMH), go 50% long at $29.46 and 50% long at $28.78 with a stop at $26.93 (risk of approx. 7.5%).

For Apple Inc. (AAPL), go long at $385.80 with a stop at $357.20 (risk of approx. 7.3%). On a move above $396, raise the stop to $369.30.

Sunday, September 11, 2011

The Week Ahead: Fasten Your Seatbelts


A further down move would not be surprising next week, but we’re unlikely to see a repeat of August’s panic selling, and certain stock groups are still attractive buys, writes MoneyShow.com senior editor Tom Aspray.

After a see-saw week, stocks were punished on again Friday. The action was even worse than what we saw before Labor Day weekend.

This time the financial media reported that stocks were lower because of Obama’s job plan, the surprise resignation of Germany’s top representative on the ECB’s executive board, and worries over a default by Greece.

From a technical standpoint, last week’s action just completed the rebound from the August lows. The sharp drop after the Labor Day weekend caused further deterioration in the technical outlook.

The mid-week rebound—in reaction to a sharp rally in the German Dax index—created another good selling opportunity. The German market was boosted when their constitutional court rejected lawsuits filed to block Germany’s participation in the Eurozone rescue funds. Thursday’s lower close set the stage for Friday’s drop.

If the key support levels are violated early this coming week, it is likely to trigger another wave of selling—but I doubt it will have the panic qualities of what occurred in August.
chart
Click to Enlarge

There was little apparent reaction in the equity markets last week to the surprising decision by the Swiss National Bank to stem the Swiss franc’s sharp rise. The safe haven status of the franc has caused a dramatic surge in the currency, not only against the US dollar but also against the euro.

This long-term chart from the Financial Times shows that the Swiss franc has had a dramatic rise against the euro since early in the financial crisis, when it was trading at 1.6 francs/euro. Early attempts to intervene were unsuccessful, and finally they stopped in 2010.

Last month, the franc surged versus the euro and hit parity. After pulling back from these extremes, the franc again started to rally last week, which prompted the Swiss to act. After some slight weakening, the franc started to again turn higher.

The decision to stop the franc from dropping below 1.2 per euro caused a sharp rise in other currencies like the Norwegian krone, as investors looked for another safe haven. While Norway can cut rates to help stem the Krone’s rise, Brazil and Japan have fewer choices.

Brazil just cut rates in the hope that it could escape a global slowdown, while Japan’s rates can’t go much lower. As I discussed last week, Japanese investors have been making a large bet on the Brazilian economy, and negative sentiment on the emerging markets by US investors is making them ones to watch.

Key Levels to Watch


Stocks and crude oil have rebounded nicely from the early Tuesday lows, but the daily charts suggest that Friday’s action may be critical. The key levels to outlined below need to hold to keep the uptrends intact.

Many of the major averages show similar formations, as the rebounds from the August lows have just reached strong areas of retracement resistance.

Though the stock-market averages and the ETFs that track them have not moved above last week’s high, crude oil did make new rally highs on Wednesday. As I discussed last week, crude oil and the Spyder Trust (SPY) often trace out similar chart formations.

Therefore, watching the key support and resistance levels on both, as well as some of the other key market averages, can often give you advance warning of a breakout in the other markets. If any of the key support levels are violated today it is likely to set the tone for next week’s action.
chart
Click to Enlarge

Chart Analysis: The Spyder Trust (SPY) came very close to the 50% retracement resistance at $123.72 last week, as the high on August 31 was $123.51. The more important 61.8% retracement resistance is at $126.90.
  • Tuesday’s drop tested the lower boundary of the flag formation, line b. A break below $114.38 should signal a drop at least to the $112.41 to $110.27 area
  • The 127.2% downside target from the flag formation is $106.65
  • The NYSE McClellan oscillator hit overbought levels at +264 last week, but has now broken its uptrend, line c. It often leads prices, and may be signaling a break of key price support levels
  • The McClellan oscillator closed just above the zero line and it will take strong A/D numbers Friday to turn it higher
  • There is initial resistance for SPY at $121, with the upper boundary of the flag formation (lines a and b) following in the $124.80 area
The Nasdaq Composite retested the early August lows on August 19, which is in contrast to the action in the S&P 500. This suggests better relative performance…and the Composite did show better relative strength last week.
  • The Nasdaq did slightly exceed the 50% retracement resistance at 2,609 last week, and came very close to the declining 40-day MA
  • The more important 61.8% resistance stands at 2,675 and this level needs to be overcome on a closing basis to turn the outlook more positive
  • The McClellan oscillator on the Nasdaq shows a similar but slightly more negative formation than that on the NYSE. The former uptrend, line e, was just tested Wednesday, but it is now back below zero
  • If prices break below the August lows, the McClellan oscillator could form a positive divergence
  • There is short-term support now at 2,480 with more important levels in the 2,400 area
chart
Click to Enlarge

The Dow Jones Transportation average has led prices on the downside since the weekly on-balance-volume (OBV) formed a negative divergence in May.
  • The current chart shows a short-term flag formation, lines b and c. The rebound from the August lows has been weaker, as it just retraced 38.2% of the prior decline
  • The longer-term downtrend, line a, is in the 4,900 to 5,000 area
  • Volume on the rebound has not been impressive, as the daily OBV is still below short-term resistance, line d. The weekly OBV (not shown) is still negative
  • There is short-term support now at 4,380, and a drop below 4,270 (line c) would complete the flag formation
  • This would give downside targets in the 3,950 area
The chart of the November crude oil contract shows that prices are reaching the apex of its flag formation, lines f and g. Wednesday’s high at $90.67 was below the 38.2% retracement resistance at $91.35 and the downtrend, line e, is in the $93.80 area.
  • The OBV showed good strength last week, but has once again turned lower. It is still above its support (line h) and its rising WMA
  • The weekly OBV (not shown) is slightly positive, but needs a positive close for the week (above $86.70) to keep it positive
  • The support from the flag formation (line g) was broken early Tuesday, and therefore Tuesday’s low at $83.47 and the chart support at $83.30 are the key levels to watch
  • A completion of the flag formation has downside targets in the $72 to $73 area
What it Means: As I discussed in detail in this week’s trading lesson, flag formations are generally continuation patterns or pauses in a major trend. This does not bode well for the market over the near term.
Here are some key support levels to watch.
  • Spyder Trust (SPY): $114.38
  • SPDR Diamond Trust (DIA): $109.18
  • PowerShares QQQ Trust (QQQ): $51.91
  • iShares Russell 2000 (IWM): $65.93
  • iShares Dow Jones Transports (IYT): $77.24
  • November Crude Oil: $83.30
A break of these levels will signal a drop back toward the August lows, but it is possible that these lows will hold. The formations do not require that the markets drop significantly below the August lows, but it cannot be ruled out.

How to Profit: Over the past several weeks, I have suggested that investors use a market rally to retracement resistance to lighten up on those stocks that are acting weaker than the market, as well as to hedge their other holdings.

Though I think the Spyder Trust could test the $110 to $112 area, the high option premiums make specific put recommendations more difficult.

Bull call spreads on one of the inverse ETFs would allow one to participate in a decline, but with limited risk and reward.

See the original article >>

Saturday, August 20, 2011

Macro Week in Review/Preview August 20, 2011

by

Last week’s review of the macro market indicators looked like a reversal of the previous week. Gold looked heading lower while Crude Oil had a short term bias higher in a downtrend. The US Dollar Index looks to continue sideways in the 73.50-76 range, while US Treasuries look to continue lower in an uptrend. The Shanghai Composite and Emerging Markets look to be headed higher. Volatility looks biased to the downside with a move under 34 key to continuing lower, and giving a bias to the upside for the Equity Indexes SPY, IWM and QQQ, also within a downtrend. The big question looks to be whether this is a dead cat bounce or for real.

As the week began the macro trends took control. Gold moved higher while Crude oil started higher but fell off through the week. The US Dollar Index did continue sideways but to the lower end of the range while US Treasuries moved higher. The Shanghai Composite and Emerging Markets started higher but reversed ending the week lower. The Volatility Index started the week heading lower as Equity Index ETF’s SPY, IWM and QQQ moved higher only for all to reverse with Equities closing near the lows of the week and Volatility spiking again. How does this impact the view for the week ahead? Let’s look at some charts.

As always you can see details of individual charts and more on my StockTwits feed and on chartly.)

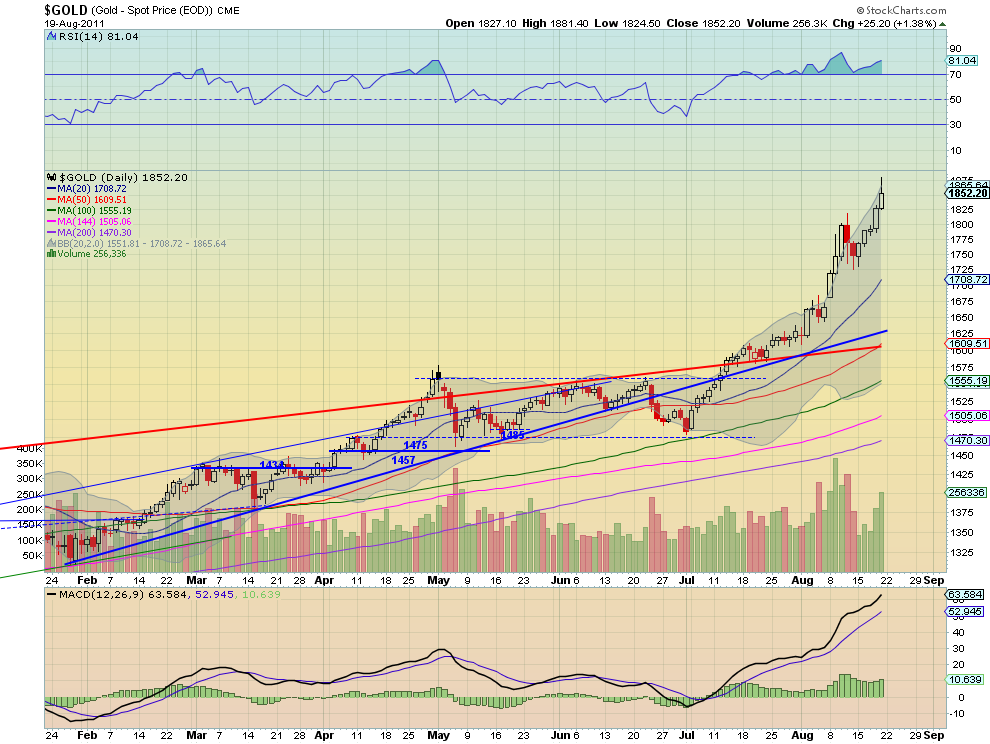
Gold Daily, $GC_F

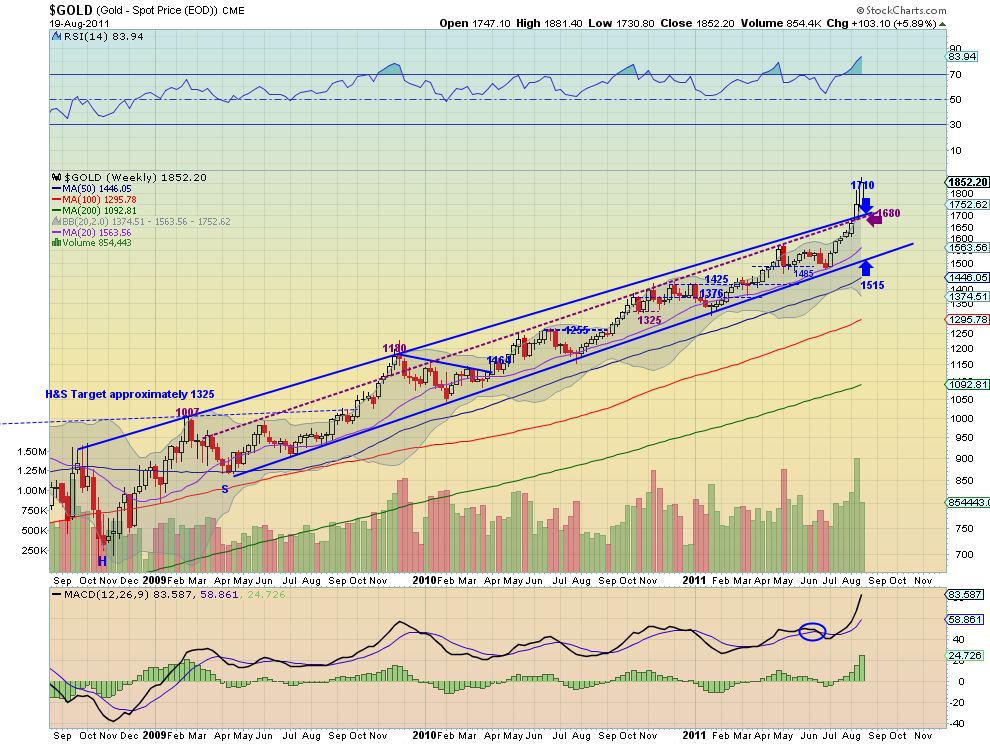
Gold Weekly, $GC_F

Gold took off right out of the gate and never looked back adding over $100 for the week. The Relative Strength index (RSI) on the daily chart remains elevated but the Moving Average Convergence Divergence (MACD) is increasing again. It did stay within the Bollinger bands this week and volume was increasing for this leg higher. The weekly chart printed a continued move higher above the channel, confirming the breakout with a target of 1905. The RSI is higher than it has been since May 2006 and the MACD is large. It finished well outside of the Bollinger bands on the weekly time frame. The trend remains higher ans expect that to continue next week, but be cautious about adding or creating a new position as it is getting extended from the trend and the Simple Moving Averages (SMA). Any pullback should find support at 1800 or 1748 below that.

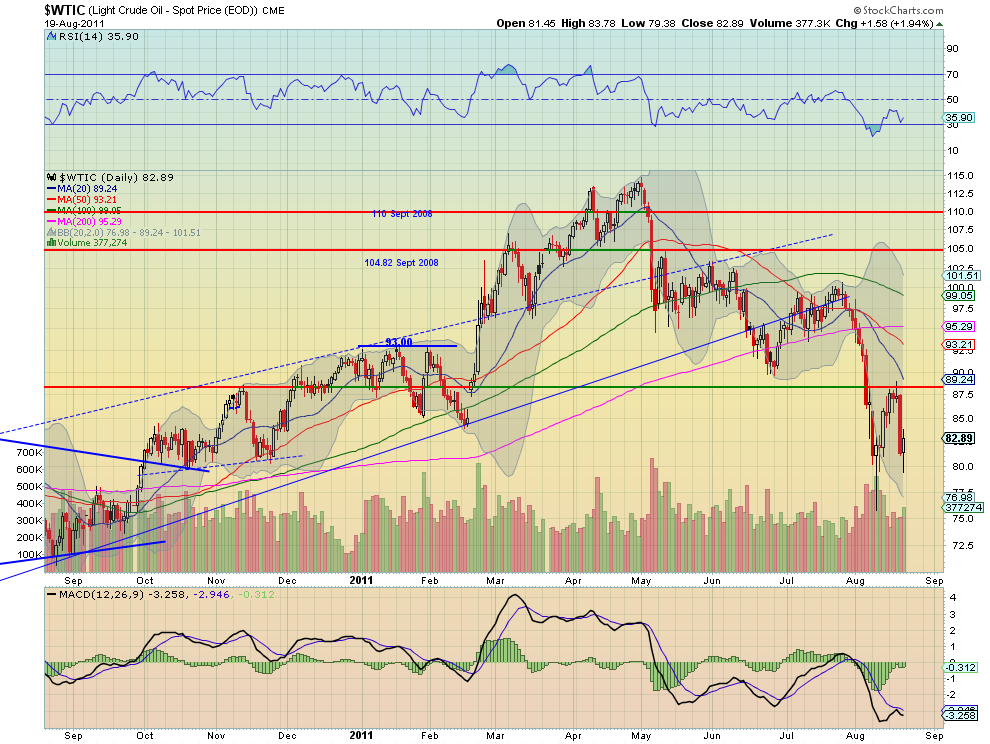
West Texas Intermediate Crude Daily, $CL_F

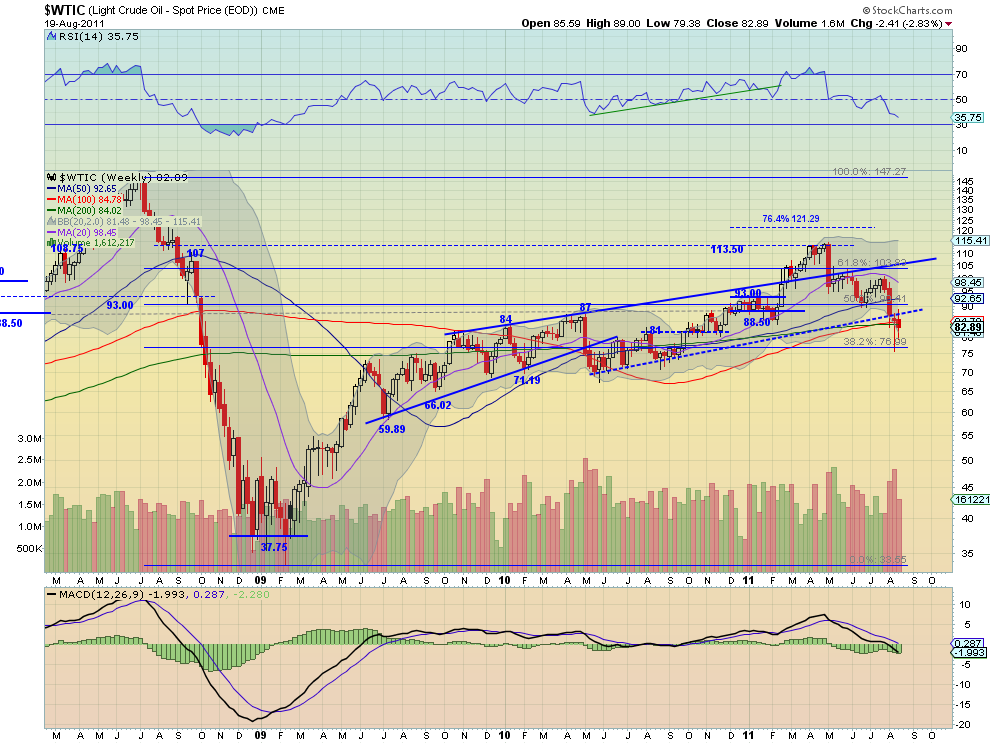
West Texas Intermediate Crude Weekly, $CL_F

Crude Oil continued its move higher early in the week but found resistance at the 88 support/resistance level and moved lower. By Friday it held support at the previous low area at 81. The daily chart shows the RSI bouncing off of the 30 level but the MACD kissed and moving lower. The weekly chart shows the continued break lower, failing to confirm the hammer from last week. The RSI is heading lower as is the MACD, suggesting more downside on the time frame. Look for Crude Oil to continue lower next week with the 81 area proving important and then 77 below that. Keep in mind a Measured Move (MM) lower would target 68.

US Dollar Index Daily, $DX_F

US Dollar Index Weekly, $DX_F

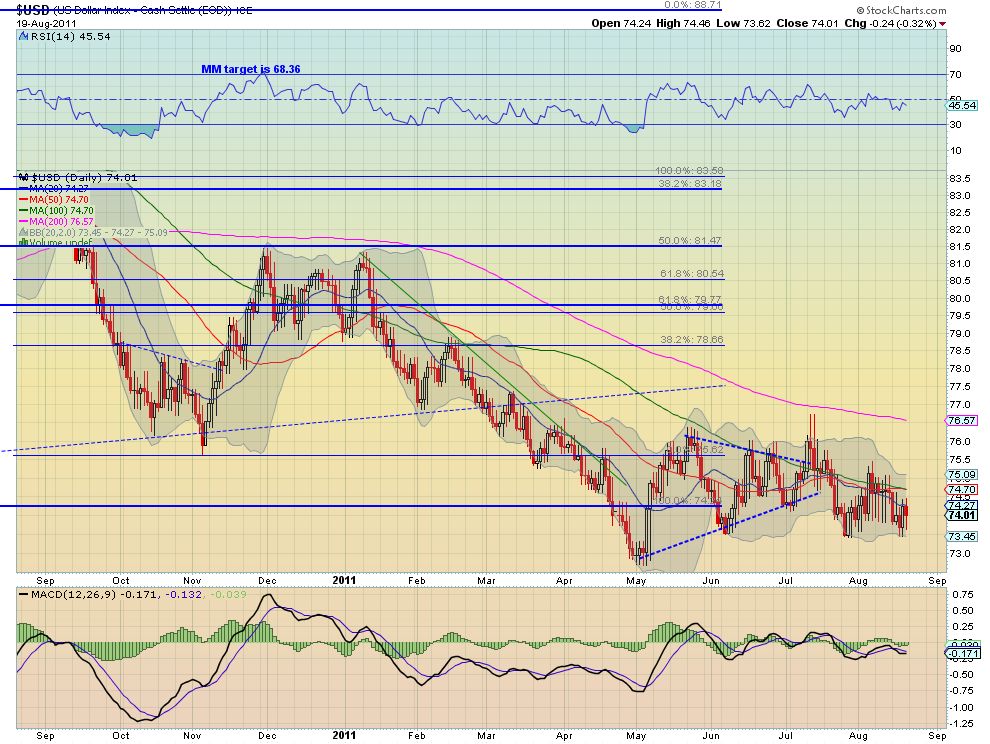
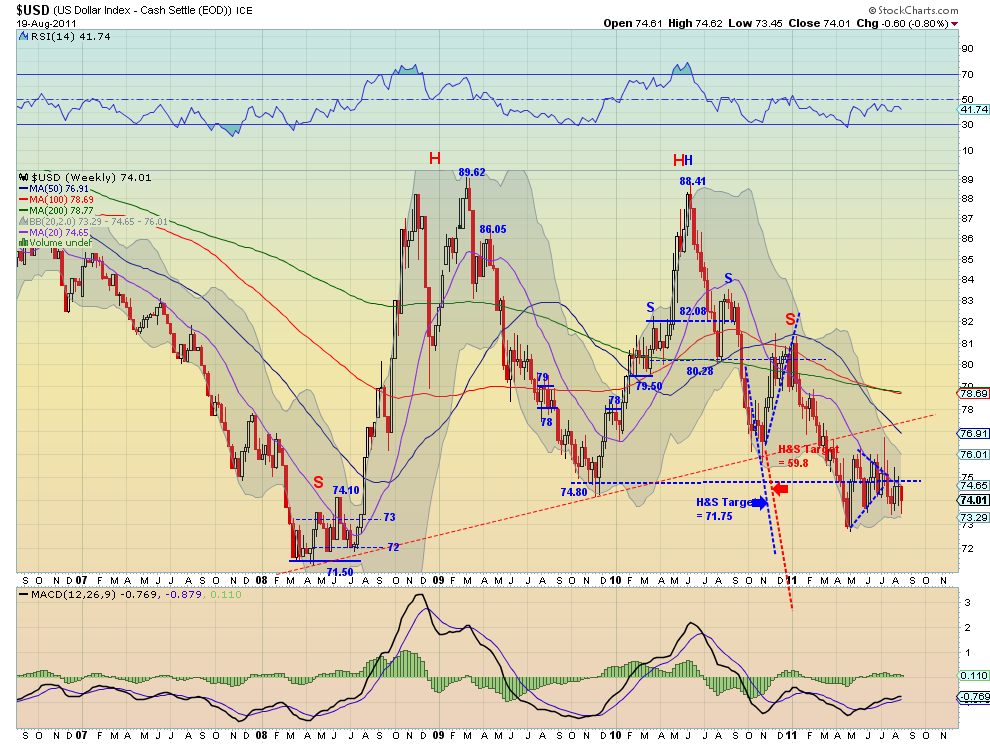
The US Dollar Index continued its move sideways in the range between 73.50 and 76. The RSI and MACD on both the daily and weekly basis continue to muddle around the mid line offering little guidance for any future move. But the trend remains lower with a long bear flag. The target on a MM lower is 56, below the Head and Shoulders target of 59.80. Look for more milling around next week within the 73.50-76 range, with a move lower finding support at 73 and then 71.50. Above 76 has resistance at 77.30.

iShares Barclays 20+ Yr Treasury Bond Fund Daily, $TLT

iShares Barclays 20+ Yr Treasury Bond Fund Weekly, $TLT

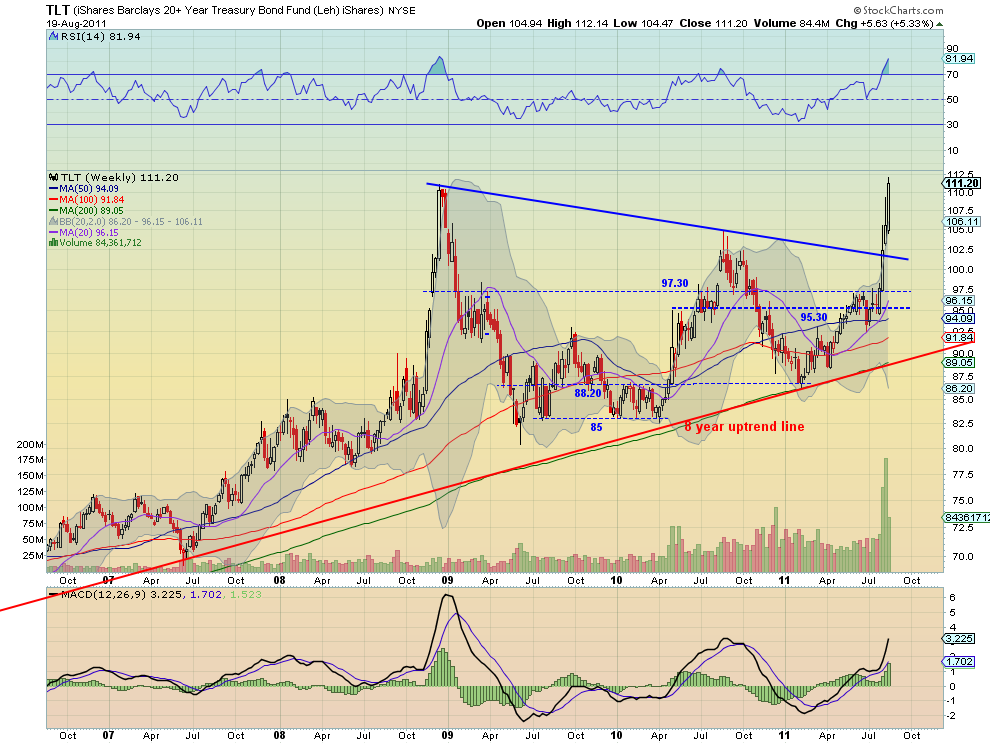
Treasuries, as measured by the ETF $TLT, continued their breakout higher this week making a new all time high. the RSI on the daily chart is strong pointing higher and the MACD is increasing again, both supporting more upside. The weekly chart continued the breakout of the symmetrical triangle, with the RSI becoming elevated near 82 but the MACD growing. Volume was a bit lower this week and it finished well outside of the Bollinger bands for the third week in a row, both adding to the caution of the elevated RSI. Look for more upside next week with 115 the next target and a note that the target for the triangle breakout is at 136. Any pullback has some support at 109.30 and 108 before 106.

Shanghai Stock Exchange Composite Daily, $SSEC

Shanghai Stock Exchange Composite Weekly, $SSEC

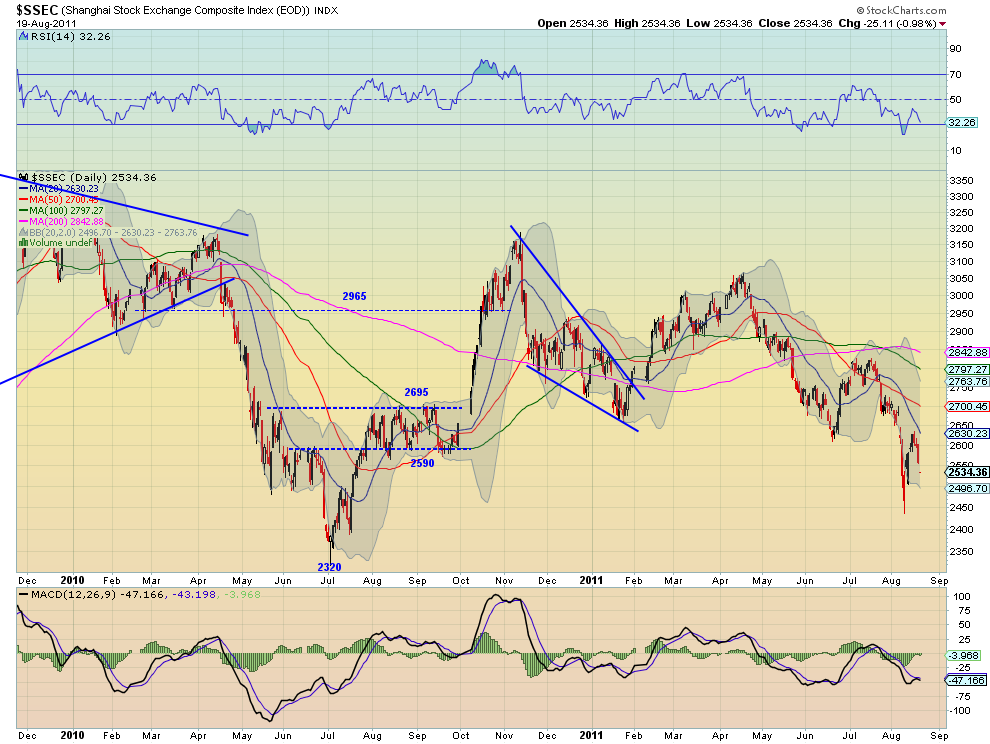
The Shanghai Composite continued its move lower after finding resistance at the June low near 2625. The RSI is moving lower and the MACD is also after missing a cross higher on the daily chart. The red candle on the weekly chart could not confirm the hammer from last week as it moves below support between 2571 and 2590. the weekly RSI and MACD continue to signal more downside. Look for next week to continue lower for the Shanghai Composite. there is support at 2500, 2450 and 2400 before a MM target at 2360, coinciding with the 61.8% Fibonacci retracement at 2357. Any move higher has resistance at 2695-2700.

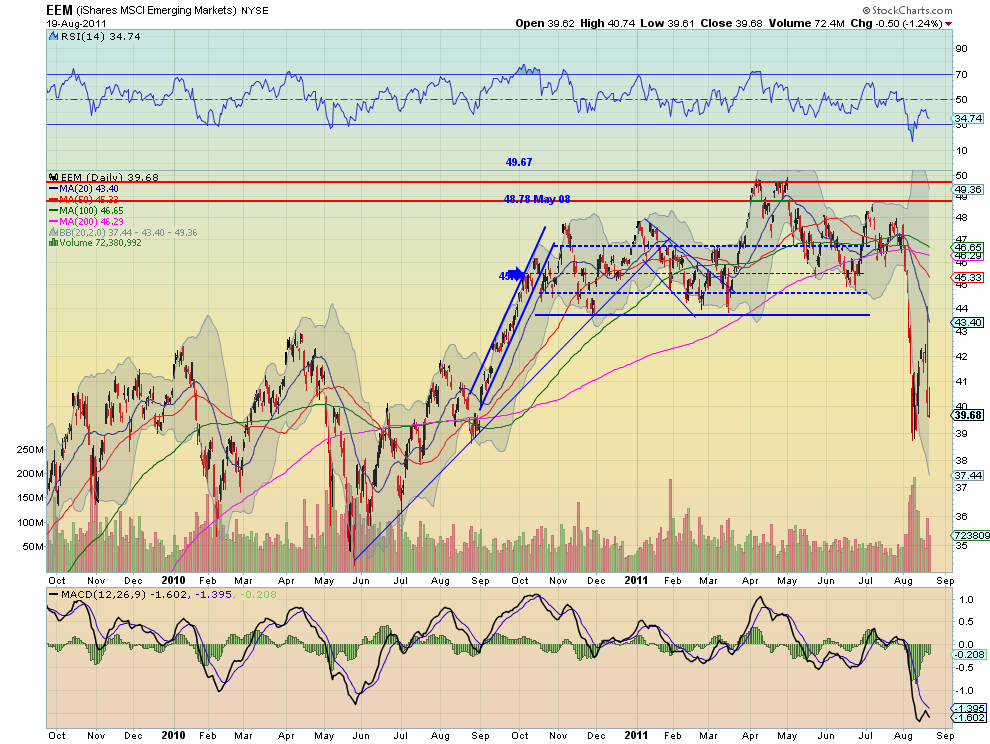
iShares MSCI Emerging Markets Index Daily, $EEM

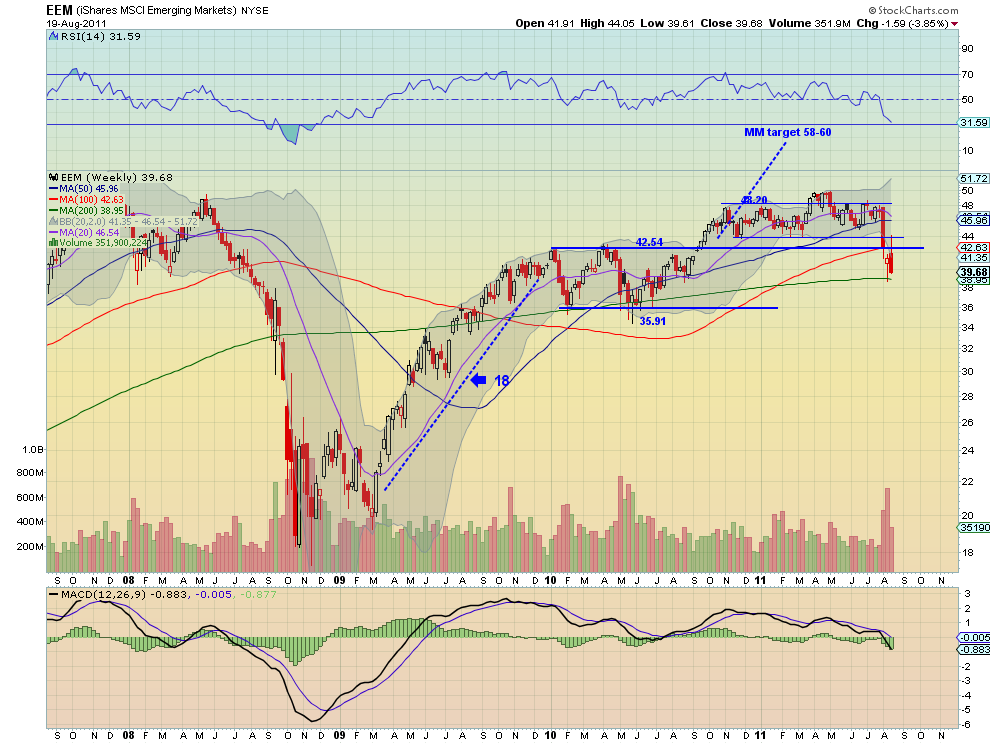
iShares MSCI Emerging Markets Index Weekly, $EEM

Emerging Markets, as measured by the ETF $EEM, moved higher before crashing on Thursday. The RSI on the daily chart has turned lower and the MACD blew an air kiss before heading back lower. The weekly chart looks worse with a big bearish engulfing candle complementing a RSI that is falling and a MACD that is growing more negative. Look for the downside to continue next week with support at 39 followed by 38 and 35.91. Any move higher should find some resistance at the 40.75-.89 area and then 42.54.

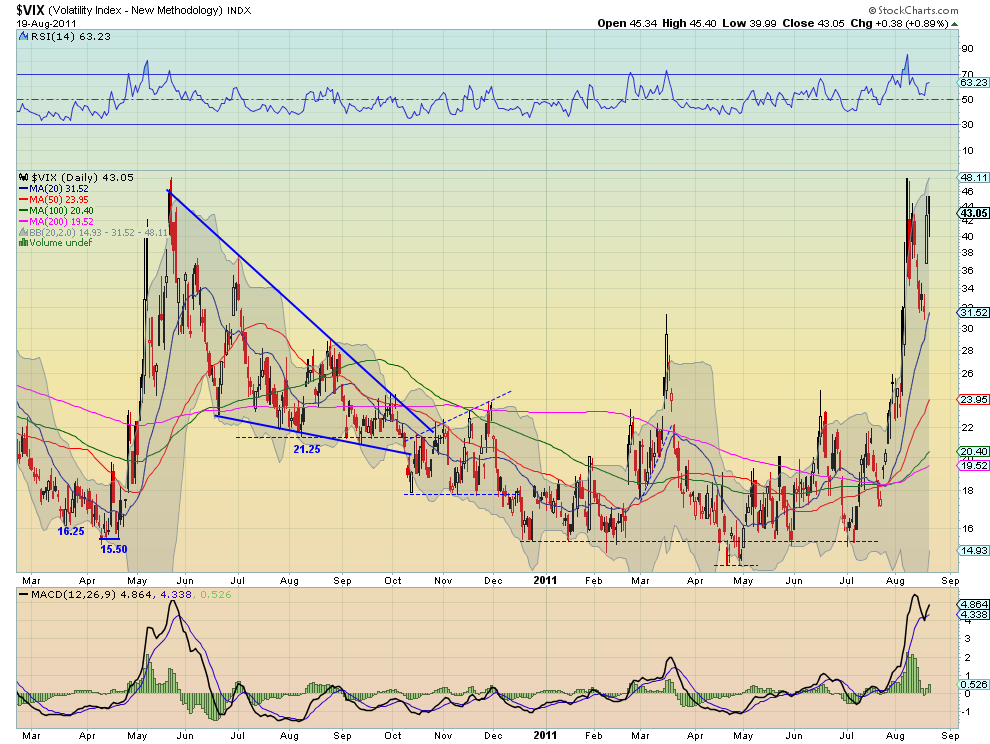
VIX Daily, $VIX

VIX Weekly, $VIX

The Volatility Index jumped back higher to end the week, after a move lower early, breaking the bull flag higher to near last week’s high. The target for the flag break is 56. The RSI on the daily chart is rising and the MACD is increasing again both suggesting more upside. On the weekly chart the bullish engulfing candle negated last week’s inverted hammer/shooting star. The RSI on this time frame is rising and becoming elevated while the MACD is increasing as well. The RSI has fallen hard the last 2 times it has reached this level, suggesting a move lower may come soon. look for continued elevated Volatility next week with any pullback finding support at the 34-35 area and a move above 50 leading to a greater rise.

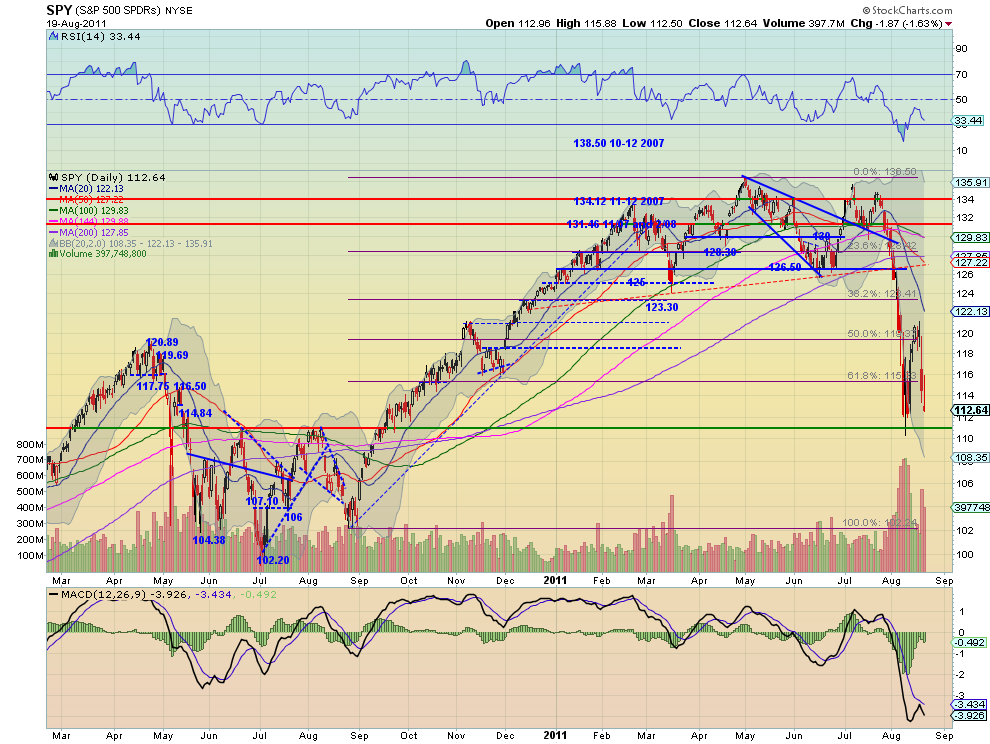
SPY Daily, $SPY

SPY Weekly, $SPY

The SPY started the week higher before a violent move lower to end the week near 112 support and the recent lows. The RSI is pointing lower and the MACD is growing more negative after it blew a Real Housewive’s of New Jersey air kiss. The weekly chart printed a bearish engulfing candle just above the 200 week SMA at 111.16. The RSI and MACD on the weekly basis support more downside. Look for the carnage to continue next week with some support in the 111.15 area and then the range between 110 and 102.50. Any upside move looks to find resistance at 114.14 and then 115.83-116.

IWM Daily, $IWM

IWM Weekly, $IWM

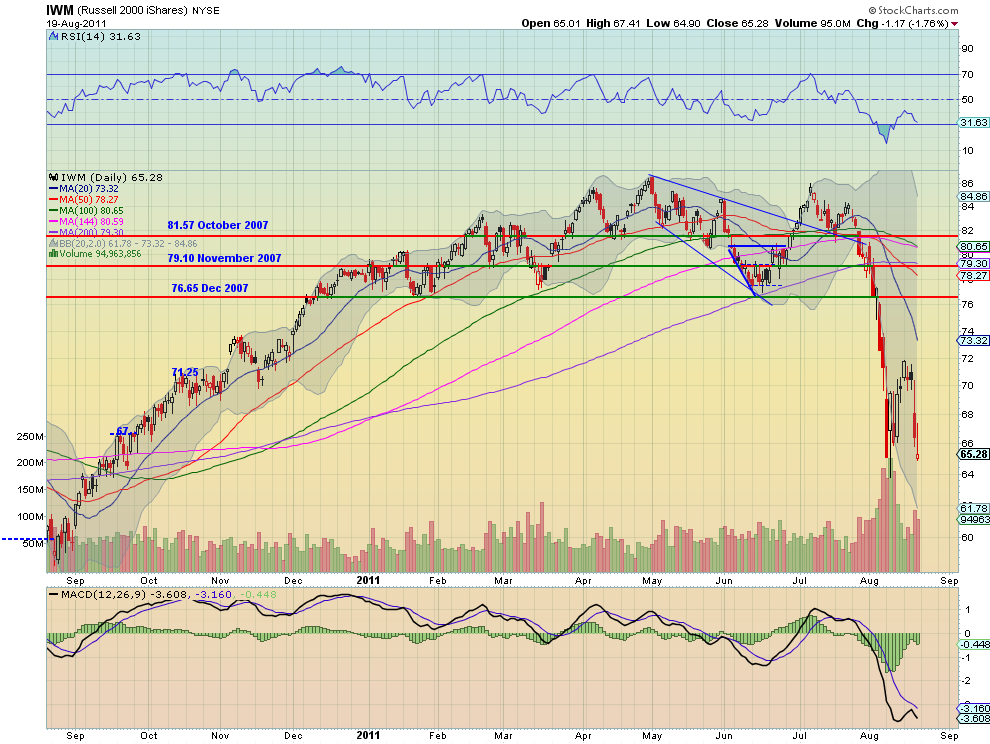
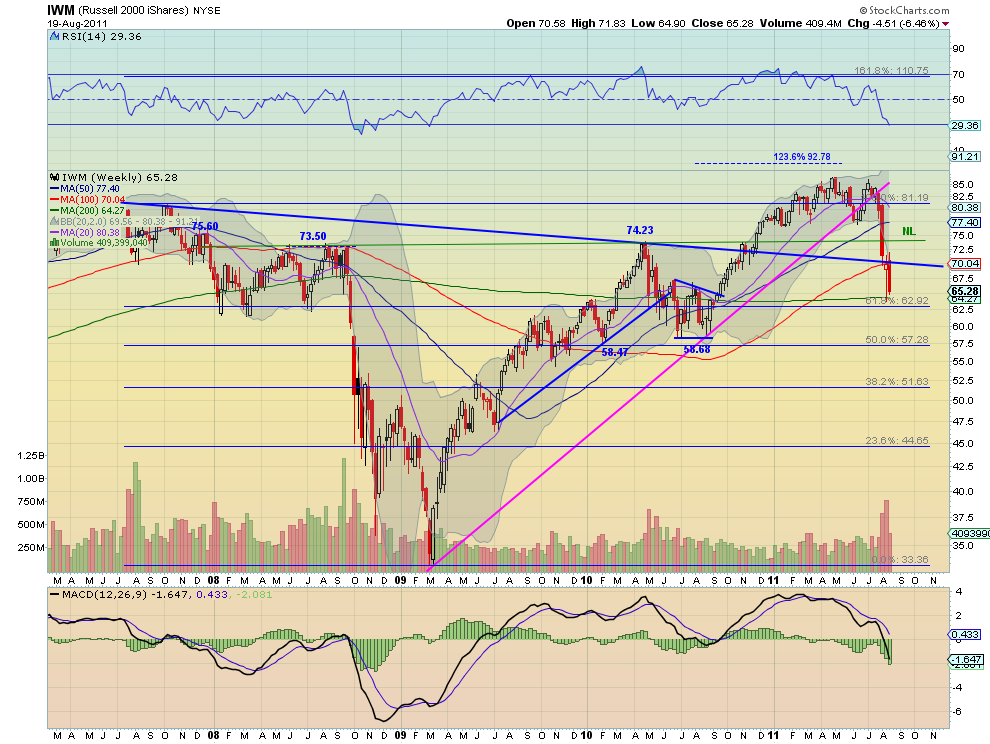
The IWM also started the week higher before a violent move lower to end the week near 65.25 support. The RSI is pointing lower and the MACD is growing more negative after it blew a air kiss on the way down. The weekly chart printed a bearish engulfing candle just above the 200 week SMA at 64.27, that rejected on a test of the Head and Shoulders neckline from below near 70. The RSI and MACD on the weekly basis support more downside also. Look for the downside to continue next week with support in the range between 64 and 58.60. Any upside move looks to find resistance at 70 and then 72.

QQQ Daily, $QQQ

QQQ Weekly, $QQQ

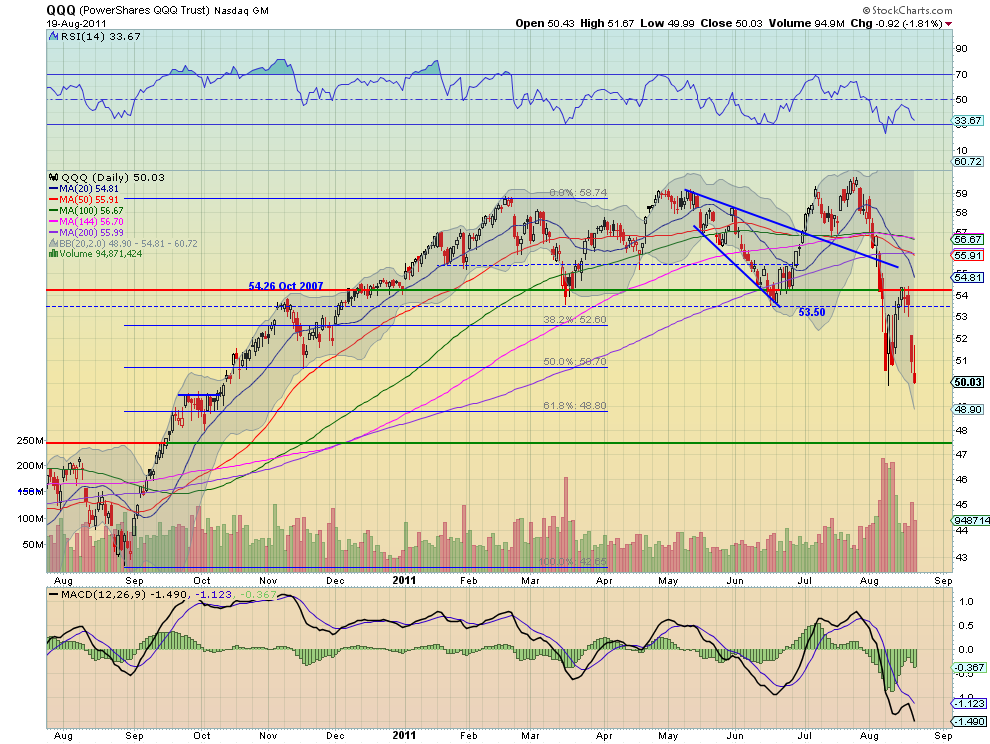
The QQQ also started the week higher before a violent gap move lower to end the week at 50.03 support. The RSI is pointing lower and the MACD is growing more negative after it also blew an air kiss on the way down. The weekly chart printed a bearish engulfing candle just above the 100 week SMA at 49.85, that is testing from above the Head and Shoulders neckline. The RSI and MACD on the weekly basis support more downside also. Look for the downside to continue next week with support in the range between 49.50 and 48. Any upside move looks to find resistance at 52.60 followed by 53.50 and then 54.26.

The entire rubber band of the market is getting a little stretched but expect it to continue next week. Gold looks to continue higher as Crude Oil continues to sell off. The US Dollar Index appears comfortable continuing sideways while US Treasuries move higher. The Shanghai Composite and Emerging Markets look ready for more downside. Volatility looks biased higher leading to the expectation that Equity Index ETF’s SPY, IWM and QQQ continue lower. Remember that a stretched rubber band can result in two outcomes: a snap back, or the rubber band breaks and the real carnage results. Stay nimble. Use this information as you prepare for the coming week and trade’m well.

Follow Us