Showing posts with label metals. Show all posts

Thursday, February 23, 2012

A Golden Buying Opportunity


The lightness of the correction in gold is very bullish for the metal as well as its ETF vehicles, and as this drought ends, the next big leg up may soon begin.
The two-week pullback in gold futures from the early February highs was very mild, as it also was in the most popular gold ETFs .
With less than a 3% correction from the highs, last week’s close suggested that the correction might be over. Tuesday’s strong opening and the close above the recent swing high supports this view.
The weekly and daily chart formations have indicated for several months that the drop from the early September highs was just a pause in the uptrend. Thesecontinuation patterns are one of my favorite formations to trade.
The completed flag formations on both the futures and ETFs have initial upside targets well above the September 2011 highs. Therefore, the two key gold ETFs, the Spyder Gold Trust (GLD ) and the iShares Gold Trust (IAU ), both look attractive for new purchases, as the recommended stops make the risk very manageable.
chart

Click to Enlarge
Chart Analysis: The weekly chart of the gold futures shows the completion of the flag formation (lines a and b) in the latter part of January.
  • The tight weekly ranges and triple “dojis” made a deeper correction less likely
  • Once above the 2011 highs at $1,942, the 127.2% upside target is at $2,035
  • As I noted in my article on longer-term Fibonacci projections, the next “major target is $2,274”
  • The weekly on-balance-volume (OBV) closed last week very strong, as it shows a bullish zig-zag formation
  • The weekly OBV is leading prices higher, even though the daily OBV (not shown) is still below its WMA
  • There is short-term support for the April futures at last week’s low of $1,706, with more important levels at $1,652
The daily chart of the Spyder Gold Trust (GLD ) shows the completion of the flag formation, lines d and e.
  • There is near-term chart resistance at $173.80, and then further levels in the $175.40 area
  • The flag formation has a 127.2% Fibonacci retracement target in the $196 area
  • The daily OBV confirmed the price breakout as it overcame its downtrend, line f. The OBV is still below its WMA but has turned higher
  • Short-term support now sits at $170.75 to $169.50, with more important levels at $166
  • GLD’s recent correction held well above the 38.2% Fibonacci retracement support at $162.40, as the recent low was $166.17
  • The breakout level (line d) and stronger support in the $158-$162 area
chart

Click to Enlarge
The hourly chart of GLD shows the completion of the “flag formation” (lines a and b) with the gap higher opening Tuesday.
  • This formation has a short term 127.2% Fibonacci retracement target at $172.60
  • The hourly OBV confirmed Tuesday’s price action as it overcame the resistance at line c
  • The gap support is now in the $168.33 to $169.59 area
Investors should also consider the iShares Gold Trust (IAU ) which has a slightly lower expense ratio than GLD. The daily chart shows that after completing the flag formation, lines d and e, the pullback has also been slight.
  • There is next resistance in the $17.60 area, and then at the September high of $18.63
  • The 127.2% Fibonacci price target is at $17.68
  • The daily OBV has turned up and a move back above its flat WMA will confirm that the correction is over
  • There is minor support now at $16.60-$17 with stronger at $16.30
What it Means: The shallowness of the correction in gold and the gold ETFs is typically very bullish, as it suggests that prices can accelerate to the upside from current levels.
The previously recommended buying zones were not hit, and stops not under the recent lows should hold.
How to Profit: For the SPDR Gold Trust (GLD ), go 50% long at $170.44 and 50% long at $169.12, with a stop at $164.88 (risk of approx. 2.9%).
For the iShares Gold Trust (IAU ), go 50% long at $17.08 and 50% long at $16.86, with a stop at $16.32 (risk of approx. 3.8%).

Saturday, September 24, 2011

Dollar Index Joining Treasuries in the Smack Down


Wednesday US Treasuries ($TLT) delivered a smack down, putting the US Equity Markets ($SPY) and Gold ($GLD) in their place. This was detailed in the link below. Thursday this continued with the US Dollar Index, Copper and Crude Oil taking sides. Let’s take a look.

US Dollar Index, $DX_F

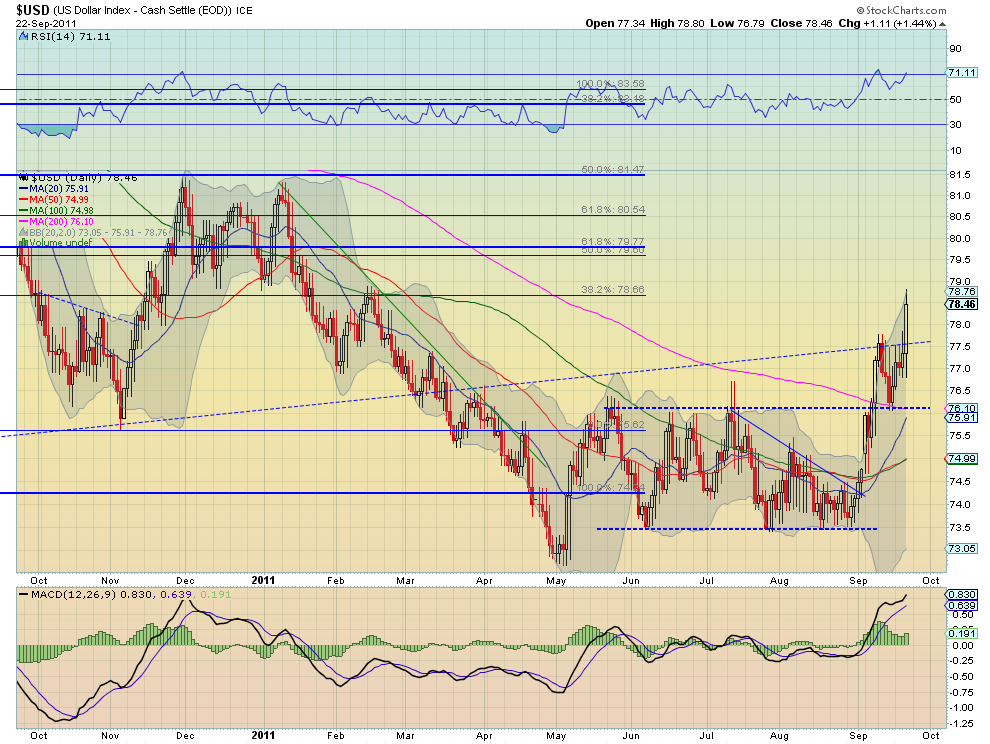
The US Dollar Index ($DX_F, $UUP) was the big winner launching through the 3 year rising trend resistance out of a bull flag. The measured move out of the flag is to 80.10 but it has some resistance along the way at 79, and then 79.28, and 79.60. The rising Relative Strength Index (RSI) and increasing Moving Average Convergence Divergence (MACD) indicator support more upside. Like Rocky Balboa, almost down for the count, it is rising up off the mat to take on the world, joining Treasuries.

Copper, $HG_F

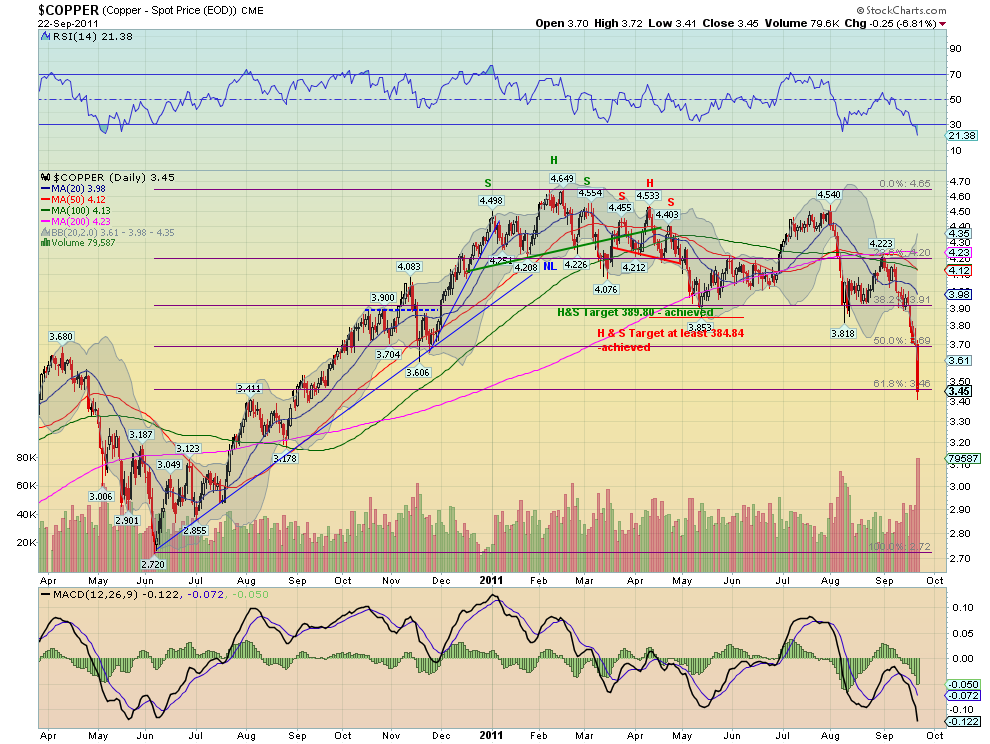
Copper ($HG_F, $JJC), thought by many to be the tell for future market direction, responded with only bad news. Falling through support at 3.69 and now attempting to hold support at the 61.8% retracement of the move higher from June 2010, at 3.46 it’s best hope is that the RSI is becoming oversold. That said the trend is down and the indicators suggest more to come. If it is a market tell then this is not a pretty story to come.

Crude Oil, $CL_F

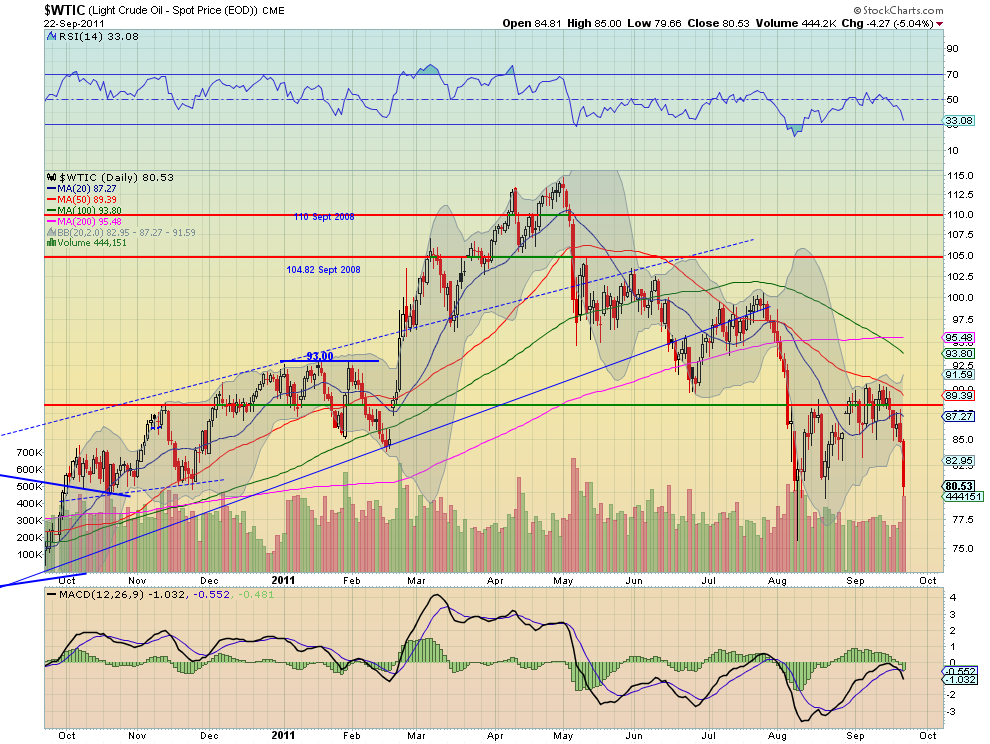
Crude Oil ($CL_F, $USO) was also a casualty of the recent global moves. It finally broke the bear flag lower, and now sees its next support at 77 and has a target on a Measured Move to 70. The RSI and MACD also point to more downside.

Looks like the new world order, at least for the short run, has been set over the last two days. US Treasuries and the US Dollar are in charge and driving all risk assets and economically sensitive assets lower. Treasuries and the US Dollar up, at the expense of the US Equity Indexes, Gold, Crude Oil, and Copper. Paper promises outperforming hard assets and profitable companies. May God help up.

Gold Swiss Franc pattern

by Kimble Charting Solutions


Why did Gold and Silver Plunge? No, It's Not CME Margin Hikes; What will the Fed do Next?

by Mike Shedlock

Many people have asked me to comment on the plunge in gold and silver. First let's take a look at the wrong answer: Case Closed: CME Hikes Gold, Silver, Copper Margins
And there you have it: CME just hiked gold margins by 21%, silver by 16% and copper by 18%. Mystery solved.
Sorry Tyler, wrong answer.

Four Reasons for Metals Plunge

  1. Fed did far less than expected
  2. Mutual fund redemptions
  3. Margin calls at hedge funds
  4. China growth story fading

1. Fed Did Far Less than Expected

The Fed did not do what everyone thought, which is to say something far more than "Operation Twist".

As noted in advance, I explained why the Fed wouldn't do more than Operation Twist, in Six Things the Fed May Announce Tomorrow (But Likely Won't); Would Any of Them Matter? Gaming the Reaction.

In short, the Fed did not print, or even threaten to print. Moreover the Fed committed to a strategy not through the end of this year, but all the way through June of 2012. Perhaps the Fed does more in the interim, perhaps not.

For those expecting drama, the Fed's non-action was decidedly bearish for commodities in general, even gold.

2. Mutual Fund Redemptions

Mutual fund cash levels are at or near record lows. In general, mutual funds were not prepared for the market selloff and sell orders came in. Rather than sell garbage like Bank of America at $6, mutual funds unloaded stuff like gold, taking profits.

3. Margin Calls at Hedge Funds

Hedge funds unloaded gold and silver for the same reasons as mutual funds, but also because they mistimed the play and what Bernanke would do. Leverage works both ways.

4. China Growth Story Fading

Commodities in general have been clobbered along with currencies of commodity producing countries because the global economy is slowing rapidly.

As in 2008 there will be no decoupling. China is not a growth engine in any real sense of the word. Instead, China desperately needs demand from the US and Europe. Moreover, China is overheating and has a huge property bubble to boot, at precisely the wrong time. Commodities were set to plunge on the China story alone.

Metals Volatility

In the wake of increased volatility related to the above, the CME hiked margins. That likely added to the volatility but was not a fundamental "cause" of the plunge in precious metals.

What will the Fed do Next?

"Bay of Pigs" asks ...

Mish, Any thoughts on what the FED will do next? I doubt they sit there and do nothing.

Thanks Bay. That was a good question. This is why:

1. It is a single question, not five questions
2. It is a question on topic
3. It is a question I have not explained 10 times already
4. It is macro-based, not stock specific
5. It seeks an honest opinion rather than asking for something that may take hours of research


Problems for Bernanke

Market expectations were clearly for the Fed to do more. Goldman Sachs was shocked at the market reaction, I was not. See Goldman Surprised by Reaction to "Operation Twist" for details.

The problem for Bernanke is every action he may take now has serious negative ramifications. Fort example, take Operation Twist: The flattening of the yield curve may (I doubt it) help mortgages by lowering mortgage rates. However, the flattening of the yield curve will without a doubt hurt banks struggling to make profits on spreads.

The flattening of the yield curve also hurts those on fixed income as well as pension plans with 8.5% or so yield assumptions. The irony is pension plans might have gotten big returns had they been in treasuries, but they weren't because treasury yields were "too low".

Instead, pension plans all plowed into foreign bonds, commodities, currencies, and global equities to make their 8.5% assumptions.

So what is Bernanke to do?

See Bernanke, a Complete Dunce, "Puzzled by Weak Consumer Spending" for more on how the self-proclaimed student of the great depression is clueless about the current depression.

Bottom line: The Fed is more or less out of bullets. Moreover, Bernanke admitted he does not know why his policies are not working even though it is perfectly obvious.

When backed in a corner, Bernanke may conceivably try nearly anything. However, Bernanke is just not that desperate yet. Right now, European banks are at far greater risk than US banks so Bernanke may easily bide his time.

Silver Daily Chart

Silver, once again, is acting more like a leveraged commodities plaything than a currency.


I traded all my silver for gold on April 27, as noted in Taking Silver Profits - Swapping Silver for Gold.

Gold is still higher than my swap point.

At the time, I commented "I believe the price of silver is highly likely to revisit the low $20's at some point. Thus, I see no point in chasing silver higher here. Moreover, except for pure speculation, I see little reason to even hold silver in this spike."

I really do not know if silver hits the low 20's or not, but I was not tempted by that previous decline to near $32. Had I bought it there, I made a mental sell at $40. Silver got all the way to $44 and to be honest I was wondering if it would take out my swap point.

Silver breached $30 today.

As I have commented many times, silver is a far riskier play than gold. I believe this volatility proves my point.

CME margin hikes are not a cause of 40% collapse in silver from the top.

No Hiding Places

On September 19th I wrote No Hiding Spots Except Despised US Dollar: Equities Red, Metals Red, Energy Red, Grains Red
No Hiding Spots Except Despised US Dollar

If you have not done so already done so, please consider the possibility there will be no hiding spots except for US dollars and short-term US treasuries (yielding nothing) in a renewed strong downturn.

I expect gold to hold up in a major decline, but I could easily be wrong. One encouraging sign is the $HUI gold miner index is down less than a percent even though gold is down by 2% and the S&P and Dow are down by almost 2% as well.
Short-term, I have been wrong about gold holding up. Then again, I really do not concern myself with short-term action. Moreover, gold is higher than it was the day I swapped it. The equity markets in general sure are not.

Bernanke Will React

It's a safe bet Bernanke will react, we just do not know when. Things may (or may not) get ugly for miners (especially silver) in the meantime.

Those with cash, should be rooting for a selloff in gold and miners. In the meantime, hold a core position in gold. Take profits on big spikes and buy big dips.

At some point that advice will stop working, I just do not think this is the time.

Gold Wave 4 Correction Continues


I got a bit of hate e-mail over the last few weeks from the Gold Bugs who thought I didn’t know what I was talking about when I forecasted a multi-month consolidation and correction in Gold was imminent. I’ve written ad nauseum about crowd behavioral patterns as they related to both stock markets and precious metals. It should not come as a surprise that Gold is continuing to drop after a 34 Fibonacci month rally from $681 to $1910 per ounce. That rally came in five clear Elliott Waves and ended with a parabolic race to the top. I consistently warned my subscribers and readers of my articles about not being caught holding the bag and to take defensive measures.

My most recent update was to simply try to figure out whether the continuing correction in Gold would take the form of an ABC pattern or an ABCDE Triangle Pattern. It is becoming more clear that the official pattern is ABC. In English it means that the first leg down from 1910 to 1702 was the “A” Wave, the rally back up to 1920 was the “B” wave. The C wave is continuing underway and one of my longstanding targets is $1643, which is a Fibonacci fractal relationship to the prior lows and highs, and also conveniently fills in a “Gap” in the Gold chart in the 1650’s.

During these 4th wave consolidation periods, it reduces sentiment back down to normal levels and lets the economics of the move in Gold catch up with the price action that was extended. The first area to watch is the re-test of $1702 spot pricing for a C wave low, but the evidence is for a further drop to $1643 before I would get too interested in trying to game Gold to the upside.

Here is the chart I sent out 9 days ago with Gold at $1837 forecasting a possible C wave continuing lower


I’ve stayed away from either shorting Gold or going long gold while I watch and confirm the 4th wave pattern. It’s simply the smart way to go knowing that upside will be difficult to obtain and downside risks are high. It does now appear that I am eliminating the Triangle pattern and sticking with the ABC Correction with the C wave still working its way lower. If $1702 breaks, then you should expect to see 1620-1643 as next pivot low ranges.


Gold and Silver collapse as the crowd rushes to the Exit

by the trader

It never is different, especially when the crowd does the same thing….Silver and Gold collapse. We are awaiting the first casualties after these moves.

See the original article >>

Friday, September 23, 2011

Risk Off as markets collapse on European Fear


As Europe collapses, without Panic (this is disturbing), under the HFT Regime no volume melt down, other asset classes are joining the Implosion. Markets are moving on light volume, driven by fear, as now every pundit sees Europe on the verge of a collapse. Maybe it is time to start buying small? Note, Stoxx 50 was up 70% from bottom to top, and has now retraced some 36% from the highs, set onkly a few months ago. Majority of investors are now down big time, as the group didn’t buy the bottom…


Tuesday, September 20, 2011

Perfect Storm For A Tsunami of Gold Demand


A few weeks ago we held our Case for Investing in Gold webcast with the World Gold Council’s (WGC) Jason Toussaint, who gave some remarkable insight into gold demand in the East. In these countries, gold is not only celebrated, acquired, worn or displayed during holidays or special occasions; it is seen as an everyday symbol of wealth.

Increases in demand from China and India have driven a 7.5 percent increase in demand for gold jewelry during the first half of the year despite a 25 percent increase in the price, according to a report released this week from GFMS. However, much of India’s potential gold demand remains untapped.

Toussaint highlighted an interesting fact: Of the roughly 800 tons of gold imported to India each year, only the top 40 percent of Indian households purchase all of the country’s gold, says Toussaint. The other 60 percent of Indians, who may have the same adoration for gold and celebrate Ramadan and Diwali, historically may not have had access to purchase gold. This large population represents a huge untapped market. To fulfill demand, the WGC has created a program with Indian post offices to distribute coins and small pieces of gold. Toussaint says right now there are 700 post offices in the rural areas servicing 90,000 customers and he expects that number to grow. This market is worth pursuing based on McKinsey’s research that a “huge wealth creation wave” is developing in India. As Toussaint puts it, “if purchase patterns continue, we will see from 2005 to 2025, a four times larger gold market in India.”

This is a fascinating idea because very few entities other than the post office have the network and infrastructure necessary to reach beneath the surface of the world’s largest gold market.

India may be the world’s largest gold market, but in China, gold buying has become so significant that the country has become the fastest-growing market for gold jewelry in the world. Not only are Chinese purchasing increasing amounts of gold, they prefer pure 24-carat gold. This high-quality gold is given to celebrate special occasions, such as birthdays, and purchased for a bride at her wedding. In 2010, 6.6 million brides will make gold a part of their ritual as the yellow metal signifies the importance of a long-term relationship, says the WGC website.

While jewelry represents a large percentage of gold purchases in the country, Chinese can also purchase gold at their local bank. WGC formed a partnership with the Industrial and Commercial Bank of China (ICBC Bank), the largest bank by deposits in the world. They began offering a “Gold Accumulation Plan” that lets investors buy and accumulate small portions of gold over time. Similar to a bank account, people participating have access to the underlying gold or the cash value at any point. Since it was launched in December 2010 through this summer, the ICBC has an estimated 1.7 million accounts, with an accumulation of more than 12,000 kilograms of gold.

After India and China led the global demand for gold, accounting for 52 percent of 2010 tonnage, the GFMS says the two Asian countries have “continued impressive growth” this year. Gold buying in India jumped 38 percent during the second quarter alone. GFMS reported China’s gold purchases jumped 90 percent on a year-over-year basis through June. This is a follow up to the 75 percent increase in gold demand the country experienced last year.

This share tops all of North America, which accounts for 8 percent, Europe and Russia, which account for 13 percent, and even the Middle East and Turkey, which together account for 12 percent. North American gold demand fell 12 percent during the first half of 2011 due to the slumping U.S. economy and rising prices.
Global Gold Demand Led By India and China

David Lamb, the WGC’s managing director for jewelry, recently told Reuters there is a “significant tidal shift to the Asian markets, to India and China in particular, and gold rising upwards and disappearing from the mass merchandising in the West.”

Central Banks Load Up on Gold

Demand for gold isn’t only coming from the residents of China and India. There’s been a huge sentiment shift among central banks as well. Toussaint noted how, after many years of selling, central banks have become net buyers of gold. He says, “Western Central banks have essentially shut the tap off, and the vast majority of the buying is coming from Eastern central banks.”

Global Banks Have Turned Net Buyers of Gold

In just the first half of this year, official sector purchases are up three-fold over the 2010 total to 216 tons, accord to the GFMS report. GFMS says the rise is largely due to low sales levels from Central Bank Gold Agreement (CBGA) signatories and the International Monetary Fund (IMF) completing its sales program at the end of 2010. In addition, other countries have gobbled up gold in an effort to diversify reserves away from the U.S. dollar. Scotia Capital estimates central banks’ total purchases of gold will reach 248 tons by year-end.

Some of the big buyers have been Mexico (whose central bank purchased roughly 100 tons of gold earlier this year), Korea (purchased 25 tons in June), Thailand (purchased nearly 19 tons in June) and Russia (which has purchased over 50 tons of gold from its domestic market year-to-date).

Toussaint says Eastern central banks are “catching up with the rest of the world” because their current allocation is tiny right now. However, whenever the WGC discusses these buying habits with the central banks of Korea, Taiwan and other Asian countries, they consistently say that they are interested in gold, and looking to hold it over the long-term. In other words, he says, this is not a “knee-jerk reaction to the direction of the dollar.”

GFMS also believes that this could be just the beginning. In a release announcing the report, Philip Klapwijk, Global Head of Metals Analytics at GFMS, said, “we are in essence in chapter three of the central bank story—we’ve left behind a period of heavy net sales, then a short period of neutrality and we’re now in a new environment of heavy buying.”

Gold and Treasuries Near a Trigger


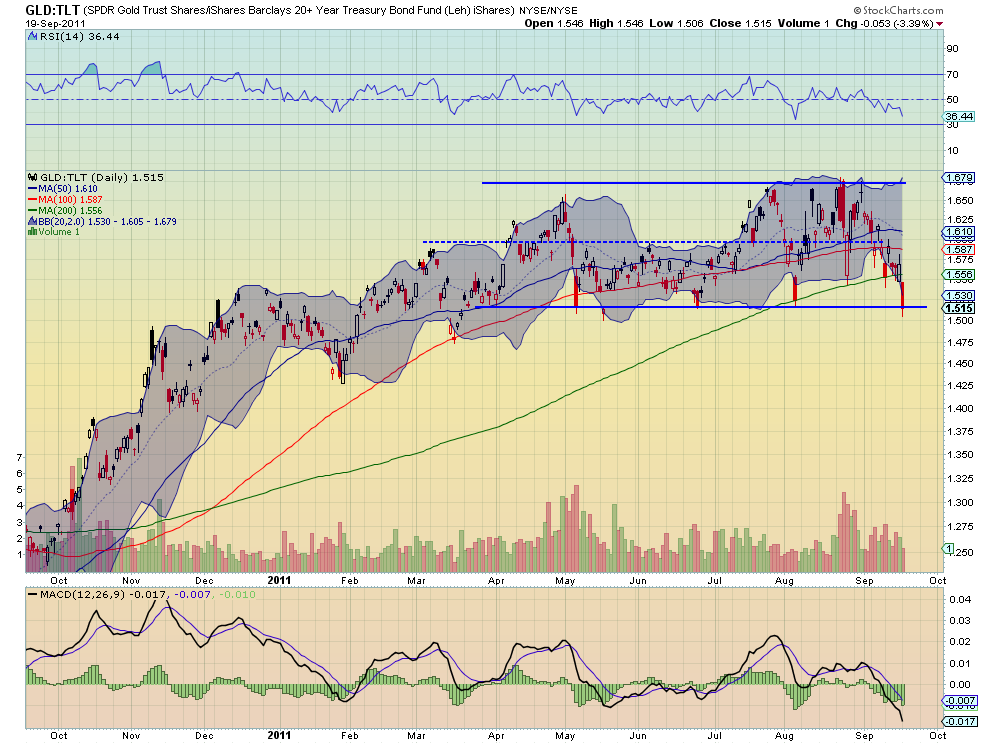
Gold has a technical relationship with many other market segments. Looking at its relationship with US Treasuries it s now at a critical juncture. Below is a ratio chart of the SPDR Gold Trust ($GLD) against the iShares Barclays 20+ Year Treasury Bond Fund ($TLT). Notice how this ratio has been in a range between 1.51 and 1.67 since April. A pretty tight correlation for this period. But now as it

approaches the bottom rail of this channel there are signs that it may crack. First the Relative Strength Index (RSI) has been trending lower, not a sharp move like the last time it bottomed. Next the Moving Average Convergence Divergence (MACD) indicator has been negative for most of the move down and is just now becoming more negative again. The volume on this move lower is much bigger than the last test as well. Finally it closed under the 200 day Simple Moving Average (SMA) yesterday for the first time since September 30th, just 10 days after the S&P 500 broke out of its bottoming pattern to start the move higher. It may hold the channel and and reverse back higher, but a breakdown, indicating a flow from Gold into US Treasuries could cause a powerful change in the market. Be mindful.

Get Ready for Gold and Silver Christmas Rally


During 18 of the last 22 years, gold has rallied between US Labor Day and Christmas. Will the pattern this year follow the historical pattern? We will analyze the fundamentals, look at some charts and try to draw a conclusion. The charts in this report are courtesy Stockcharts.com unless indicated.

  • First a quote by President Andrew Jackson: "Gentlemen, I have had men watching you for a long time, and I am convinced that you have used the funds of the bank to speculate in breadstuffs of the country. When you won, you divided the profits among yourselves, and when you lost, you charged it to the bank. You tell me that if I take the deposits from the bank and annul its charter, I shall ruin ten thousand families. That may be true, but that is your sin! Should I let you go on, you will ruin fifty thousand families, and that would be my sin! You are a den of vipers and thieves. I intend to rout you out and by the Eternal God, I will rout you out." (Spoken to a delegation of bankers requesting the extension of the 1832 Bank Renewal Act).
Several news items during the past ten days were very bullish for gold. The first was an announcement by the Swiss National Bank that they were planning to buy Euros with Swiss Francs. This action effectively removes the Swiss Franc as a convenient alternative to gold, and it moves the SNB into the camp of the money printers.

The second item concerns an announcement by five major central banks (FED, ECB, SNB, BOJ and BOE), to provide dollar liquidity for a number of European banks that suffer from exposure to Greek banks. This dollar liquidity operation will last until the end of the year and will enable dollar funding for European banks, which were struggling. It shows that the Federal Reserve, the ECB and also British, Swiss and Japanese banks have the will and the ability to cooperate at sensitive times, whenever they feel the system needs a 'nudge'.

Another factor that is very bullish for gold is the current 'negative real interest rate' environment. Regardless of whether we believe the 'official' CPI numbers, or the more realistic numbers provided by Shadowstats.com, anyone with money in the bank, or holding short-term Treasury notes, is losing money to price inflation. 10-year Treasuries are paying a miserly two percent. With inflation at 4.8%, these 'so-called investments' are losing 2.8% of their value over 12 months According to J. M. Keynes, and many other economists, whenever 'real interest rates' turn negative, gold will rise. Keynes called this "Gibson's Paradox", and stated that there are no exceptions.

Finally, the most bullish facilitator of rising gold and silver prices is the supply of money (see chart below).

This chart courtesy Mises.org shows the True Money Supply continues to rise exponentially. A rising money supply is bullish for gold and silver, as it increases the amount of money available for the purchase of precious metals. As long as the Central Banks keep the banking system supplied with money, the banking system will survive. This principle is far more important to the Central Banks than the integrity of the currency. Historically, 'monetary inflation' always causes 'price inflation'. The U.S. consumer-price index (CPI) increased 0.4% in August. That's an annual inflation rate of 4.8%!

The TMS chart also shows that, according to the people as Mises.org, the recession is ongoing (grey area). During recessions, there is less money coming in to government, while expenses such as unemployment benefits, food stamps, welfare payments etc. increase. This in turn causes deficits to rise, and deficits provide energy for gold prices to rise.

Featured is the daily gold chart. Price is carving out a bullish pennant. The supporting indicators are at levels where they have found support many times in the past. The fact that the 50DMA is in positive alignment to the 200DMA (green oval), while both are rising, is bullish. A breakout at the blue arrow will mark the beginning of the next rally.

According to the weekly Kitco survey of gold analysts, a minority 32.1% of the analysts are bullish for this week, 53.6% are bearish and 14.3% neutral. From a contrarian point of view that is bullish for gold!


This chart courtesy Cotpricecharts.com shows commercial traders reduced their 'net short' position to 215,000 from 228,000 last week. The 'up-to-date number' will likely be even lower since the gold price dropped for two days since data for the report was compiled. At 215,000 the commercial traders are at the lowest level since July 8th. On that date gold traded at $1544 and over the next few months price rose up to $1924.

Featured is the GDX gold producers ETF. Price broke out from beneath the 64 resistance level last week (blue arrow), and since then a test of the breakout is the result as the bears press their case. Price appears ready to try again and a close above the green arrow will confirm the breakout and thereby turn the trend bullish. The SIs are positive. The fact that GDX outperformed GLD on Friday is bullish.

Featured is the weekly silver chart. Price is carving out a bullish pennant. The supporting indicators (green lines) are positive with a lot of room on the upside. A breakout at the blue arrow sets up a target at the green arrow. The 50WMA is in positive alignment to the 200WMA (green oval) while both are rising.

The class-action lawsuit against JP Morgan alleging silver price manipulation has exposed several shocking revelations regarding JP Morgan's alleged price suppression of silver- including the PURPOSE of major smash-downs occurring in the hours leading up to options expiration.

The suit alleges that JPM orchestrated monthly options-expiry smash downs with the express intent of blowing up the "delta" risk of holders of short, far-out-of-the money options, suddenly forcing them to cover their positions, thus handing JPM silver futures positions at prices far below market prices only minutes prior.

The suit also alleges that JPM made over 25 massive FAKE TRADES using Saxo Bank during sparse Globex evening hours prior to major silver raids for the express purpose of TELEGRAPHING AN IMPENDING SILVER SMASH TO THEIR BUDDIES!

Summary: Gold and silver are less expensive today than they were in 1980 due to the fact that there is far more paper and digital money in existence today than was the case in 1980. According to the inflation calculator provided at USinflationcalculator.com (using data supplied by the US government), the price of gold would need to rise to $2336, to match the inflation adjusted price of $850 (the 1980 peak). In the case of silver the price would need to rise to $137 to match the inflation adjusted price of $50 (the 1980 peak).

The most bullish fundamental for gold and silver is the fact that there are now 2.5 billion people who were not around in 1980. Most of these people live in China and India. By coincidence these people live in a country where the economy is growing and furthermore they love silver and gold!

Conclusion: Based on the observations presented in this report the expectation is that the annual Christmas rally in gold and silver is 'right on course'.

Gold Forming a Bullish Consolidation


This is an important juncture for Gold and let me say the analysts. We are starting to see some disagreement on Gold and that is natural after a strong surge. It is a small part of the reason why Gold is likely to soon replicate its last move. We believe the market is ready for another big move that could leave many on the sidelines. It is somewhat of a contrarian call. After a 25% surge in less than two months its natural to assume its overbought and a correction is needed but the evidence favors another surge higher.

First, we’ve been talking about an acceleration in Gold for months. It finally happened or is happening. We can see that the market has accelerated past the trendline (and also a longer trendline shown in previous charts). The acceleration is bullish but more important is that the market is holding well above this previous resistance which indicates that the acceleration and not the former trend remains in effect. Secondly, Gold has only retraced (the minimum required) 38% of the move. Third, note that in the past two years Gold bottomed about five times at the 150-day moving average. Most recently it bottomed at the 100-day right before the surge.

The next day or two could be critical as Gold is likely to test the low near $1750. A strong rebound would solidify that bottom and it would ocurr well above the 100-day moving average and well above previous trendline resistance. See the chart below.


Meanwhile the commitment of traders report (COT) is quite encouraging. Over the past two years the commercial short position has ranged from roughly 200K to 300K contracts. As of last Tuesday, the commercial short position was 227K contracts. Now keep in mind this is as of last Tuesday when Gold closed near $1880. In other words, the next reading is likely to be fairly close to 200K contracts. 


Furthermore, the action in the equities has also been encouraging. The mining equities have held up quite well during this period of weakness in the metals. This includes Thursday’s action. Gold closed down 1.7% yet GDX and GDXJ closed down fractionally while forming a bullish reversal pattern. Silver closed down 2% while SIL closed down only 0.8% and also formed a bullish hammer. Moreover, a handful of our favorite silver companies are trading near April high while Silver is more than 20% off its April high.

There you have it. Emotion may tell us to worry, be cautious and expect more weakness and a prolonged consolidation. It could happen. I am in the business of managing risk and assessing probabilities. The evidence says otherwise. And by the way, the equities are already showing relative strength. Couple that with a big move higher in Gold and we could see a very strong move the next few months.

See the original article >>

Follow Us