Showing posts with label silver. Show all posts

Saturday, September 24, 2011

Why did Gold and Silver Plunge? No, It's Not CME Margin Hikes; What will the Fed do Next?

by Mike Shedlock

Many people have asked me to comment on the plunge in gold and silver. First let's take a look at the wrong answer: Case Closed: CME Hikes Gold, Silver, Copper Margins
And there you have it: CME just hiked gold margins by 21%, silver by 16% and copper by 18%. Mystery solved.
Sorry Tyler, wrong answer.

Four Reasons for Metals Plunge

  1. Fed did far less than expected
  2. Mutual fund redemptions
  3. Margin calls at hedge funds
  4. China growth story fading

1. Fed Did Far Less than Expected

The Fed did not do what everyone thought, which is to say something far more than "Operation Twist".

As noted in advance, I explained why the Fed wouldn't do more than Operation Twist, in Six Things the Fed May Announce Tomorrow (But Likely Won't); Would Any of Them Matter? Gaming the Reaction.

In short, the Fed did not print, or even threaten to print. Moreover the Fed committed to a strategy not through the end of this year, but all the way through June of 2012. Perhaps the Fed does more in the interim, perhaps not.

For those expecting drama, the Fed's non-action was decidedly bearish for commodities in general, even gold.

2. Mutual Fund Redemptions

Mutual fund cash levels are at or near record lows. In general, mutual funds were not prepared for the market selloff and sell orders came in. Rather than sell garbage like Bank of America at $6, mutual funds unloaded stuff like gold, taking profits.

3. Margin Calls at Hedge Funds

Hedge funds unloaded gold and silver for the same reasons as mutual funds, but also because they mistimed the play and what Bernanke would do. Leverage works both ways.

4. China Growth Story Fading

Commodities in general have been clobbered along with currencies of commodity producing countries because the global economy is slowing rapidly.

As in 2008 there will be no decoupling. China is not a growth engine in any real sense of the word. Instead, China desperately needs demand from the US and Europe. Moreover, China is overheating and has a huge property bubble to boot, at precisely the wrong time. Commodities were set to plunge on the China story alone.

Metals Volatility

In the wake of increased volatility related to the above, the CME hiked margins. That likely added to the volatility but was not a fundamental "cause" of the plunge in precious metals.

What will the Fed do Next?

"Bay of Pigs" asks ...

Mish, Any thoughts on what the FED will do next? I doubt they sit there and do nothing.

Thanks Bay. That was a good question. This is why:

1. It is a single question, not five questions
2. It is a question on topic
3. It is a question I have not explained 10 times already
4. It is macro-based, not stock specific
5. It seeks an honest opinion rather than asking for something that may take hours of research


Problems for Bernanke

Market expectations were clearly for the Fed to do more. Goldman Sachs was shocked at the market reaction, I was not. See Goldman Surprised by Reaction to "Operation Twist" for details.

The problem for Bernanke is every action he may take now has serious negative ramifications. Fort example, take Operation Twist: The flattening of the yield curve may (I doubt it) help mortgages by lowering mortgage rates. However, the flattening of the yield curve will without a doubt hurt banks struggling to make profits on spreads.

The flattening of the yield curve also hurts those on fixed income as well as pension plans with 8.5% or so yield assumptions. The irony is pension plans might have gotten big returns had they been in treasuries, but they weren't because treasury yields were "too low".

Instead, pension plans all plowed into foreign bonds, commodities, currencies, and global equities to make their 8.5% assumptions.

So what is Bernanke to do?

See Bernanke, a Complete Dunce, "Puzzled by Weak Consumer Spending" for more on how the self-proclaimed student of the great depression is clueless about the current depression.

Bottom line: The Fed is more or less out of bullets. Moreover, Bernanke admitted he does not know why his policies are not working even though it is perfectly obvious.

When backed in a corner, Bernanke may conceivably try nearly anything. However, Bernanke is just not that desperate yet. Right now, European banks are at far greater risk than US banks so Bernanke may easily bide his time.

Silver Daily Chart

Silver, once again, is acting more like a leveraged commodities plaything than a currency.


I traded all my silver for gold on April 27, as noted in Taking Silver Profits - Swapping Silver for Gold.

Gold is still higher than my swap point.

At the time, I commented "I believe the price of silver is highly likely to revisit the low $20's at some point. Thus, I see no point in chasing silver higher here. Moreover, except for pure speculation, I see little reason to even hold silver in this spike."

I really do not know if silver hits the low 20's or not, but I was not tempted by that previous decline to near $32. Had I bought it there, I made a mental sell at $40. Silver got all the way to $44 and to be honest I was wondering if it would take out my swap point.

Silver breached $30 today.

As I have commented many times, silver is a far riskier play than gold. I believe this volatility proves my point.

CME margin hikes are not a cause of 40% collapse in silver from the top.

No Hiding Places

On September 19th I wrote No Hiding Spots Except Despised US Dollar: Equities Red, Metals Red, Energy Red, Grains Red
No Hiding Spots Except Despised US Dollar

If you have not done so already done so, please consider the possibility there will be no hiding spots except for US dollars and short-term US treasuries (yielding nothing) in a renewed strong downturn.

I expect gold to hold up in a major decline, but I could easily be wrong. One encouraging sign is the $HUI gold miner index is down less than a percent even though gold is down by 2% and the S&P and Dow are down by almost 2% as well.
Short-term, I have been wrong about gold holding up. Then again, I really do not concern myself with short-term action. Moreover, gold is higher than it was the day I swapped it. The equity markets in general sure are not.

Bernanke Will React

It's a safe bet Bernanke will react, we just do not know when. Things may (or may not) get ugly for miners (especially silver) in the meantime.

Those with cash, should be rooting for a selloff in gold and miners. In the meantime, hold a core position in gold. Take profits on big spikes and buy big dips.

At some point that advice will stop working, I just do not think this is the time.

Gold and Silver collapse as the crowd rushes to the Exit

by the trader

It never is different, especially when the crowd does the same thing….Silver and Gold collapse. We are awaiting the first casualties after these moves.

See the original article >>

Friday, September 23, 2011

Risk Off as markets collapse on European Fear


As Europe collapses, without Panic (this is disturbing), under the HFT Regime no volume melt down, other asset classes are joining the Implosion. Markets are moving on light volume, driven by fear, as now every pundit sees Europe on the verge of a collapse. Maybe it is time to start buying small? Note, Stoxx 50 was up 70% from bottom to top, and has now retraced some 36% from the highs, set onkly a few months ago. Majority of investors are now down big time, as the group didn’t buy the bottom…


Monday, September 19, 2011

Imminent Silver Price Crash to Devastate Longs


Silver has fallen back over the past week as expected, and although its uptrend from late June has now failed, which is viewed as significant, it managed to hold up above nearby support which may generate a bounce early next week. However, this should not be a cause for celebration by silver longs, as overall the picture for silver continues to look precarious in the extreme. We can see why on the year-to-date chart below, which shows that silver appears to be completing the B-wave of a large 3-wave A-B-C decline, the 3rd wave of which, believed to be imminent, is likely to be really severe and will devastate silver longs. 


On its 6-year chart silver looks like it is completing a classic large top formation. First it rose vertically to hit its most overbought levels late in April since the good old days of the Hunt brothers back in 1980. Then a panic selloff hit, triggered ostensibly by hiked margin requirements (of course, its being insanely overbought had nothing to do with it), all of which was accompanied by the huge volume characteristic of a top. Lastly, the johnny-come-latelies are corralled into silver by proliferating cheerleaders to drive the weak rally back towards the highs that we have seen over the past couple of months. There is just one instalment left to go, the drop down to the support shown at the lower boundary of the top area, the failure of that support, and the final devastating plunge that leaves hordes of silver speculators hung up in the large top area and smarting from massive losses. clivemaund.com subscribers are prepared for this with our Complete Toolbox for Capitalizing on a Gold & Silver Plunge. 

The likely reason for a severe decline in silver, and in commodities generally, and a heavy correction in gold, which is another deflationary downwave that has been signaled by the dollar breakout, is discussed in more detail in the Gold Market update.

The latest silver COT, shown below, looks quite bearish with a quite high Commercial short and Small Spec long position. In comparison, the gold COT looks considerably more positive. 


Sunday, September 11, 2011

Gold and Silver Final Parabolic Upswing? Comparison of Two Bull Markets


In a nutshell, this week we decided to provide you with the analysis of the previous bull market in the precious metals. The goal is to see how the current bull market compares with the previous one. After all, since history rhymes, looking at the analogy should provide us with clues as to what can happen next. In particular, we will be able to estimate if we’re currently on a verge of the final parabolic upswing and if this bull market is likely to end soon.


The above chart presents the DJIA:Gold ratio in two time spans: 1950-85 (red line) and 1999-2011 (golden line). The 1999-2011 has been superimposed on the older data. The chart points to the fact that in the period between 1965 and 1975 the ratio had been falling roughly in the same way it did between 1999 and 2011. We live in a globalized world, so looking at gold’s price relative to stocks might be more appropriate for long-term tendencies than a look at the gold price itself, simply because the major shift in investor’s sentiment happens when investors prefer gold to the most popular investment class – stocks.

The methodology here is, therefore, to compare the decline in the DJIA:Gold ratio around the 70’s bull market and compare it to the decline seen in the more recent years. Things to look at include the size of the decline, the time it took before the decline ended and the overall shape of the downswing.

As far as the size of the decline is concerned – in both: time and range – the slide seems far from being over – which means that the bull market in the precious metals is likely to continue. The analysis of shape confirms that both bull markets are indeed similar. However, the most interesting implication is based on the late 1974 rally in the ratio.

As we see that 1974 and 1975 marked a significant trend reversal, we might expect a similar move to happen in the near future. This would imply a significant correction in the precious metals sector and possible rallies in the general stock market before the precious metals sector regains its strength and continues moving up.

Clearly, this is not the time to stop paying attention to warning signs about a possible decline in the precious metals. Let’s take a look at the gold chart.


In the chart above, you see the price path of gold in the years 1999-2011 (golden line) superimposed over gold’s price path between 1950 and 1985 (red line). The vertical axis represents the older data while the values of the recent data have been rescaled to properly reflect the corresponding price changes. After a short comparison you might notice that today gold seems to be in a similar situation to where it was in 1975. This would suggest that we are in for a significant correction in the precious metals sector before the bull market resumes. It would also imply that any correction seen in the following month would not end the current bull.


The above chart is similar to the previous one, except for the fact that it presents silver, not gold. Once again, the current bull (green line) has been superimposed over the price path between 1950 and 1985. Even though the price paths here are less similar than in previous cases, they still point to the fact that the silver rally might be followed by a substantial short-term correction or at least by a sideway trend. Just as in the previous cases, this should not be perceived as the end of the current bull.

Summing up, there will be a time gold and silver move straight up without any corrections, but analysis of the previous bull market suggests that this moment is still years from today. Moreover, this is not the time to stop paying attention to signals indicating a significant correction around the corner. Finally, this is not the time to stop trading the precious metals market (in general).

To make sure that you are notified once the new features are implemented, and get immediate access to my free thoughts on the market, including information not available publicly, we urge you to sign up for our free e-mail list. Gold & Silver Investors should definitely join us today and additionally get free, 7-day access to the Premium Sections on our website, including valuable tools and unique charts. It's free and you may unsubscribe at any time.

See the original article >>

Friday, August 19, 2011

ChartMatters: Dollar, Gold and Silver


Here now is a fresh look and the world's reserve currency and the two metals, starting with a 20-year timeline for the Dollar and Gold. Since late April, the Dollar has been in a narrow range with yesterday's close down 0.2% from our last inspection. Gold, in contrast, has risen 18.59%.
Click to View

What about Silver? It has been more volatile than Gold, but over the same timeframe, it has a nearly identical gain of 18.11%.
Click to View

The next chart starts the timeline in 1980, the earliest date my source, Stockchart.com, supplies data. Gold and Silver data are available across the complete timeline, but the Dollar tracking begins in mid-1983.

Click to View

By starting in 1980, we see the downside of the historic bubble in Silver that peaked on Silver Thursday, March 27, 1980.
Click to View
Source: www.RealTerm.de via Wikipedia


The circumstances surrounding the 1980 Silver Bubble, nicely summarized in this Investopedia article, were unique in modern history. In nominal terms, Silver is back in the territory of the 1980 bubble, but in real terms, and in light of the global financial distress, precious metals will doubtless remain attractive to many investors.

What about the Dollar? As of yesterday's close, the Dollar is down 55% from its 1985 peak. I won't hazard a forecast as to where it's headed, but I wouldn't be surprised to see the range of the past two years set the boundaries for the next several months.

See the original article >>

Thursday, August 11, 2011

Silver May be About to Move


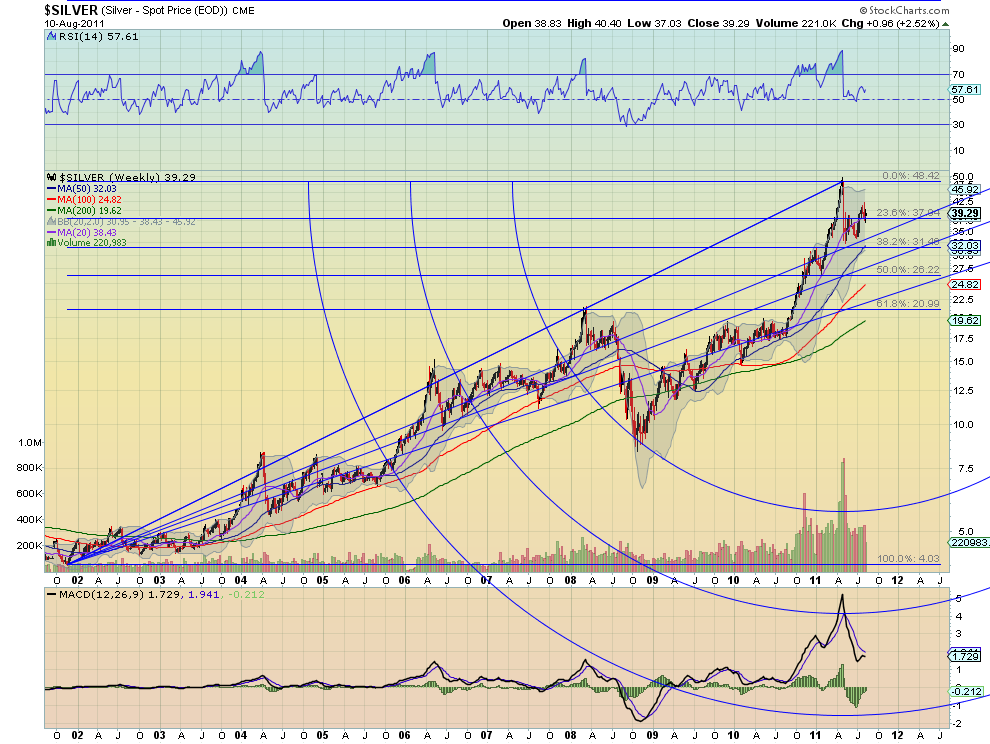
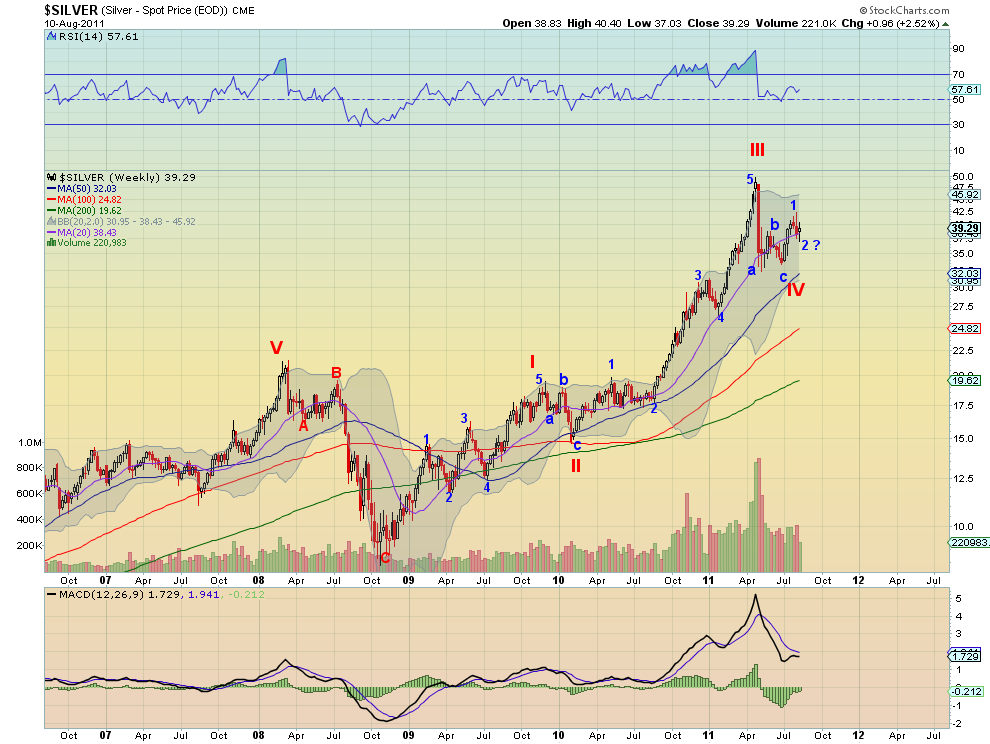
Gold has been flying on the global crisis in the markets. Moving over $200/oz in just a few days. But Silver ($SI_F) has not had the same positive performance. They do not always move together but a large move by one often trigger the other to move to get the ratio back to a reasonable level. And the charts for Silver look ready to make that move. Start with the weekly Fibonacci chart below.

Support has held at the 23.6% fall back level at 37.94 well and is moving towards 40 again, with series of higher lows and higher highs. Positive on this view. And viewing the Elliott Wave chart below that Silver may be completing wave 2 within the wave V move higher. If wave 2 is in

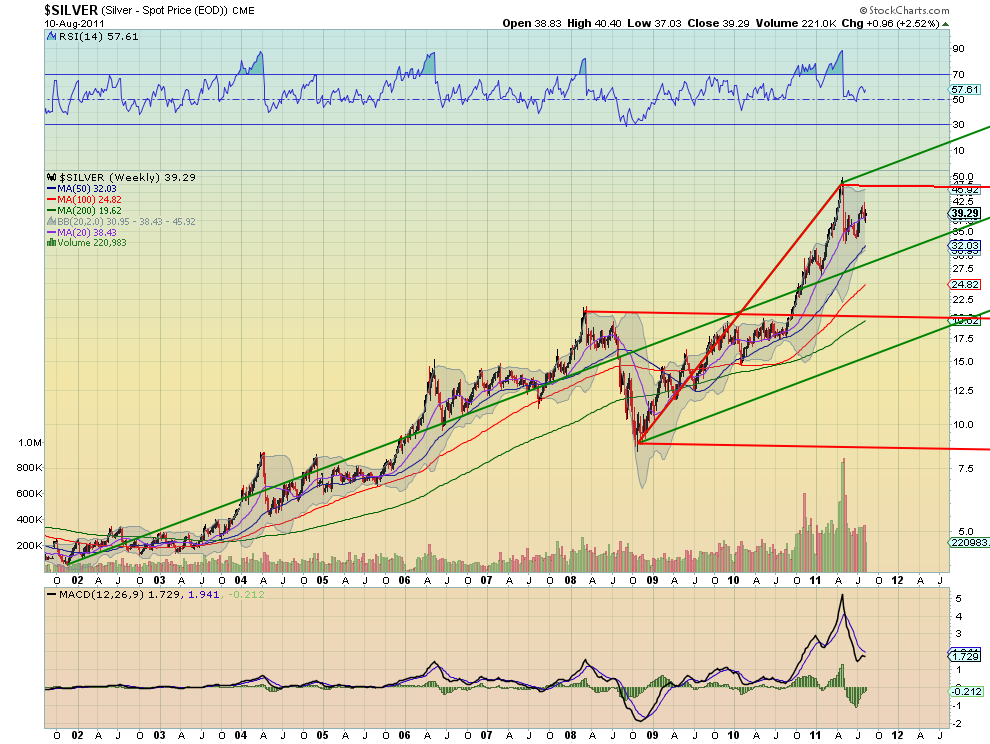
then it is in for a ride higher. And the Andrew’s Pitchfork analysis shows this may be the case as well. Notice that it is heading higher to the Upper Median line of the bearish Pitchfork near 46 and then there is the Upper Median Line of the bullish Pitchfork over 50 above that. This does not guarantee a move higher, but it looks like the final print on these weekly charts can give us the final word. Be prepared.


Friday, July 29, 2011

Silver Lining: Debt Ceiling & Quant Easing


As risk currencies become quickly overcrowded and range-bound equity indices remain the territory of traders rather than investors, silver once again appears as the notable gainer, characterised by richly similar fundamentals to gold. The only thing is that silver is trading 20% below its record high.

Here are 3 general reasons to our renewed preference for silver.

Inter-metal dynamics

Gold has always preceded silver in hitting new record highs (due to liquidity & popularity of investing options to the public), but silvers subsequent catch-up has rendered this pattern an attractive investment reality. This has especially been the case since summer 2010. It is important to remember the main reason to silvers severe underperformance relative to gold in April/May was artificial interference (exchanges quadrupled he margin requirements).

The fact that silver is 20% below its high despite improving metals fundamentals presents a notable opportunity for silver. The chart below (right) shows how the Gold/Silver ratio has resumed its decline, which is the case each time metals rise in concert.


Fundamental

The fundamental arguments to rising metals have changed little since the record-breaking days of March-April 2011. In fact, if anything, they have improved.

i) Regardless of the nature of any solution to the US debt ceiling problem, debt monetization and printing fresh paper by the US Treasury is here to stay. Meanwhile, the probability of a downgrade in the US credit rating has risen from zero, one year ago to 50-50% today according to S&P. This rapidly-changing landscape

ii) Combining the above with the broadening reality that US short term interest rates shall remain at zero until at least end of 2012 and QE3 is an impending likelihood, the substitute nature of metals to interest-rate bearing assets (money) shall continue to prevail in value.

iii) Europe may be free of bipartisan resistance to debt negotiations (as in the case in US partisan politics) but the tripartite lifelines remain short-term in nature as long as sluggish growth is unable to bring down the debt/GDP ratio.

Technical

The most striking technical argument to rising silver is the technical similarity between the current rebound and that of the February rebound (which led to new highs). Looking at weekly stochastics (momentum-related indicator) by using various speeds, we see the patterns are almost identical across different measures. This adds to the argument that the current price rebound carries sufficient follow-up momentum to lift it back towards the high $40s, at which point will draw retail interest back into the spring highs.

Click on Charts to Enlarge

The other key technical development is silver's monthly chart, showing a rare bullish engulfing July candle, defined when the bar "wraps" around the prior month's bar, paving the way for prolonged gains. Expecting $47 /oz in August. The $50 record is seen before end of Q3.

See the original article >>

Thursday, July 28, 2011

A new bottom may be emerging for silver in upper $30 level

By Dr Jeffrey Lewis

The commitment of traders is released each Friday by the futures market regulator, the CTFC. Whereas there are plenty of concerns with the CTFC’s involvement in the futures market, generally the COT data proves to be a very important tool in understanding market highs and lows.

The real function of the futures market, outside of finance, is to allow buyers and sellers to exchange fungible products (commodities) on a central exchange. Buyers and sellers can also hedge their future purchases, thus keeping the namesake of the futures market.

COT Momentum

In each release, there are three types of traders listed. These are commercial traders, noncommercial speculators, and the non-reportables, which are too small to meet regulatory expectations.

As Silver buyers, we should focus on the commercial traders and noncommercial speculators. Commercial traders are generally those who use silver in their business. An example of a commercial trader would be a silver miner, which produces silver for sale on the open market, or a jeweler who purchases large amounts of silver for making jewelry.

(Of course, somehow, and at some point, the bullion banks entered the ‘commercial space’ – where they now currently maintain a very concentrated (relative to any other market) short position).

Then we have the noncommercial speculators, which (should) comprise large investment (bullion) banks, but do include investment management firms, and occasionally an individual investor with a larger than average bankroll. These buyers and sellers are in the market for purposes of speculation, and they do not directly interface with silver in their daily operations. They buy to resell, or they sell early (sell short) to rebuy at a lower price – often using sophisticated computer programs or trading strategies based on algorithms.

Market Mechanics

Ideally, the silver market is one where buyers and sellers can meet for future sales of a commodity. It is also a market where companies can hedge their future costs. Silver is deliverable in physical form, though market players can sell their futures before delivery day to others who will make claim on the silver, allowing for possibilities in paper profits.

In other markets, commercial traders tend to be the most accurate in predicting the market’s future direction because they are, at the end of the day, the entities that produce the commodity itself, or use it in the production of an end-user good. Commercial entities tend to pick tops and bottoms with excellence.

Normally, when the commercial column increases its long positions while speculative interest is increasing shorts, the market tends to cool. When commercials increase their shorts while speculators cut back on long positions, a market top tends to follow.

This is a natural trend that appears when you have commodity producers, who can greatly affect a commodity’s supply, and speculators in the same market. We can also observe that commercial interest is demonstrably more bearish at market tops, and bullish at market bottoms.

This question is this:

With the silver market, if the bullion banks were not active (short) participants in the commercial category, with investment and industrial demand for silver increasing and competing for an ever diminishing supply, where do you imagine the price would be – or who would or could afford to be short?

Of course, the other burning question is when will the bullion banks exit their (commercial-selling) position?

There are two layers in a normal futures market, one which makes the noise (non-commercial speculators) and one which drives the market (commercial traders.) Off the peak formed in spring 2011, the net commercial short position in silver has declined, and the price has risen accordingly.

A new bottom in the upper $30s is forming for silver.

See the original article >>

Saturday, July 23, 2011

GLD and SLV: When and Where to Buy


Expect short-term pullbacks in these precious metals ETFs to set up good buying opportunities in the week ahead. Here are the key price levels to watch for each fund.

Monday’s close above $1600 in the August gold futures contract got the attention of many investors and traders, but instead of reacting bullishly, there were quite a few who were taking profits on some of their positions.

Even more surprising was that some were even looking to trade the expected pullback while remaining bullish for the long term. Apparently, some think the recent surge was a blow-off top, but technically, the charts suggest that we just resolved the flag formation, which is a classic continuation pattern.
Experienced traders also know that trading against the major trend has wiped out its fair share of trading accounts.

The volume analysis supports this viewpoint, as it confirmed the recent breakout and the weekly on-balance volume (OBV) has continued to make new highs with prices. This has clearly been a year for sticking with the weekly trend analysis, as the short-term swings have been difficult to trade. For example, on July 1, the SPDR Gold Trust (GLD) gapped down to support, and then on July 5, after the holiday weekend, gapped higher, marking the start of the recent rally.

Certainly, if your long position is too large to let you sleep at night, reducing it when prices are rising is a good idea. Otherwise, do not try to time your core positions while the monthly and weekly analysis remains positive.

My short-term analysis for gold does suggest a pullback that could carry into next week, and John Person, an expert in seasonal commodity trends, tells me that gold typically bottoms in late July or early August. Therefore, traders or those not long GLD could get a good entry point next week, and the hourly Starc bands may help in identifying that entry point.
chart
Click to Enlarge

Chart Analysis: The daily chart of the SPDR Gold Trust (GLD) shows the completion of the flag formation, lines a and b, as the daily Starc+ bands were tested for several days last week. The weekly Starc+ band is currently at $158.50 with upside targets from the flag formation in the $160-$162 area.
  • I have also plotted the Fibonacci arcs on the chart to give a time perspective. The initial arc is currently at $152 along with the 20-day exponential moving average (EMA) and the Starc- band
  • The former resistance, line a, which is now support, and the 50% arc line will be in the $150.70 area by early next week with the final arc in the $149.50 area by the end of he week
  • The on-balance volume broke through its resistance, line c, with prices. It is still holding well above its rising weighted moving average (WMA). The weekly OBV (not shown) did make new highs last week and is also positive
The hourly chart for GLD allows us to zero in on the key support levels to watch. There is initial support on the hourly chart at $153.70 with the trend line breakout level at $152-$152.50.
  • The 38.2% support level is at $151.80 with the 50% support at $150.30. The key 61.8% support is at $148.80, which I doubt will be tested
  • On the bottom of the chart, I have plotted one of my favorite momentum studies, the RSI3, which is a three-period moving average (MA) of a five-period relative strength index (RSI)
  • The horizontal lines note that the highs and lows in the RSI3 correspond nicely with prices, reaching either the Starc+ or Starc- bands on the hourly chart
  • For example, on July 18, GLD hit its high of $156.58 between 11:30 am and 12:30 pm when the hourly Starc+ band was being tested. The RSI3 peaked that hour at 87 and then declined to 83 the following hour
  • On Tuesday (July 19), GLD closed on the Starc- band with the RSI3 oversold at 20
  • The hourly chart has initial resistance now at $156.04, and if this level is exceeded, it will suggest the correction is already over
chart
Click to Enlarge

The iShares Silver Trust (SLV) rallied close to the 50% retracement resistance at $40.10. The daily Starc+ band is at $40.70 with the 61.8% retracement resistance at $42.05.
  • The daily OBV did break out through resistance, line b, along with prices. The weekly OBV has turned up but is still below its weighted moving average
  • There is next support on the daily chart at $36.50-$37, which corresponds to the 20-day EMA and the former resistance, line a
  • There is additional support and the daily Starc- band in the $36 area. Key support is now at $34
  • From a Fibonacci time analysis standpoint, the correction should be over by the middle of next week
The hourly chart of SLV is set up the same way as the hourly GLD chart. The 38.2% support level is at $36.90 with additional chart support at $36.70, line c.
  • The 50% retracement support is at $36.10 with the 61.8% support at $35.30
  • The correlations between the tests of the Starc bands and the RSI3 have also been highlighted on the chart
  • The RSI3 is trying to turn up after Thursday’s close and is well below overbought levels
What It Means: The technical outlook for the SPDR Gold Trust (GLD) is much more positive than that of the iShares Silver Trust (SLV), where the weekly analysis is still negative after silver’s May plunge. A pullback in GLD going into the middle of next week should set the stage for a move to further all-time highs.

How to Profit: For GLD, go 50% long at $152.34 and 50% long at $151.46 with a stop at $147.47 (risk of approx. 3.1%). Sell half the position at $159.76 and raise the stop to $151.84 on the remaining position. Of course, it is possible that we will not get such a deep correction before the uptrend resumes.

I have no formal recommendation for SLV at this time, but traders could look for a decline into the $35.50-$36.90 area to buy, using a stop under $34.

Gold and Silver Bull Market 'Topped'?


With the silver price riveted to the gold price, what happens to gold, applies to silver.
Many believe we are at the point where the rising gold market has entered a 'bubble' and is losing momentum just ahead of the 'bear' phase. With record prices of $1,610 and €1,136 seen in the midst of debt crises on both sides of the Atlantic, things surely must get better and gold and silver prices must fall...

After all, all markets go through bull and bear phases. What goes up must come down.
It is this implication that is lodged deep in investor's minds, particularly in the developed world. It seems to be the case going right back to the 1800's when what we know as 'markets' in the financial world really developed. Most markets have gone through these two phases more than once. Why are they given these titles? A 'bull' market is called such because when a bull attacks he throws his head upwards catching his victim on his horns and tossing it. It's called a 'bear' market because when a bear attacks he claws his victim in a downward thrust. We look at whether the gold market is open to these phases to find the answer to our question.

Money or Commodity

If gold is a commodity then it rises and falls as a result of the ebb-and-flow of the economies that use it. If so, it will move in synch with the financial markets cycles and remain subject to their dominance. But when it comes to gold and silver, nothing is that simple!

If the bulk of the demand for a commodity is contracted to buyers, then the only influence these contracts have on the price of the commodity is through the referencing of that supply to the market price. The supply of the metal in the open market outside of contracted amounts is the quantity of that metal that determines the price of the metal. Call it the 'marginal' demand or supply. This supply is sent to the open market for buying by non-contracted buyers. It could be just to top up for unforeseen demand, or it could be to sell overbought amounts. This determines the liquidity of the market. On top of that, speculators frequently enter the market taking a view on demand and supply expectations, taking off supplies to force prices higher or introducing them, to force prices lower. In a pure commodity market, these views are based on industrial demand/supply expectations.

But gold is not so simple or predictable. Most buyers of gold do not buy gold for its industrial use. Where it is used in industry it is done so for hi-tech purposes, which is relatively price-insensitive. So the price of gold has little bearing on the demand from industry.

Gold is used to decorate people in its Western jewelry application. There is little sense of showing off the extent of your wealth when wearing gold in the West. Additions of jewels and artistic presentations add so much to the cost of such jewelry that the price of gold in such jewelry is a minor factor. This type of jewelry demand does fluctuate with the state of an economy, but such demand is a small component of the gold market. In the past it has been an influential one, particularly before the eastern markets 'emerged'. Add to this the determination of the jewelry trade to extend the buying of gold down to poorer people's levels by lowering the purity of the gold sold. This increased the vulnerability of the gold price to the state of the developed world economies. Such demand became the 'swing' factor in the gold price.

This too was at a time when central banks were not only out of the gold markets but encouraging a heavy increase in supply. As a result, analyst's studies placed great emphasis on western jewelry demand.

Then at the turn of the century, the gold market changed its shape. Asian markets 'emerged'. The driving force behind their buying was totally different to western attitudes. They followed the maxim, "One buys gold, not to make money, but because one has money." The gold bought was nearly pure. It was bought because it was treated as money and money of a higher quality than currencies. When used in jewelry, it was a statement of the financial security of the wearer. Nothing could be more different than the Western view of jewelry. Central banks changed their attitudes to holding and selling gold then too.

These structural changes altered the dynamics of the gold markets. Over time, investment demand grew to become by far the greatest source of demand for gold. In addition, central bank-inspired supplies (through their encouragement of increased supplies) stopped and gold producers became a source of demand. This happened for a while as they bought back previously sold gold. Central banks cut back on their supplies to the market until they stopped selling and other central banks began buying.

But more was changing in the gold markets. As the ability of currencies to give an accurate measure of monetary values decayed, gold began to fill the hole they left. This aspect of value grew to the point that the head of the World Bank suggested that gold be used as a reference for value measurement. The concept has taken hold again, but as a banker, Mr. Zoellick has remained silent since then. His silence, while deafening, has reaffirmed gold's inherent value. After all, as Alan Greenspan, the most famous Fed Chairman said, 'Gold is money in extreme times'.

Its monetary value lies in its remarkable quality of being both an asset and liquid cash, globally and in all circumstances. Currencies can't be this. They remain the obligations of one nation or another, dependent entirely on the reputation of the nation printing them. Gold is considered money, without the strings that are attached to national money. Investors from central bankers to Indian or Chinese rural farmers believe that gold is a counter to unbacked currencies issued, at will, by national governments all over the world.
Gold has no nation. It carries nobody's obligations. It's what enemies will accept from each other.
The concept of consuming gold is no longer a part of this gold world. These structural changes cut gold off from being just a commodity.
Gold is not a commodity!

Gold Bear Market in the 80's

When Mr. Volker capped inflation in the 1980's by whipping U.S. interest rates up to the mid 20% area, inflation was stopped dead in its tracks. The U.S. economy was vibrant and capable of handling such a financial wrench. At the same time, after a decade-long battle to stop people in the developed world from believing in gold as the only money, the supply of gold was turned on by central banks.

Limited sales from the States and the I.M.F. were followed by limited sales of gold from European central banks. But the key accelerant to the supply of gold to the market was the rapid acceleration in the supply of gold. This way achieved by the provision of gold loans to mining companies against their future production of gold. Mining companies were then able to sell the borrowed gold forward in the market, delivering up to 5 years ahead and earning, not just the gold price (it started to fall heavily from the $850 peak down to $255 at its lowest point) but the interest due to the seller on forward sales to the final delivery date (i.e. the contango). The bulk of the already discovered and easily mined gold in the world was produced, with central banks being repaid their gold once all these new mining operations could deliver the gold to them from their own production.

The gold markets were swamped with an oversupply of gold while developed world central banks encouraged the perception that they were about to sell their own gold reserves shortly. This bred the perception that there was a 34,000 tonnes gold overhang threatening the gold price. Was that a 'bear' market? Technically, yes - just as the Hunt Brother's attempts to corner the silver market by taking the silver price up to $50 was a 'bull' market. The central bank's campaign to swamp the gold market with new supplies of gold over the fifteen to twenty years that the gold price fell to less than a third of its price proved successful.
But it was not a 'bear' market in the way we normally understand it! It was manipulation, pure and simple.

Gold and Silver Psychological Barrier Reached, Where Precious Metals Sector Headed Next?


Being technical analysts is one of our professions, so it is quite rarely when we feel any emotions regarding the market regardless if we’re making substantial gains or if we’re on the losing side. But, off the record, we will admit to a slight twinge of a thrill when gold broke the psychological barrier of $1,600 an ounce this Monday.

Putting aside the discussion on whether a breakout is likely to happen or not, it’s a great feeling having a front-row seat to the greatest investment show in town. And the best part is that it’s still Off Broadway and the crowds haven’t yet discovered it, so there is still time to get good seats.

How many of you remember the feeling when gold broke above $400 in December of 2003? Perhaps not all of you were in the gold trade at that time. So, let’s jump forward to March 13th, 2008 when the benchmark gold contract traded over $1,000 for the first time in the U.S. futures market. The $1,000 mark—that was a big one!

We remember other landmarks on gold’s upward journey. On December 1, 2009 - Gold climbs above $1,200 an ounce for the first time as the dollar dropped. On September 27 of that year, spot gold prices vaulted to the $1,300 an ounce mark. Just two months later, on November 8, gold prices broke through the $1,400 an ounce mark as haven buying prompted by renewed budget problems in Ireland more than offset a sharp dollar bounce. It wasn’t so long ago that gold shot up above $1,500 an ounce on April 20th of this year as worries over the health of the global economy boosted the metal as a safe haven. And that brings us back to that lovely round number, $1600, achieved this week.

With the psychological barrier touched, it seems that this week the most important part of the analysis will come from the precious metals themselves. So, let’s take a look at the yellow metal (charts courtesy by http://stockcharts.com).


In this week’s very-long-term chart for gold, we barely see any changes. Gold has moved right to the resistance level created by extrapolating previous tops and bottoms. As we stated in our previous essay on the gold correction:

In very long-term chart for gold, we see a third attempt to move above the long-term rising trend channel. In late 2010, a similar attempt was unsuccessful and was followed by a significant decline. Certainly this could be the case this time as well. Naturally, we could see a true breakout, however so far it has not been confirmed yet, so we remain skeptical.

The current momentum, which gold has shown at the first sight seems to make the breakout theory quite probable (rallying on strong volume is bullish phenomenon), however, even gold is to rally strongly from here, a correction will likely be seen before additional significant upward movement starts. Please note that there is a strong resistance level created by extrapolating previous tops and bottoms and using the Phi #1.618. This is just above $1,600.

If gold can move above this level and confirm its move, the next target would be well above current prices. This would be quite a rally from here, but such a move does not seem very likely over the next few months – at least not yet.

This week we did see prices reverse slightly and they are now consolidating. No breakout has yet been seen and our previous comments remain up-to-date. The situation continues to be quite similar to what we saw late last year (triple top) and it is clear that the consolidation at that time was quickly followed by a decline.

There was not breakout in gold stocks either.


In this week’s HUI Index chart, little has changed and the chart is basically the same as what we presented to you last week. We continue to see a sell signal from the RSI level and the index level is at a noteworthy resistance line. No significant decline has been seen yet but it does appear to be quite likely in the near future.


In this week’s short-term GDX ETF (another proxy for the mining stocks) chart, we see more of the same, although the situation is a bit more bullish here. A recent consolidation resulted in a bit higher mining stocks’ prices than it was the case with the underlying metals.

Thursday’s decline was less significant here than were the declines for gold. The volume action seen was not too bullish however. The price decline on Thursday was accompanied by higher volume than was seen in Wednesday’s rally. It is possible that the sign of strength seen here is at least partly attributable to the recent rally in the general stock market.

Summing up, the situation for the precious metals market appears very bullish at the first sight, but taking a second look reveals that the true breakout remains to be seen.

Thursday, July 21, 2011

The Global Physical Gold & Silver Reserves Race is the New Nuclear Arms Race


The USA-USSR nuclear arms race has been replaced by the East-West battle to accumulate physical gold and physical silver reserves. While Western Central Banks and their puppet bullion banks have distracted and goaded private citizens with the invention of fraudulent bogus paper gold and paper silver derivative products, including ETFs more recently, and paper futures contracts for a much longer period of time, they themselves have been making sure to avoid the very fraudulent paper products they have invented and have been diving headfirst into real physical precious metals.

As Central Banks continue to significantly devalue all major global currencies through excessive creation of new supply out of thin air in a digital world where “new money” is never even printed into paper/cotton form but only is created as digital bytes that are sent across international borders, the private families that are the majority shareholders in the world’s most powerful Central Banks have engaged in heavy buying of physical gold in particular, and to a lesser degree, physical silver. In 2010, Central Banks as a group, became net buyers of physical gold after two decades as net sellers. EU Central Bankers became net buyers of physical gold for the first time during the 1st Quarter 2011 since their introduction of the heavily flawed Euro into circulation in January of 2002.

As of April 2011, China was, according to “officially reported” statistics, the sixth-largest official holder of gold, with 1,054.1 tonness, according to World Gold Council estimates. The U.S. was still reported to possess the largest gold reserves at 8,133.5 tonnes. However, all of you know by now that I believe all “officially reported” statistics, whether the statistic is GDP, unemployment, inflation, or gold reserves, to be a charade and mockery of the truth. To this day I am highly skeptical of the US reported reserves of 8,133.5 tonnes, especially since these reserves have neither been independently audited nor independently tested to ensure that they meet good-for-delivery bar status since Dwight D. Eisenhower was the US President in the 1950s. As for China’s “officially reported” holdings of only 1,054.1 tonnes, anyone that takes these reported stats at face value as the truth is a fool for any number of logical reasons. One, China reported that its “official” gold holdings were a constant 600 tonnes from 2003 to 2009 and then reported that it had increased its holdings to more than 1,000 tonnes overnight in 2009. Since China lied about its gold reserve holdings for more than 6 years, one cannot and should not assume that their “officially” announced 1,054.1 tonne level was truthful. Since China made that announcement in 2009, their “official” gold reserve level has not increased at all.

Anyone that believes that China has not accumulated more gold, and lots of it, since that time, does not understand the Chinese government and Chinese bankers. Chinese bankers have been studying the best ways to invest in gold and silver for many years now in preparation for this global monetary war and they realize that one of the best ways to invest in PMs is to own the real thing. Furthermore, there are multiple mechanisms by which China could be secretly increasing their gold reserves out of the scrutiny of the public eye. In 2008, China replaced South Africa as the largest gold producer in the world, but nobody really knows exactly how much gold China produces or how many proven/ probable reserves or how much measured/indicated resources they own. Thus, China could be increasing gold reserves significantly on in-house production alone. Certainly we know that China is increasing its silver reserves through a policy of decreasing its domestic silver exports and increasing its foreign silver imports.

For example, last month, China’s General Administration of Customs reported that its net imports of silver nearly quadrupled year-over-year in 2010 to more than 3,500 metric tons. Also of important note is the fact that in 2010, China exported 1,575 metric tons of silver, 58% less than in 2009, and imported 5,159 metric tons of the metal, 15% more than in 2009. This is a huge change if one realizes that from 2005 to 2010 China transitioned from a net exporter of 2,900 metric tonnes of silver to a net importer of 3,500 metric tonnes.
From 2005 to 2010, China increased its gold holdings in its State Administration of Foreign Exchange (SAFE) more than tenfold from a very small starting point of USD $4.2 billion to USD $48.1 billion. However, China could be increasing gold (and silver) reserves significantly through purchases in its Sovereign Wealth Fund - purchases that are not made available for public inspection or consumption. For China to publicly announce their buildup of gold and silver reserves that would drive up the price of the very commodity they wished to accumulate more of would be akin to then-Chancellor of the Exchequer Gordon Brown’s foolish decision to pre-announce in 1999 that the UK would be selling half of its gold reserves.

Also of important note are the following facts. China only recently deregulated gold in 2003 to allow gold prices in China to mirror international prices. The Shanghai Gold Exchange only opened in October of 2002. In late 2009, the Chinese started making gold and silver bullion easily accessible to its citizens through introducing physical sales of multiple size bars at its banks and China finally legalized ownership of 99.999% pure silver bullion. The Chinese typically have a tendency to buy PHYSICAL gold and PHYSICAL silver, not the fraudulent paper gold and paper silver derivatives invented by bankers to suppress the price of gold and silver. For the first time ever, Chinese citizens will be able to buy silver futures in Hong Kong this week and later in Shanghai; however, since the Chinese are fond of owning Physical metals, perhaps the majority of Chinese may settle these contracts with physical delivery. Furthermore, even when the option to buy gold and silver ETFs in China becomes a reality, the average Chinese citizen may shy away from these products due to his or her propensity for owning real gold and real silver.

For Asians in general, gold and silver have always been money. In Thailand, the word for money “ngen” is also the word for silver. In China, the word for bank combines the characters for “silver” and “movement”. In China not only is private demand strong AND relatively young, but even in India, private ownership of gold bullion bars was not legalized until 1990. Thus, the war between East and West over gold and silver will intensify in coming months and coming years. The objective of the East will be to release the gold and silver price from the clutches of Western price suppression schemes while the objective of the West will be to hoard gold in an attempt to prevent citizens of Western nations from owning the asset that will protect them the most from their currency devaluation schemes.

The current talk in the mainstream financial media about gold being a bubble at $1,600 an ounce and of silver having already reached its top of its long-term peak at $50 an ounce is simply rubbish. A bubble is never defined by high prices, the perception of high prices or even a decade long rise in prices. What defines a bubble is a meteoric rise in price that is not supported by fundamental reasons. For example, the US NASDAQ dot.com stock market was a bubble because dot.com stocks that had zero earnings were trading at impossible valuations and sometimes double and triple digit dollar values per share. However, the fundamental reasons that have driven gold from $250 to $1,600 and silver from $4 to its current $39-$40 range are even stronger today than they were at the beginning of this precious metals bull. Therefore, it is impossible for a bubble in gold and silver to exist at their current prices and at this current time.

About the author: JS Kim is the Managing Director of SmartKnowledgeU. SmartKnowledgeU now offers monthly subscriptions to our premium investment newsletter, the Crisis Investment Opportunities newsletter, an investment newsletter that has returned well over a cumulative 200% (on all opened and closed positions) since its launch in June 2007 to present day. Follow us on Twitter here.

Follow Us