Showing posts with label euro fx. Show all posts

Saturday, September 3, 2011

Macro Week in Review/Preview September 3, 2011


Last week’s review of the macro market indicators looked like the unofficial last week of Summer would bring Gold to bounce around in its uptrend while Crude Oil slowed at resistance and turned lower. The US Dollar Index seemed content to move sideways while US Treasuries were biased lower. The Shanghai Composite and Emerging Markets were biased to the downside with risk of the Chinese market running a little higher first. Volatility looked to remain elevated keeping the bias lower for the equity index ETF’s SPY, IWM and QQQ, despite the moves higher the previous week, with the QQQ looking to have the best chance to break the bear flags higher.

The week began with Gold meandering sideways and Crude Oil hitting the breaks at resistance. The US Dollar Index was behaving as anticipated but US Treasuries were finding some support. The Shanghai Composite drifted lower while Emerging Markets caught a bid and moved higher. Volatility tailed off but only marginally as the Equity Indexes SPY, IWM and QQQ rose. And then Friday happened pushing Gold and Bonds higher and Crude Oil and Equities lower. What does this mean for the coming week? Lets look at some charts.

As always you can see details of individual charts and more on my StockTwits feed and on chartly.)
Gold Daily, $GC_F

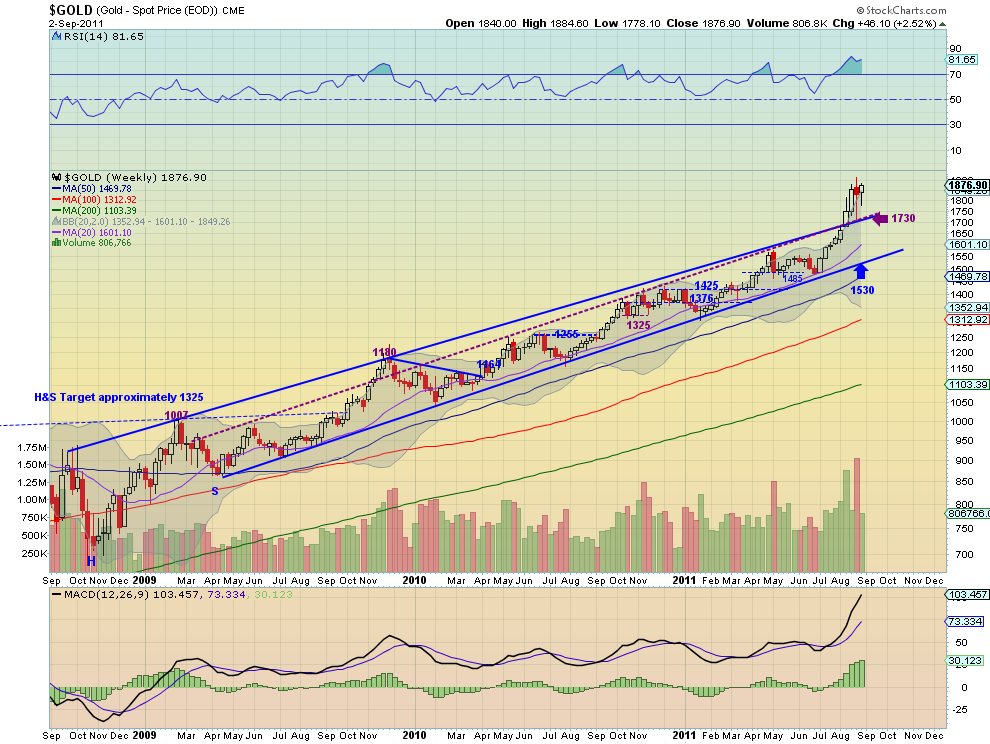
Gold Weekly, $GC_F

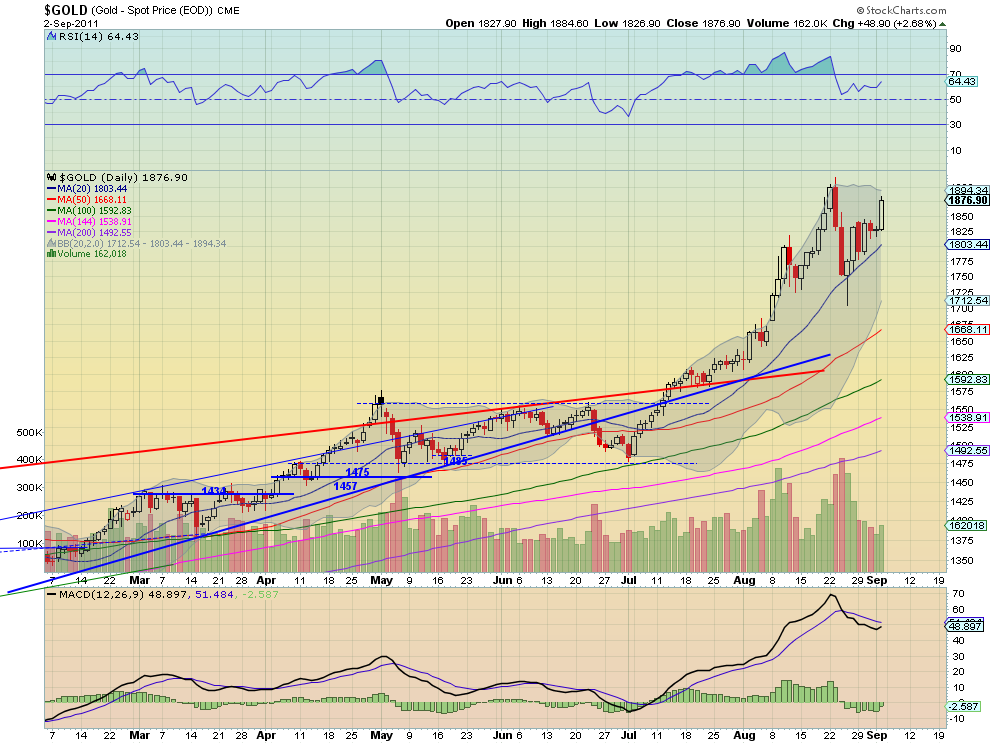
Gold spent most of the week building an ascending triangle under resistance of 1840 before launching over it on Friday to resistance near 1875. The daily chart shows a Relative Strength Index (RSI) that held well over the mid line and is moving higher and a Moving Average Convergence Divergence (MACD) indicator that is about to cross positive. The weekly chart remains bullish with upward sloping Simple Moving Averages (SMA), a MACD that is increasing and a RSI that remains high. The only concern about more upside in these charts is that the weekly RSI is over 80, and volume has been decreasing, but not a reason to sell. The triangle break has a target of 1930 with resistance at 1900 along the way. Look for Gold to head toward that target and possibly beyond in the coming week to the Measured Move (MM) of 2225 if it gets over 1940. Any pullback should find support at 1840 and 1800 below that.
West Texas Intermediate Crude Daily, $CL_F

West Texas Intermediate Crude Weekly, $CL_F
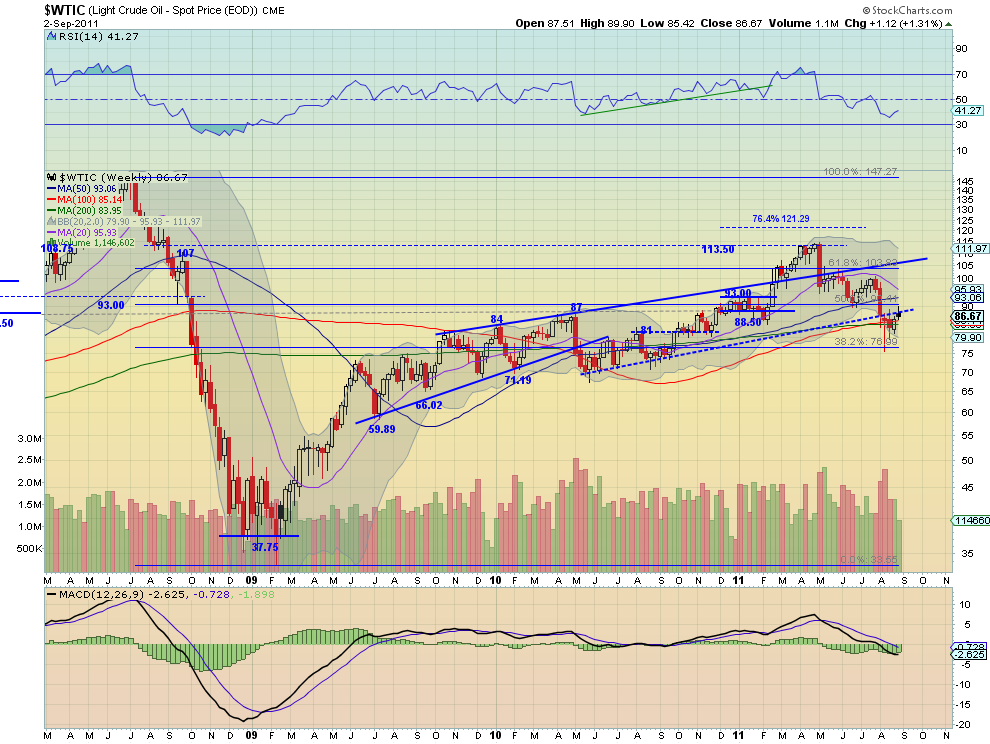
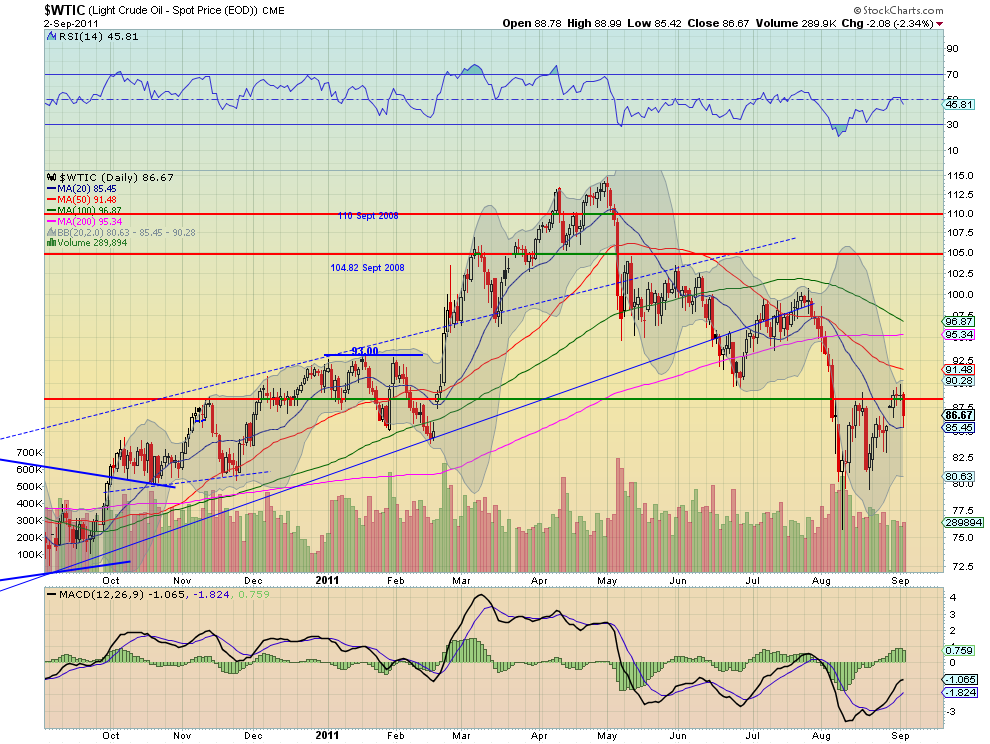
Crude Oil found resistance at the long term support/resistance line at 88.50 and fell back Friday. The RSI on the daily chart is now rolled lower and pointing down and the MACD is starting to fade. The SMA’s have been successively rolling lower also with only the 200 day SMA left. The weekly chart reinforces the rejection with the rising resistance line, but shows both the 100 and 200 week SMA as support underneath. The RSI on this timeframe has been trending lower but currently cricked higher, while the MACD is negative but has been flat. Look for Crude to continue lower next week toward support at 84. A move below 81 would trigger the next leg down with a target of 77. Any move above 88.5 will find resistance at 90.
US Dollar Index Daily, $DX_F

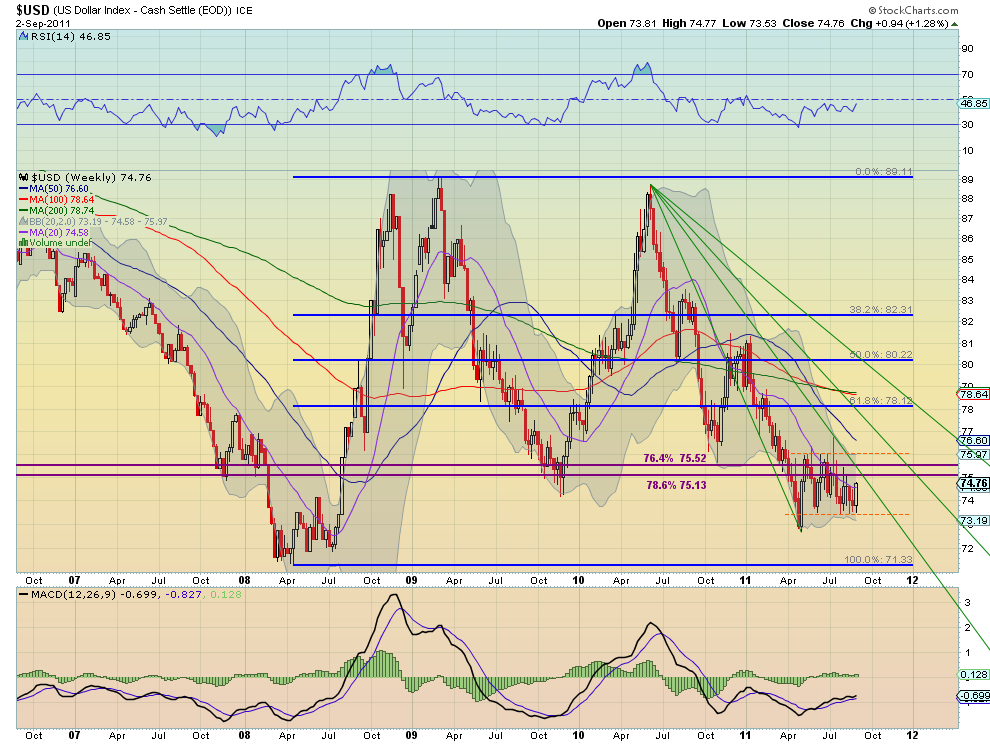
US Dollar Index Weekly, $DX_F

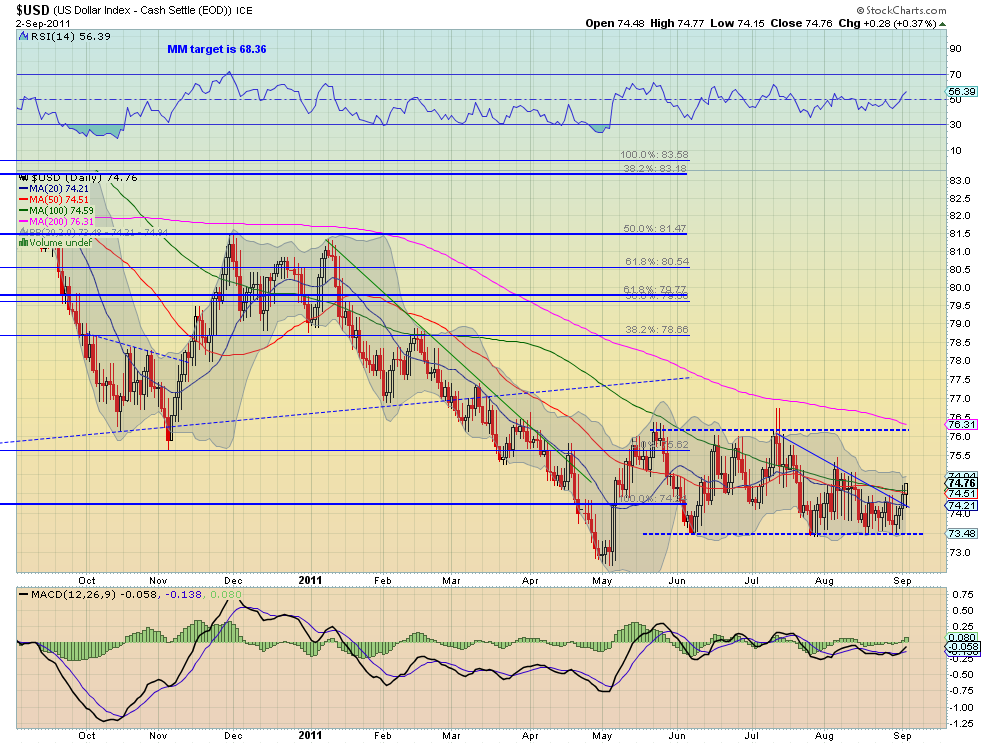
The US Dollar Index broke higher above the descending triangle with in the 73.50 to 76 channel this week. It has a RSI on the daily chart that is rising and a MACD that has crossed positive, both suggesting more upside to come. The weekly chart is more middle of the road looking with the range in tact and the RSI shuffling along just below the mid line while the MACD stays near zero as it moves one week closer to the first Fibonacci fan line. Look for the Index to spend time in the top half of the channel next week. Any move over 76 should find resistance at 77.50 and a move below 73.5 support at 73 and 72.
iShares Barclays 20+ Yr Treasury Bond Fund Daily, $TLT

iShares Barclays 20+ Yr Treasury Bond Fund Weekly, $TLT
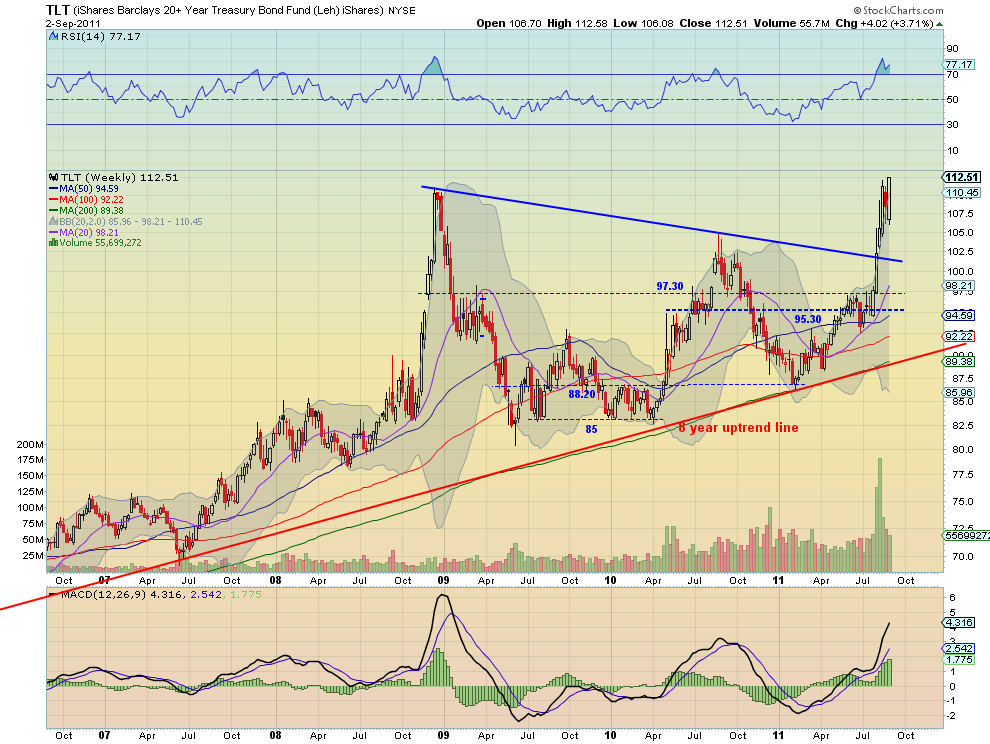
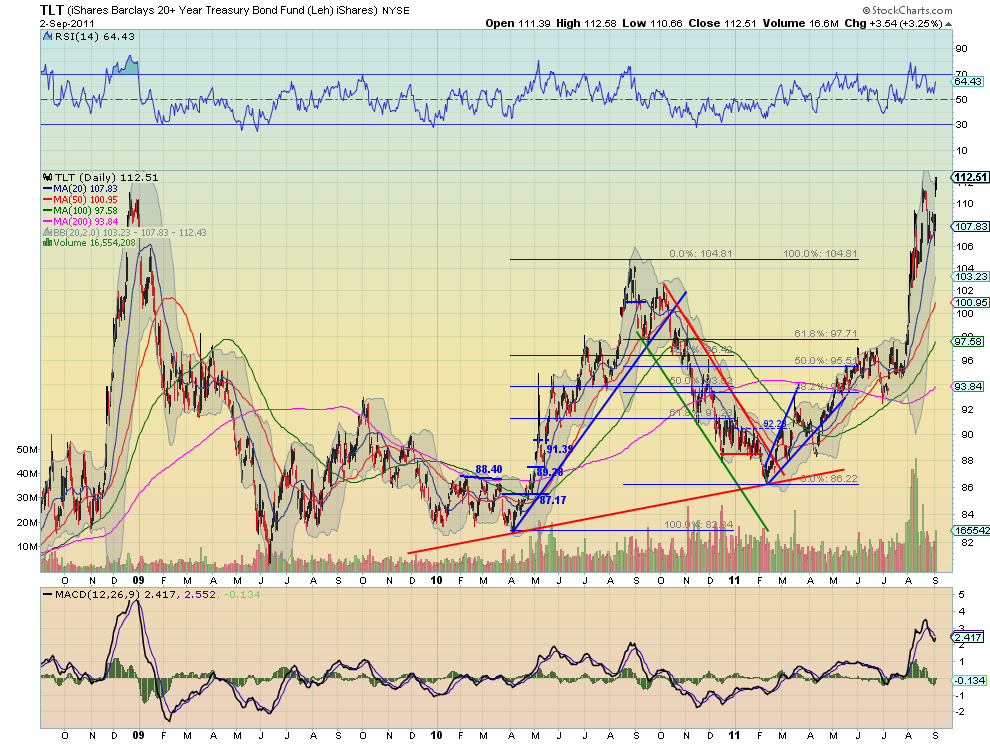
US Treasuries, as measured by the ETF $TLT, consolidated higher for most of the week before breaking to new highs on Friday. The RSI is in bullish territory and currently rising while the MACD has moved back to the zero line and looks ready to cross higher, on the daily chart. The weekly chart shows a strong white candle closing nearly on the high in a bull flag. The RSI is elevated but not extreme at 77.17 and the MACD continues to increase. Look for more upside in Treasuries next week with targets higher on a MM to 120.70 and then 137 from the symmetrical triangle pattern breakout on the weekly chart. Any downside move should find support before 104.80 at either 108 or 106.
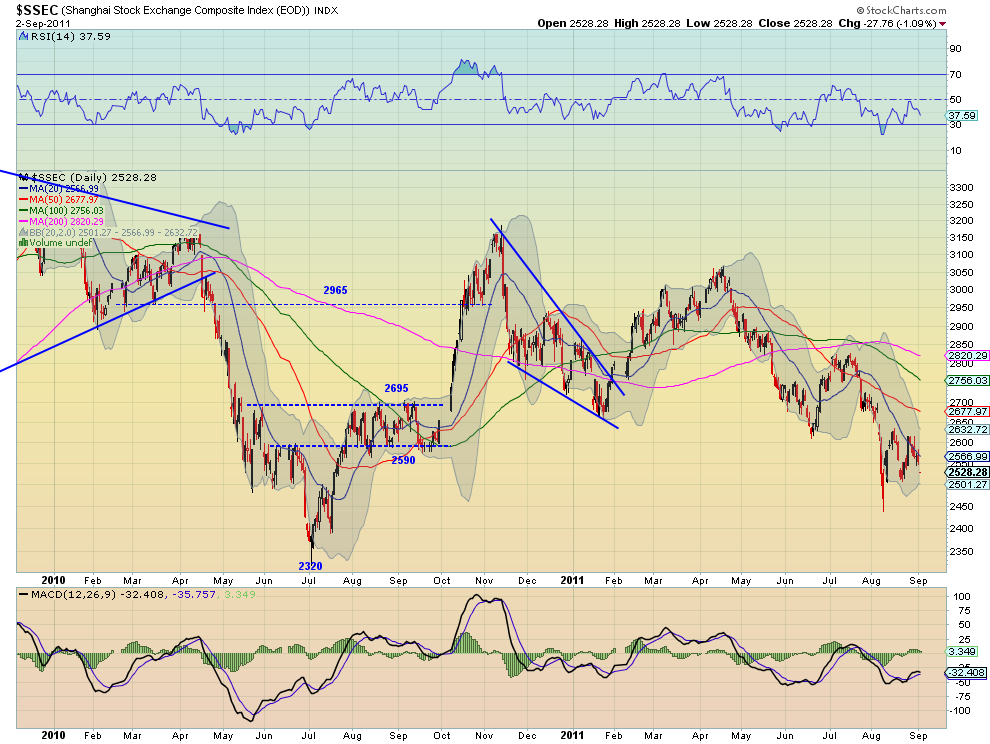
Shanghai Stock Exchange Composite Daily, $SSEC

Shanghai Stock Exchange Composite Weekly, $SSEC
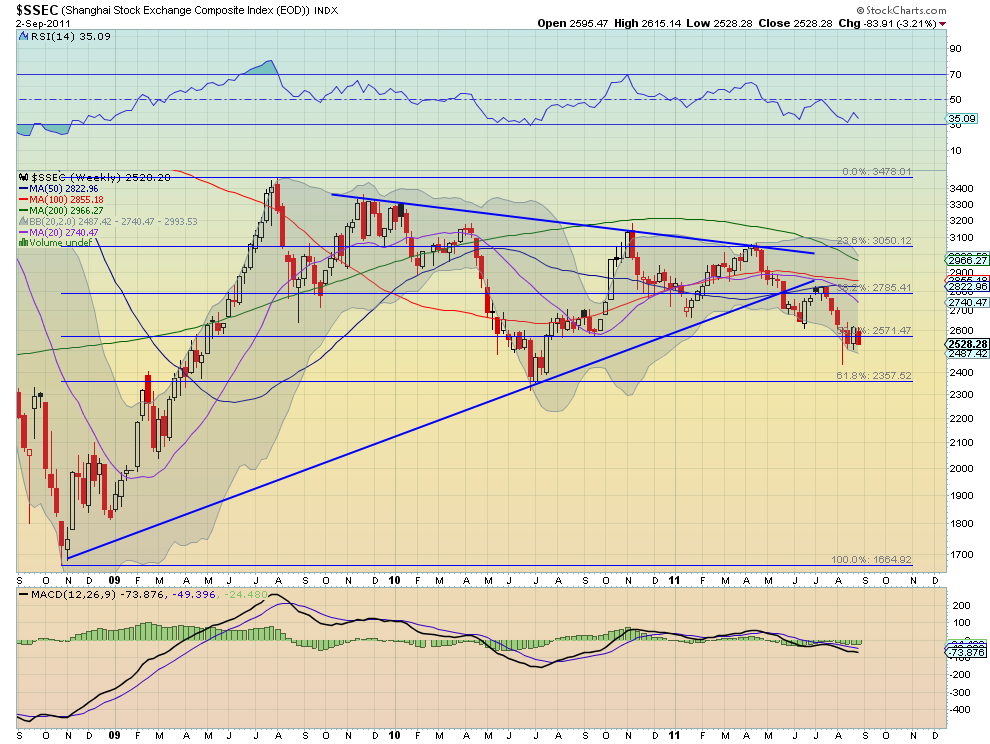
The Shanghai Composite is in a bear flag or continuation symmetrical triangle and moved lower in it this week. The daily chart shows the RSI indicating for more downside with a MACD that is rather flat. The weekly chart shows the flag is right at the 50% Fibonacci level of 2571 form the move up from 2008 to 2009. The RSI is heading lower and the MACD is flat on this timeframe. Look for more downside in the coming week with support lower at 2500 and then 2450. A break below that leads to a test of the 61.8% Fibonacci at 2357 and a target on the MM lower at 2260. Any upside surprise should find resistance at 2590 and then 2695-2700.
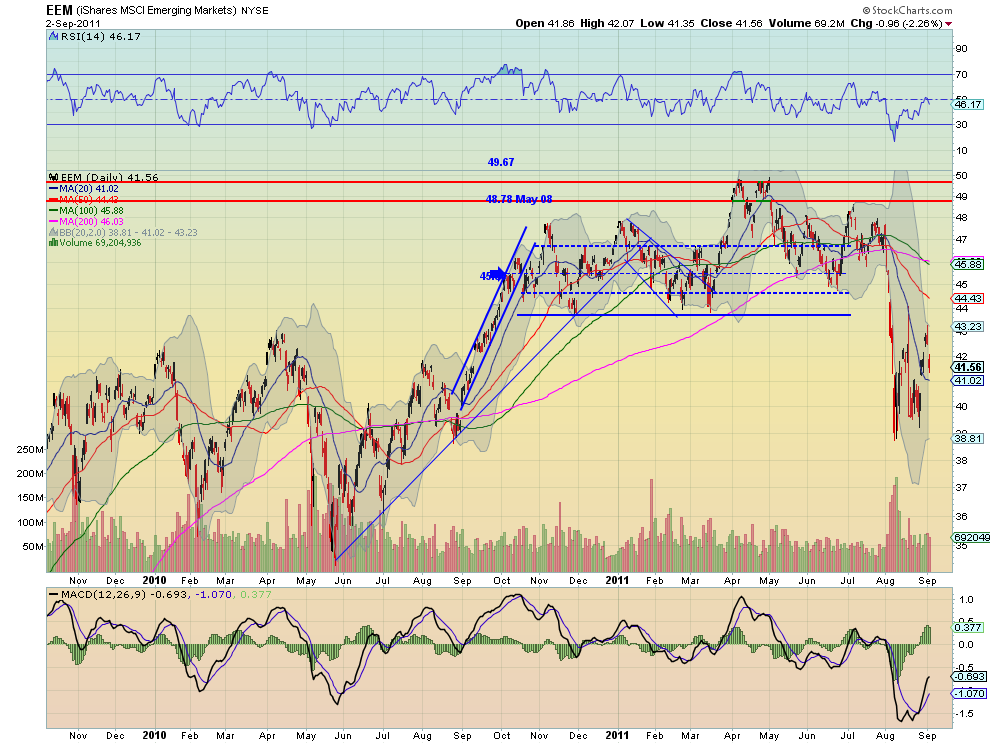
iShares MSCI Emerging Markets Index Daily, $EEM

iShares MSCI Emerging Markets Index Weekly, $EEM

Emerging Markets, as measured by the ETF $EEM, made a move higher early in the week only to be contained by what might be the beginnings of a symmetrical triangle as resistance and close lower Friday. The RSI met the mid line and rejected lower while the MACD peaked and is now waning on the daily chart, with all of the SMA’s sloping lower. The weekly chart shows the reach higher with the long shadowed candle but unable to hold over the 42.54 support/resistance level. The RSI is suggesting upside on this timeframe and the MACD is starting to improve. The path in the short run looks lower with any upside contained at 42.54 with a hold over that level leading to a shift in thinking. Next week support comes at 39 and a break below that puts a move to to support at 35.91 on the way to a MM at 32 into play.

VIX Daily, $VIX

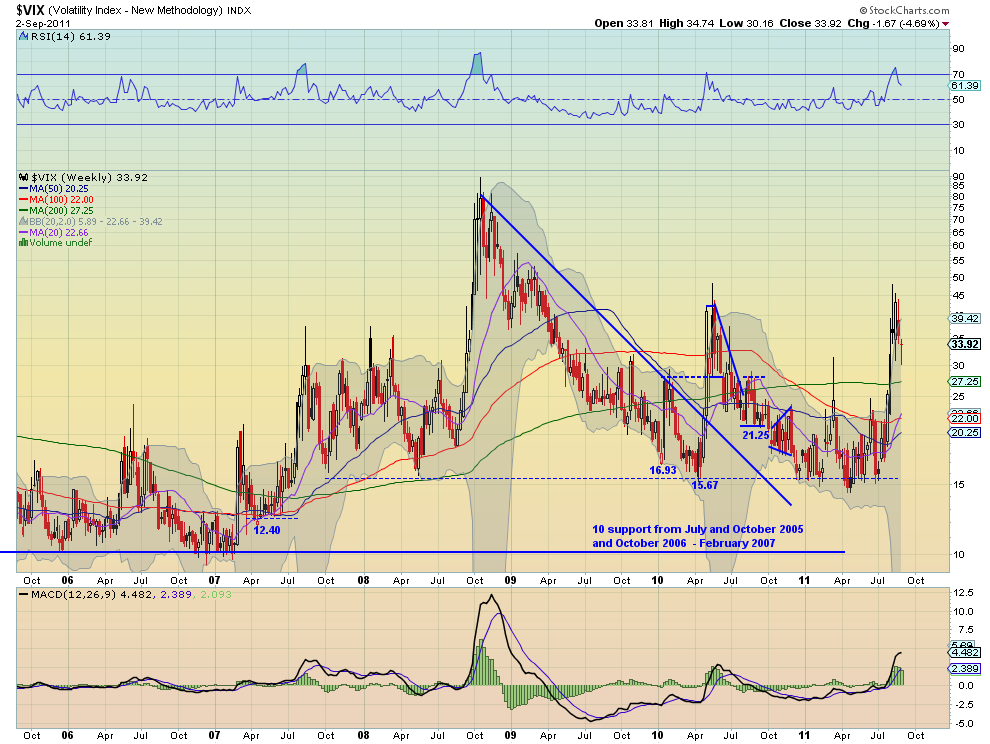
VIX Weekly, $VIX

The Volatility Index pulled back but held support at 30 before rising to close the week. The RSI on the daily chart bounced higher after hitting the mid line and the MACD peaked negative and is now improving. The weekly chart has the RSI falling and the MACD starting to move back toward zero. Divergence between timeframes. Look for volatility to remain elevated relative to the first 7 months of the year but a move below 28 could change that quickly. Conversely a move over 38 should lead to a retest of the 44 to 48 range. Look for more in the 28 – 38 range next week.
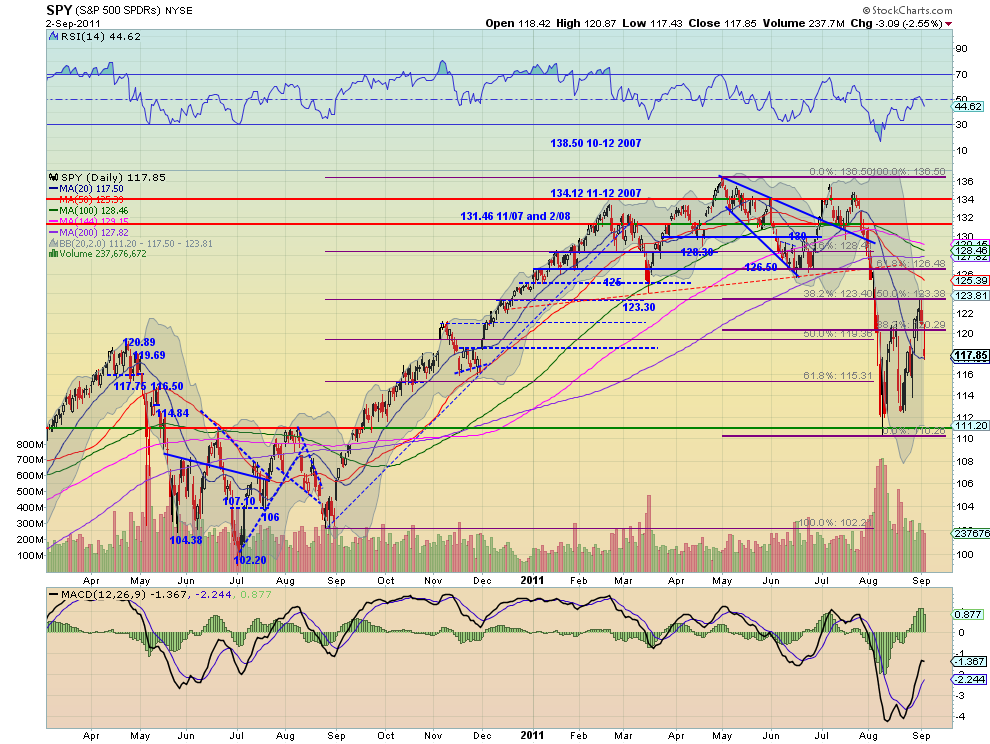
SPY Daily, $SPY

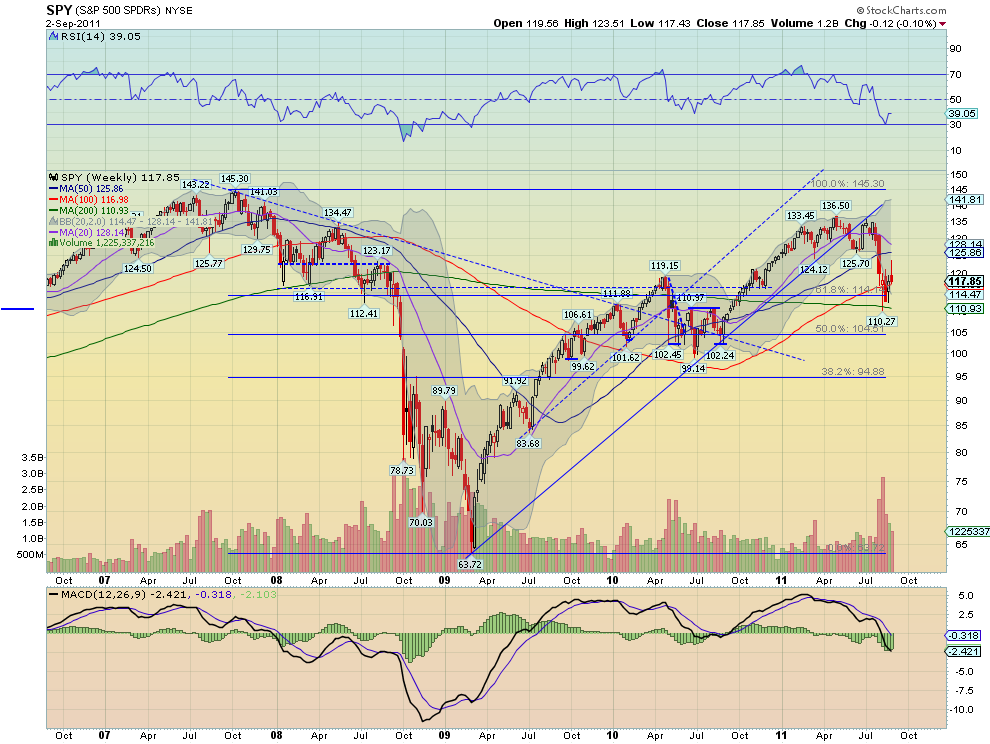
SPY Weekly, $SPY

The SPY rose early in the week but fell hard Friday after printing a Tweezers Top with topping tails halting at the 20 day SMA. The RSI on the daily chart turned lower at the mid line and the MACD is waning. On the weekly chart the long upper shadow may be foreshadowing more down side out of the bear flag. The RSI however is rising off of the low and the MACD is improving on this time frame. The trend is lower and look for that to continue next week with any upside move held at 121.50 or 123.40 above that. Any more and the down trend is in question. To the downside if support at 112.4 does not hold then the next levels down for support come at 111.15 and 104 on the way to the MM target of about 95.
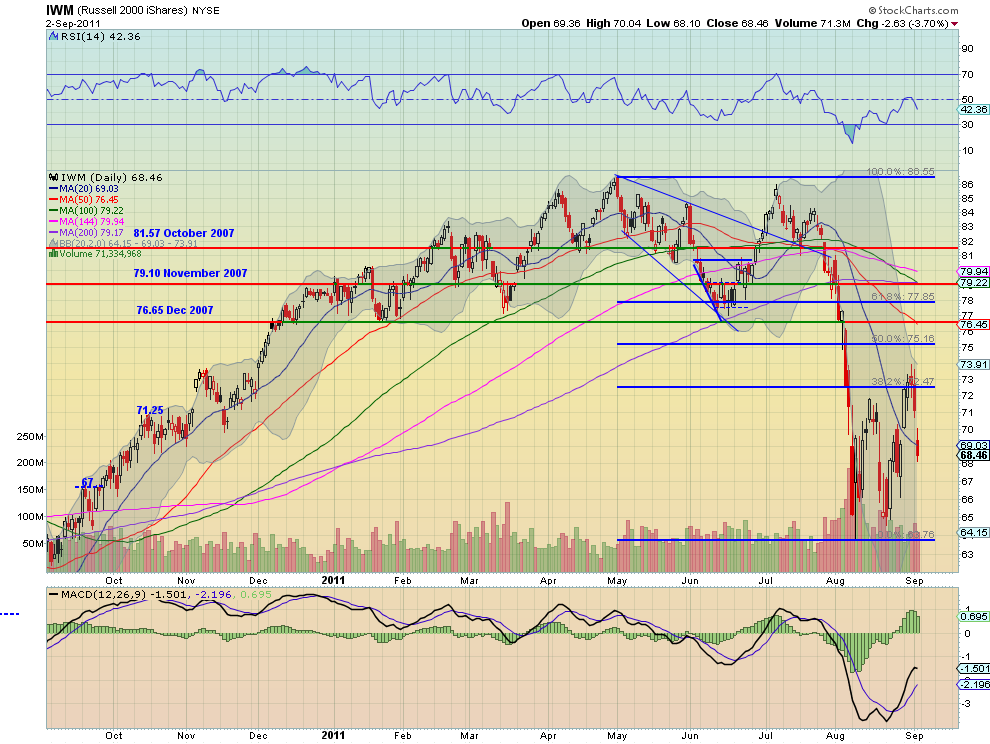
IWM Daily, $IWM

IWM Weekly, $IWM

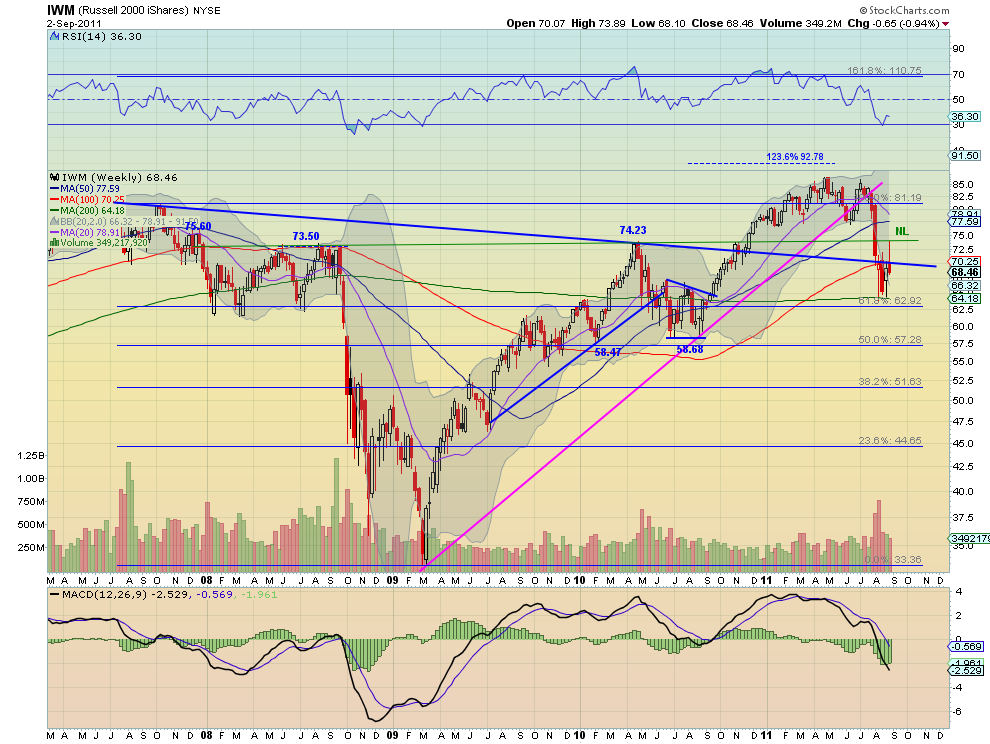
The IWM rose early in the week but also crashed Friday after printing a topping tails at the 38.2% Fibonacci retracement of the move lower, halting under the 20 day SMA. The RSI on the daily chart turned lower at the mid line and the MACD is waning. On the weekly chart the long upper shadow at the extended neckline of the previous inverse Head and Shoulders is showing more down side out of the bear flag. The RSI is rising off of the low but cricking back down and the MACD is improving on this time frame. The trend is lower for next week with any upside move held at 71.60 or 73.60 above that. Any more and the down trend is in question. If the downside support at 65 does not hold then the next level down for support comes at 62.8 on the way to the MM target of about 48.
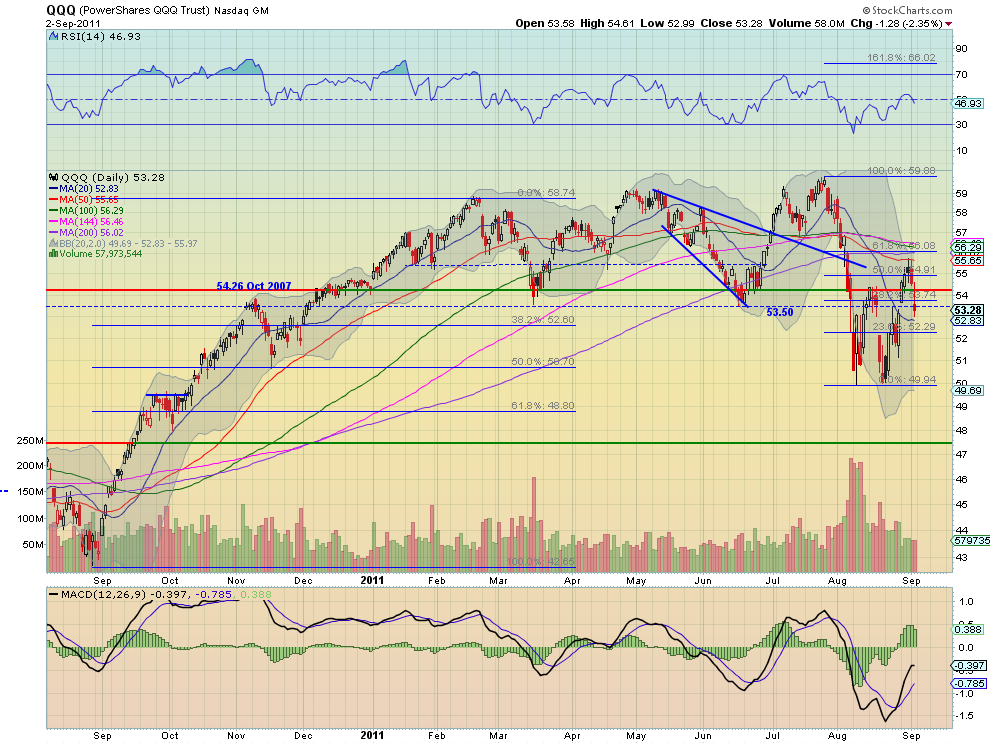
QQQ Daily, $QQQ

QQQ Weekly, $QQQ

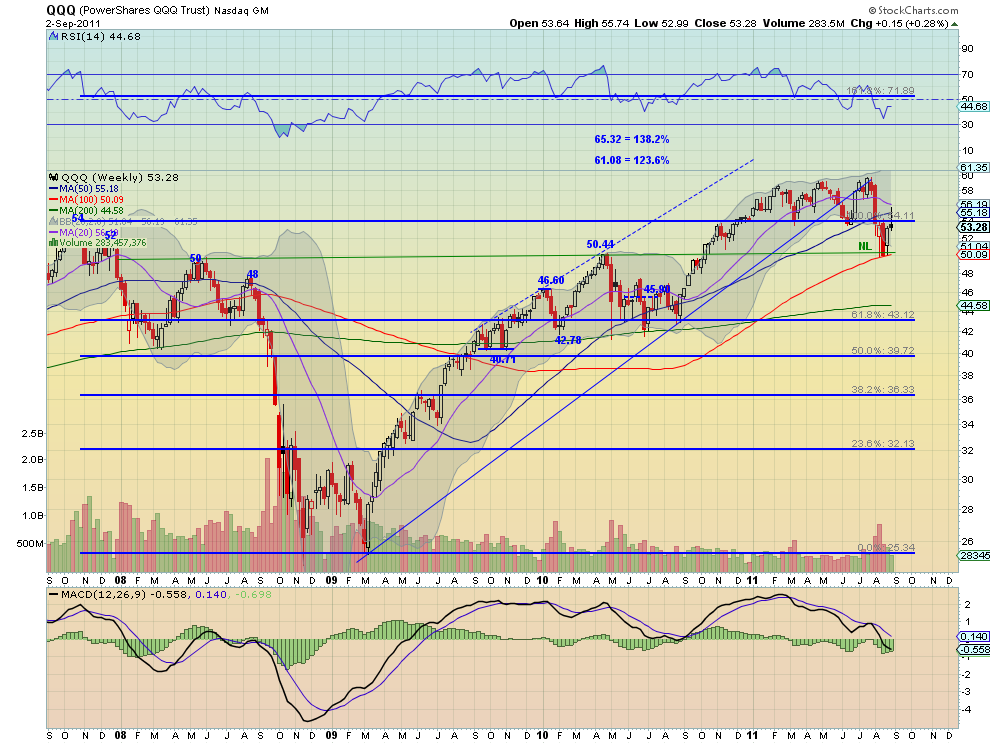
The QQQ also rose early and fell hard Friday after a Tweezers Top with topping tails at the 50 day SMA halting just above the 20 day SMA. The RSI on the daily chart turned lower under the mid line and the MACD is waning. On the weekly chart the long upper shadow may be foreshadowing more down side out of the bear flag. The RSI however is rising off of the low but cricking lower again and the MACD is improving. The trend is lower for next week with any upside move held at 54.26 or 55.50 above that. Any more and the down trend is in question. if the downside support at 50.00 does not hold then the next levels down for support come at 48 and 46 on the way to the MM target of about 40.

Next week looks like the moves that revealed themselves Friday will continue. Gold and US Treasuries are ready to continue higher. Crude Oil looks poised to drop further and the US Dollar Index to move sideways in the top of its range. The Shanghai Composite and Emerging Markets look to continue lower. Volatility looks to continue elevated with the US Equity Index ETF’s SPY, IWM and QQQ ready to continue lower in their bear flags. US Treasuries breaking out and Gold racing higher again could be the catalyst for a break of the bear flags lower. Use this information as you prepare for the coming week and trade’m well.

Wednesday, July 27, 2011

Dollar Index Takes Out Key Support Looking to EUR/USD For Direction

by DailyFX
  • 0digg

Dollar Index Takes Out Key Support Looking to EURUSD For Direction body 7 forex
The Dow Jones FXCM Dollar Index (ticker: USDollar) took out key support at early May lows at 9340 over-night. While this support level is fully negated until the index closes below it the current theme of selling the greenback at every turn is setting up the index to close below this level. If it fails to do so then further downside extensions may be postponed. However, assuming that the dollar index does close below this level today and we enter somewhat uncharted territory we have been looking at Eur/Usd for some directional bias.
Dollar Index Takes Out Key Support Looking to EURUSD For Direction body eur forex
We have highlighted in the above chart the well known series of lower tops carved out by the euro in recent months which has kept most techies relatively bearish on the euro at least until this trend is broken. A failure to take out the highs from the third lower top will keep the trend in tact as the pair carves out a fourth lower top and will put the pressure on the downside once again, and likely see the dollar index rebound. However, if the euro keeps climbing and takes out the highlighted level and negates this trend we could see a significant shift in structure and bulls take control of the pair once again, which would see the dollar index extend its declines.

Therefore, as things stand with little directional bias emanating from the dollar index itself we will watch the most heavily traded and most liquid currency pair for further directional cues for the buck in coming days. It goes without saying that while these technical signals are all well and good one should keep a keen eye on political developments in Washington regarding the US debt impasse, these developments, or lack thereof, are likely to be the catalyst of price action.

See the original article >>

Tuesday, July 26, 2011

Eye on Euro


It is interesting that the EUR/USD is circling unchanged this morning while spot gold price continue to climb in reaction to the ongoing impasse in the U.S. debt ceiling debate. You would think that if the desperate elements within the EC political structure managed to find common ground to deal with (quarantine) Greece during a crisis, that U.S. politicians would be able to put aside some of their differences to end this game of brinkmanship to avert an unprecedented crisis.

Once the markets decide that the dangerous political game is becoming THE crisis in and of itself, the laws of unintended consequences kick in, leaving the U.S. economy and the well-being of its citizens vulnerable to, of all things, Moody's and S&P ratings.

How can we find ourselves hostage to the same ratings agencies that completely fell asleep at the switch before and during the 2008 financial crisis or which were (are) beholden to their own "special" interests? No wonder gold continues to tick up every day. Can a plunge in the dollar be far behind -- against the euro in particular, which represents a currency that exhibits the political will to survive and to self-correct its shortcomings?

If EUR/USD hurdles and sustains above key resistance between 1.4460-1.4580, the euro should take off towards 1.50000 -- bullish for the CurrencyShares Euro Trust ETF (FXE). 


See the original article >>

Saturday, July 23, 2011

EUR Breakout or a Third Lower High

by Bespoke Investment Group

Positive news out of Europe regarding Greece sent the Euro back above its 50-day moving average today. Before investors will feel more comfortable going long Euros, however, the currency will have to break its short-term downtrend as well as its string of lower highs.


Thursday, July 21, 2011

Crude Oil, Gold Look to EU Summit and US Debt Debate for Guidance


Talking Points
  • Crude Oil Looks to EU Summit Outcome for Direction Cues
  • Gold Holds on to Safe-Haven Role Amid Macro-Level Jitters
WTI Crude Oil (NY Close): $98.14 // +0.64 // +0.66%
Prices continue to track broad-based risk appetite trends, putting the spotlight on the EU leaders’ summit set to begin in Brussels. Sentiment got a bit of a boost overnight amid news of a Franco-German agreement on a plan for Greece ahead of the sit-down, but putting out the fire in the Mediterranean country in isolation seems hardly enough to calm investors.

Indeed, Greece is nearly an afterthought now that fears of real contagion in larger countries like Spain and Italy – both arguably too big to be bailed out via the existing EFSF rescue fund – are beginning to play out. With that in mind, the most important takeaway from today’s meeting will be the scalability of any Greek arrangement for other ailing countries. A one-off plan that addresses none of the vulnerabilities elsewhere in the region is likely to be met with disappointment by the markets, sinking confidence and – by extension – the WTI contract.

Later in the session, the earnings calendar and a second-tier set of US economic data releases will enter into the picture. A hefty 21 S&P 500 companies are set to report second-quarter results. So far, the ratio of positive surprises on headline profits readings to negative ones is outpacing the first quarter, suggesting the reporting seasons has broadly supportive implications for risk appetite, but disappointing news from Europe will almost certainly overshadow that. Meanwhile, July’s Philadelphia Fed business confidence survey is expected to post a bit of an improvement.

Technical considerations are broadly bearish. Prices put in a Doji candlestick below resistance at $99.22, the 38.2% Fibonacci retracement of the drop from the early May swing high, hinting a move lower may be ahead. The setup reinforces the likelihood of a forming Ascending Triangle chart pattern, arguing for bearish continuation. A break through triangle support at $95.50 initially exposes $94.13 and $92.51.
Crude Oil Gold Look to EU Summit and US Debt Debate for Guidance body Picture 3 forex

Spot Gold (NY Close): 1600.50 // +12.05 // 0.76%

Gold rebounded as the bipartisan “Gang of Six” deficit-reduction plan endorsed President Obama yesterday began to lose some its luster amid fears the tax hikes it included would not pass a vote in the House of Representatives. Fears that the initiative is too ambitious given the proximity of the August 2nd deadline to raise the debt ceiling also circulated across the newswires. Needless to say, this propped up safe-haven demand for yellow metal after yesterday’s selloff.

Looking ahead, the beginning of debate on the conservative “cut, cap and balance” deficit-reducing initiative that passed the House earlier this week is set to begin in the Senate, but Obama’s pledge to veto it even if it passes strong Democrat opposition means its fate from here is largely moot. With that in mind, uncertainty is back in play, with the tone of headlines crossing the wires on the issue largely in charge of where gold is heading over the near term.

Clearly, the outcome of the EU leaders’ summit is also of note. Prices have tracked closely with periphery Euro Zone credit-default swap (CDS) spreads, meaning a disappointing outcome from Brussels is likely to prove supportive for gold prices, and vice versa. Finally, a strong showing on the earnings front may dampen QE3 expectations, sapping demand for gold from investors looking of an inflation hedge, but this seems somewhat secondary given the macro-level issues playing out at present.

On the technical front, prices rebounded from support lines at $1578.82, the 23.6% Fibonacci retracement level, having taken out rising channel support that upheld the rally since the beginning of the month. The move appears corrective, with a push above the July 19 high at $1609.95 needed to neutralize near-term selling pressure. A resumption of bearish momentum that clears current support initially exposes $1559.56. Longer-term positioning remains broadly bullish.
Crude Oil Gold Look to EU Summit and US Debt Debate for Guidance body Picture 4 forex

Spot Silver (NY Close): $40.04 // +0.98 // +2.50%

As before, the key drivers of silver price action continue to mirror those of gold, with the central focus on the EU leaders’ summit and the evolving US deficit-reduction impasse. Prices remain locked in consolidation below resistance at $41.06, but the presence of a Bearish Engulfing candlestick pattern suggests the path of least resistance favors the downside. A break below initial support at $39.01 exposes downside targets at $37.17 and $36.29.
Crude Oil Gold Look to EU Summit and US Debt Debate for Guidance body Picture 5 forex

Monday, July 18, 2011

Time to Short the Euro?

by SmartMoney


With Europe's debt woes mounting, some savvy currency investors are shorting the euro against the dollar -- a bold bet considering the greenback's own shaky status.

After months of battering, Europe's economy may receive yet another jolt of bad news on Friday: The European Union's banking regulator is scheduled to release the results of bank "stress tests," aimed at showing which banks have enough cash to withstand another crisis. About 12 to 15 banks are expected to fail the tests, but any additional failures are likely to fuel doubts about the euro, says Brian Dolan, the chief currency strategist for Forex.com. Retail currency traders at forex brokerage firm FXCM had been largely betting on the euro against the dollar until this morning, when they flipped to being net short the euro, says David Song, a currency analyst for the firm's daily commentary site, DailyFX.com. 

The stress tests are only the latest in a long series of tests for the euro. The region's sovereign debt crisis has been unfolding for more than a year, with both Greece and Ireland receiving bailouts and rising fears that Spain and Italy will soon need them, too. On Thursday, an Italian bond auction saw yields on the country's five- and 15-year bonds hit three-year highs, indicating growing concern about sovereign debt that extends beyond Greece. The euro fell to a seven-week low this week, but is still up 6% for the year over the struggling U.S. dollar.


To short the euro, investors with a foreign-exchange trading accounts could simply sell the euro against the dollar leading into Friday's announcement. "More people are coming around to the view that Greece has to default," says Andrew Busch, a global currency strategist for BMO Capital Markets. "That's why I want to continue to try to sell euros on rallies," Busch says. Keep in mind that currency trades use leverage, and that currency markets move quickly and significant moves can appear small to new traders. For example, at the maximum 50-to-1 leverage offered by U.S. forex dealers, a typical trader could be making or losing thousands of dollars on one-cent moves in exchange rates. For his part, Busch recommends taking profits after about a 4-cent slide and setting a stop-loss to exit the trade after about a 1-cent rise in the euro.


Investors without forex accounts can use a currency exchange-traded fund like the Pro-Shares Ultra Short Euro (EUO: 17.56, -0.03, -0.17%) or the Market Vectors Double Short Euro (DRR: 39.25, 0.04, 0.10%). Experts caution: These are leveraged ETFs that track daily moves in the currency, so they also can generate significant losses or gains on seemingly small moves. For example, the Market Vectors product should rise 2% for every 1-cent drop in the price of the euro against the dollar.


Despite the significant troubles facing the euro zone, betting against the currency is far from a sure thing. The fact that retail traders have started shorting the euro is actually a contrarian indicator that might suggest the euro is due for another rally, Song says. Some pros also warn against betting on the dollar, considering the U.S.'s escalating troubles, including the fast-approaching deadline for raising the debt ceiling and signals that the Federal Reserve won't raise interest rates any time soon, Dolan says. That's creating something of a see-saw between the dollar and the euro, as fresh bad news hits one currency or the other in turn, Busch says. "It's what I'd call dueling debt banjos," he says. The third, and perhaps safest option, say some traders: The yen. "Given the uncertainty in this environment it's probably better to be selling risk," Dolan says, meaning selling currencies that fall when investors get nervous, like the Australian or New Zealand dollars, or the iffy euro, versus the relatively safer yen.

Monday, July 11, 2011

Graham Summers Weekly Market Forecast (Risk Off Edition)

by Graham Summers

The financial world is beginning to break down in a big way today. In the currency markets, the second Greek bailout is turning out to be precisely the dud I said it would.

After all, it was only one year ago that Greece received its first bailout. Having now asked for extensions on returning those funds AND a second bailout, it’s bizarre that anyone would think giving more money to Greece would fix its problems.

Italy, Spain, and Portugal are all on equally shaky ground. The last of those three was actually just downgraded to “junk” status by Moody’s last week. So it’s not too surprising that the Euro is breaking down in a big way this morning.

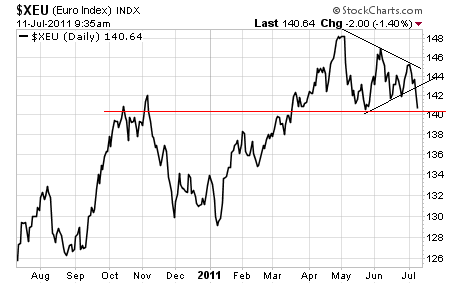
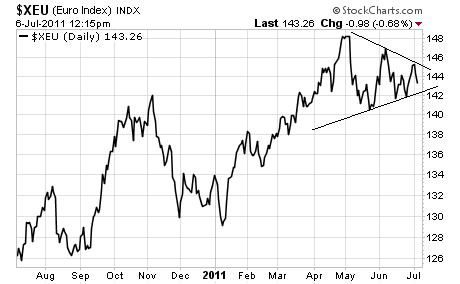
We look to have broken out of the triangle pattern I talked about before. We’re now coming up against major support at 140. If we break this line it’s 136 in short order.

The drop in the Euro has coincided with an explosive jump in the US Dollar this morning, which in turn is kicking stocks and commodities (with the exception of Gold and Silver) down in a big way.

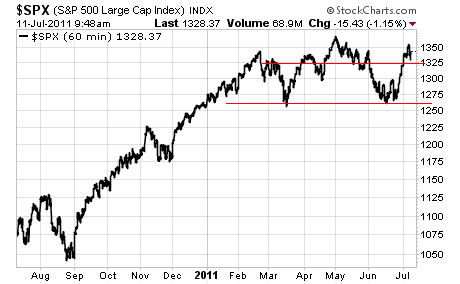
I said before that I thought the ramp job in stocks was more manipulation and performance gaming than anything else. If the S&P 500 breaks below 1325 and stays there I’ll be proven right as we’re then going to 1,300 if not 1,275 in very short order.

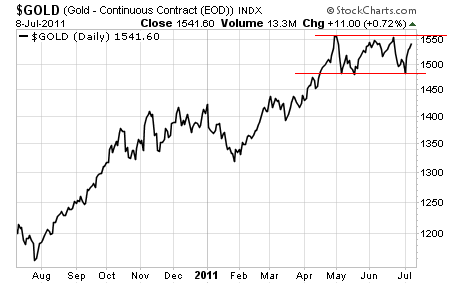
Meanwhile, Gold is on the verge of challenging its all-time high in US Dollars (and Euros) once again asserting that it is in fact a currency, NOT a commodity. If we break 1,550 and stay there then the next leg up in the precious metal will have begun.

In plain terms, the financial world is on RED ALERT this week as there is really little to hold the markets up anymore (QE 2 ended). Meanwhile the whole financial system is showing signs of extreme duress.

European banks (and nations!) continue to remain insolvent and we will be seeing defaults in the near future. 

The situation there has not ended by a long shot and I am certain the Euro will no longer exist in its current form within 12 months.

Meanwhile, China’s inflation is spinning out of control. A liquidity crisis is brewing over there that could rival the Lehman Brothers collapse, as the vast majority of local government debt in China is toxic. Indeed, China just failed to sell half of its intended local government debt in a recent bond auction.

And then of course there is the US, where we have officially breached the debt ceiling and are stealing from pension funds to meet new debt issuance. Indeed, things are now so bad with the US that Tim Geithner is potentially jumping ship.

My question is:

How bad must things be getting that Geithner, a man who has lied and swindled the American people with impunity, and has never once suffered the consequences of his actions, is voluntarily “getting out of Dodge”?

The answer: BAD.

Indeed, I think we could very easily see a repeat of the May 2010 Collapse, if not another 2008 type event in the near future. Only this time, the Crisis will be far far worse because the financial world will have realized that the central banks CANNOT solve the problems that brought about 2008.

When that happens, the REAL Crisis will start along with stock crashes, currency defaults, food shortages, and the like. Which is why if you’re not taking steps to prepare for what’s coming now, you need to start moving.

Currency Flag Patterns ...

by Kimble Charting Solutions


Friday, July 8, 2011

EUR/USD: Trading the U.S. Non-Farm Payrolls Report

By David Song

Trading the News: U.S. Non-Farm Payrolls
 
What’s Expected:
 
Time of release: 07/08/201112:30 GMT, 8:30 EST
Primary Pair Impact: EURUSD
Expected: 105K
Previous: 54K
DailyFX Forecast: 70K to 120K
 
Why Is This Event Important:
 
U.S. Non-Farm Payrolls are expected to increase another 105K in June following the 54K expansion in the previous month, and the faster pace of growth could spark a bullish reaction in the U.S. dollar as the data instills an improved outlook for the world’s largest economy. As the recovery in the labor market gathers pace, the Federal Reserve may raise its fundamental assessment, and the central bank may continue to unwind its emergency measures in the second-half of the year as policy makers expect to see a economic activity expand at a more rapid pace in 2012. However, as risk trends continue to influence price action in the foreign exchange market, a positive development could lead currency traders to increase their appetite for yields, and the U.S. dollar may trade heavy going into the end of the week as market sentiment improves.
 
Recent Economic Developments
 
The Upside
 
Release
Expected
Actual
ADP Employment Change (JUN)
70K
157K
ISM Non-Manufacturing (Employment) (JUN)
54.1
54.0
ISM Manufacturing (Employment) (JUN)
59.9
58.2
The Downside
 
Release
Expected
Actual
Challenger Job Cuts (YoY) (JUN)
--
5.3%
Factory Orders (MAY)
1.0%
0.8%
Industrial Production (MAY)
0.2%
0.1%

As the recent batch of data highlights a positive reading for NFP’s, we could see the results top market forecast, and the recovery in the labor market may gather pace in the second-half of the year as economic activity is expected to expand at a faster pace in the coming months. As mentioned by my colleague Christopher Vecchio, the ADP employment report has been a good leading indicator in recent months, and the marked rise in private payrolls could certainly translate into a stronger NFP reading. However, the rise in planned job cuts paired with the slowdown in production could translate into a soft employment report, and businesses may scale back on hiring as they cope with higher input prices. In turn, the Fed may continue to endorse its zero interest rate policy throughout the second-half of the year, and the central bank may look to support the economy going into 2012 as it aims to encourage a sustainable recovery.
 
Potential Price Targets For The Release
EURUSD_Trading_the_U.S._Non-Farm_Payrolls_Report_body_ScreenShot051.png, EUR/USD: Trading the U.S. Non-Farm Payrolls Report
How To Trade This Event Risk
 
Projections for a faster pace of employment growth certainly reinforces a bullish outlook for the greenback, and the market reaction following the report could set the stage for a long U.S. dollar trade as the economic outlook improves. Therefore, if payrolls increase 105K or greater in June, we will need a red, five-minute candle following the release to establish a sell entry on two-lots of EUR/USD. Once these conditions are met, we will place the initial stop at the nearby swing high or a reasonable distance from the entry, and this risk will generate our first target. The Second objective will be based on discretion, and we will move the stop on the second lot to cost once the first trade reaches its mark in order to lock-in our profits.
 
On the other hand, slowing demands paired with higher input prices may lead businesses to keep a cap on their labor force, and a dismal employment report could exacerbate the recent decline in the greenback as it reinforces a weakened outlook for future growth. As a result, if the economy adds less than 70K jobs from the previous month, we will carry out the same setup for a long euro-dollar trade as the short position mentioned above, just in reverse.

Impact that the U.S. Non-Farm Payrolls report has had on USD during the last month
Period
Data Released
Estimate
Actual
Pips Change
(1 Hour post event )
Pips Change
(End of Day post event)
MAY 2011
06/03/2011 12:30 GMT
165K
54K
+27
+143
May 2011 U.S. Non-Farm Payrolls
 
Employment in the world’s largest economy increased 54K in May after expanding a revised 232K in the previous month, while the jobless rate unexpectedly climbed to an annualized 9.1% from 9.0% during the same period to mark the highest reading since December. A deeper look at the report showed a 83K rise in private payrolls amid forecasts for a 170K rise, with manufacturing jobs slipping 5K to post the first decline since October, while public sector employment weakened another 29K after falling 19K in the previous month. The slowing recovery in the labor market certainly dampens the outlook for the economy as private sector consumption remains one of the leading drivers of growth, and the Federal Reserve may preserve its zero interest rate policy throughout the remainder of the year as it aims to encourage a sustainable recovery. The initial reaction to the dismal NFP report was certainly short-lived as the EUR/USD pared the decline to 1.4450, and the greenback continued to lose ground throughout the North American trade as the exchange rate settled at 1.4633 at the end of the day.
EURUSD_Trading_the_U.S._Non-Farm_Payrolls_Report_body_ScreenShot050.png, EUR/USD: Trading the U.S. Non-Farm Payrolls Report

Thursday, July 7, 2011

Good Thing that Euro Crisis is Over… Right?

by Graham Summers

The trouble with financial forecasting for Europe is that the biggest decisions are always made in the political arena, NOT economically. Case in point, Greece, which is obviously bankrupt, voted for another round of bailouts despite the fact the first round was a disaster (won’t be paid back) and the Greece economy is in ruins.

From a purely economic standpoint, it’d made a heck of a lot more sense to kick Greece out of the Eurozone (why should Germans be shouldered with Greek liabilities?). No businessman with a clue would want to support another Greek bailout. However, politics, not business rules in Europe politicians are both clueless and insanely corrupt.

This is why the Euro has held up and even rallied despite the fact the Eurozone is beyond doomed. Does anyone really believe the Euro is going to even exist in its current form a year from now? We’ve had two Greek bailouts and now Portugal is lining up for a bailout too. And what’s going to stop Spain and Italy from doing the same?

Finally… how on earth is a strong Euro good for the European economy? Why defend it? Why not let it collapse to benefit European exports? Again, politics.

This is why I’m ultrabearish on the Euro and the Eurozone. Sure, the US has horrible deficits, debt loads, and politicians. But the idiocy that occurs on this side of the pond is NOTHING compared to what happens in Europe. In the US, people at least want to be a part of the US (you don’t see New Yorkers wanting out of the union because California is bankrupt).

Europe on the other hand is a bunch of countries, who don’t even speak the same languages, have a long history of wars amongst each other, and who really don’t even like each other, joined together under a single union which most European voters now don’t even want to be a part of.

After all, Greece was bailed out in May of last year. It’s since requested an extension on paying back its bailout funds… AND asked for a second bailout… in 12 months. Spain also just tried to raise 3 billion in Euros to restructure its banks and only managed to raise a little over half of this… at spreads 10 TIMES when investors demanded the last time. Italian banks have fallen 27% so far this year on debt problems… and on and on.

Indeed, the Euro is setting up for a BIG move in the near future. The currency has formed a triangle pattern. These patterns can break out either to way, but given the problems Europe faces today, it will likely be downward. And the target for this pattern is 134-136 or so.


Bullish on Euro and Gold


Based on the contracting, coil-consolidation type patterns carved out in the euro/dollar and in spot gold since the first week of May, those two markets right now are warning us to expect potentially powerful, bullish upside resolutions. This should propel the euro/dollar to 1.51-1.53 and spot gold prices to $1590-$1620.

As for spot silver, my sense is that the bloom is off of that rose and that it will manage to climb only to the 42.00 area during the run to new highs in the euro/dollar and in spot gold.

In any case, if my pattern work proves accurate, then some "unexpected" catalyst is approaching that will attract money flows into euros (out of dollars) as well as into gold. Thus, we are bullish on the CurrencyShares Euro ETF (FXE).

Furthermore, if my works proves accurate, then the larger commodity complex in general, and oil in particular (which is priced in dollars along with gold), should benefit significantly.

Despite today's surge in the SPDR Gold Shares (GLD), the equivalent upmove to the projection in spot gold is 160.00.


Dollar Index Set to Keep Climbing With ECB Hike Priced-In


Dollar Index Set to Keep Climbing With ECB Hike Priced In body dxy7 forex
The Dow Jones FXCM Dollar Index (ticker: USDollar) added another day of gains to its recent multi-day run of gains off recent lows by 9550 which came as the index bounced off rising trend line support off early May lows. The current range bound trade suggests that the index will continue to rise back above 9700 toward 9750 and its most recent lower high. This is where things turn interesting, the series of lower highs dating back to early March have thus far done a good job of containing any move higher and it could well be that the index will fail to take out the 4th lower high and continue its lose downward trend. If the index does manage to take out the 4th lower high at 9750 only 20-ticks high up is the corrective May high resistance level at 9770 making a break above both these resistance level somewhat unlikely at this juncture.

However, with that said and done we do believe that today’s ECB rate decision will in fact be dollar positive. Firstly, the anticipated rate hike is largely priced into the market after ECB President Trichet used revealing language at the previous meeting and any indication that further hikes are far down the round will be euro negative (ie USD positive). Secondly, despite widening yield differentials the euro has been unable to mount any kind of serious assault against the buck due to its ongoing, and seemingly unending, debt crisis. Thirdly, recent data out of the EMU has been anything but positive, in fact it has been quite worrying with PMI services and manufacturing numbers slowing significantly in recent months as a ‘soft patch’ takes hold. Fourth, the ECB is at risk of appearing out of touch from it economy as it continues to raise rates despite slowing growth and pundits may punish them for this action. Fifth, when all is said and done the US economy is certainly not in tip-top shape but when compared to the euro-region it does look the stronger of the two and as such we believe that at the very least the index should continue to climb today and potentially test the lower tops and May resistance and in a best case scenario the index will break out of recent ranges to mount a serious comeback rally toward the 10,000 level.

Monday, July 4, 2011

The Dollar Speaks While Gold, Silver, Oil, & the S&P 500 Listen


Investors and traders alike were watching the action unfold across the pond earlier this week. It was seemingly a foregone conclusion that Greece would get the bailout they desired in order to prevent a potentially catastrophic default. The Greek default situation increased volatility in financial markets around the world. In addition to the Greek dilemma, the end of the 2nd quarter and the customary window dressing by institutional money managers only heightened the volatile situation.

For the past week or so, I have been sitting in cash, watching the price action and waiting for setups that have defined risk and solid rewards. With the heightened volatility I did not want to get involved because a trade in the wrong direction would wreak havoc with my portfolio. As this week evolved, the validity of those concerns was unquestionable.


Commodity investors have faced some tough price action recently as gold, silver, and oil have traded significantly lower quickly. Now that we have witnessed some heavy selling pressure set in particularly in the silver and oil markets investors want to know where price is heading in the short term.


U.S. Dollar Index

For the past several months I have been monitoring the U.S. Dollar Index futures in order to gauge the price action in commodities and the S&P 500. The Dollar is currently trading at a key support level and the price action in coming days will be telling. While I do not trade solely on analysis pertaining to the Dollar, I do look for setups where an underlying is dramatically impacted by its price movements.


When the planets align, I will take a trade with a directional bias that is supported by the price action in both the underlying that I’m trading and the U.S. Dollar’s price action as well. At this point in time, the U.S. Dollar Index is trading right at a key support level marked by the 20 & 50 period moving averages as well a recent low. The daily chart of the Powershares U.S. Dollar Index Bullish Fund UUP is shown below:
UUP Daily Chart
Chart12 economy
Gold & Silver

The recent bounce higher in the U.S. Dollar has been a factor in pushing gold, silver, oil, & the S&P 500 lower. Silver and oil were impacted in the harshest manner, but all four asset classes were negatively impacted. Precious metals tend to weaken during the summer and then pick back up in the fall. However, the selloff in silver the past few months has been breathtaking. For precious metals bulls who entered silver late in the rally the only outcomes were dismal. Late comers to the silver bull market were either stopped out or are currently experiencing significant pain.


While I remain a longer term bull as it relates to precious metals, in the short term I expect lower prices to continue. A major factor in my analysis stems from a longer term standpoint; the U.S. Dollar has likely put in an intermediate to long term low. There are a variety of reasons as to why, but suffice it say that from a market cycle standpoint the Dollar has likely achieved a major low and a reflex rally is likely.


Issues in the Eurozone are far from over and as time passes I expect the impact of fiscal issues rising in countries like Ireland, Portugal, and Spain to have a major impact on U.S. Dollar prices. If the sovereign fiscal issues in Europe result in a default or even a more mild technical default, the impact will likely be bullish for the U.S. Dollar.


The daily chart of the SPDR Gold TR ETF GLD and the Ishares Silver Trust SLV shown below illustrate the key areas which may be tested before the bull market in precious metals continues:
GLD Daily Chart
Chart22 economy
SLV Daily Chart
Chart32 economy
I am of the opinion that if precious metals investors are patient, an outstanding buying opportunity will present itself in both gold and silver in weeks ahead. Looking at the daily chart of the two shiny metals and identifying key levels that make sense to acquire positions is important in the trade planning process.


I like to have a trading plan in place should my expectations unfold because it removes emotion from my trading. Planning a trade and trading a plan are extremely helpful when investing in volatile markets like silver and gold. In the longer term, I continue to believe that gold and silver will shine, but in the short term more price weakness may be ahead.


Crude Oil

I am a long term gold and silver bull, but the single asset class that I am the most bullish about is energy. Oil prices in the long term have only one direction to go – HIGHER. I realize that a slowdown in the economy will put downward pressure on oil prices, but as the world’s demand for oil increases and the supply level plateaus or decreases oil prices will be forced higher. If the Dollar does rally as I expect, oil prices would likely be negatively impacted and a buying opportunity would be forged.


The daily chart of the United States Oil Fund ETF USO is shown below with my future price expectations and current key price levels illustrated:
Oil Daily Chart
Chart42 economy
S&P 500

The S&P 500 is in a very tricky spot for traders. Right now price action is testing the underbelly of a major descending trendline on the daily chart shown below:
SPX Daily Chart
Chart5 economy
However, if we take a look at a weekly chart note the massive head and shoulders formation that many traders have totally missed. A rally to the S&P 500 1,340 price level would complete the pattern. While head and shoulders patterns have failed several times in recent history, this is a major head and shoulders pattern on the weekly chart which holds more credence than shorter time frames such as the hourly or even the daily charts. The weekly chart of SPX illustrates the head and shoulders pattern.
SPX Weekly Chart
Chart6 economy
In the short run I think the S&P 500 can work higher, but if I’m right about higher prices for the U.S. Dollar in the future I expect to see much lower prices in the S&P 500 in the intermediate term, particularly if the weekly head and shoulders pattern plays out. If the S&P 500 struggles to breakout above key resistance levels, I will be of the opinion that the bear may have stopped hibernating and an impending recession may be thrust upon us in short order. There are signs pointing in that direction, but right now it remains too early to call.

Conclusion

In closing, my analysis reveals that the U.S. Dollar is poised to push higher, particularly if current support holds. If the Dollar can push above key resistance levels overhead, I expect the resulting price action in gold, silver, oil, & the S&P 500 to be dismal for the bulls.

I will be watching the Dollar closely looking for clues about price action. If I’m wrong and the Dollar breaks to new lows I would expect a massive rally in precious metals, energy, and domestic equities. With the recent price action that we have seen in the U.S. Dollar, I find it much more likely that the U.S. Dollar extends higher in coming weeks. As usual, time will tell.

Follow Us