Showing posts with label commodity article. Show all posts

Thursday, February 23, 2012

A Golden Buying Opportunity


The lightness of the correction in gold is very bullish for the metal as well as its ETF vehicles, and as this drought ends, the next big leg up may soon begin.
The two-week pullback in gold futures from the early February highs was very mild, as it also was in the most popular gold ETFs .
With less than a 3% correction from the highs, last week’s close suggested that the correction might be over. Tuesday’s strong opening and the close above the recent swing high supports this view.
The weekly and daily chart formations have indicated for several months that the drop from the early September highs was just a pause in the uptrend. Thesecontinuation patterns are one of my favorite formations to trade.
The completed flag formations on both the futures and ETFs have initial upside targets well above the September 2011 highs. Therefore, the two key gold ETFs, the Spyder Gold Trust (GLD ) and the iShares Gold Trust (IAU ), both look attractive for new purchases, as the recommended stops make the risk very manageable.
chart

Click to Enlarge
Chart Analysis: The weekly chart of the gold futures shows the completion of the flag formation (lines a and b) in the latter part of January.
  • The tight weekly ranges and triple “dojis” made a deeper correction less likely
  • Once above the 2011 highs at $1,942, the 127.2% upside target is at $2,035
  • As I noted in my article on longer-term Fibonacci projections, the next “major target is $2,274”
  • The weekly on-balance-volume (OBV) closed last week very strong, as it shows a bullish zig-zag formation
  • The weekly OBV is leading prices higher, even though the daily OBV (not shown) is still below its WMA
  • There is short-term support for the April futures at last week’s low of $1,706, with more important levels at $1,652
The daily chart of the Spyder Gold Trust (GLD ) shows the completion of the flag formation, lines d and e.
  • There is near-term chart resistance at $173.80, and then further levels in the $175.40 area
  • The flag formation has a 127.2% Fibonacci retracement target in the $196 area
  • The daily OBV confirmed the price breakout as it overcame its downtrend, line f. The OBV is still below its WMA but has turned higher
  • Short-term support now sits at $170.75 to $169.50, with more important levels at $166
  • GLD’s recent correction held well above the 38.2% Fibonacci retracement support at $162.40, as the recent low was $166.17
  • The breakout level (line d) and stronger support in the $158-$162 area
chart

Click to Enlarge
The hourly chart of GLD shows the completion of the “flag formation” (lines a and b) with the gap higher opening Tuesday.
  • This formation has a short term 127.2% Fibonacci retracement target at $172.60
  • The hourly OBV confirmed Tuesday’s price action as it overcame the resistance at line c
  • The gap support is now in the $168.33 to $169.59 area
Investors should also consider the iShares Gold Trust (IAU ) which has a slightly lower expense ratio than GLD. The daily chart shows that after completing the flag formation, lines d and e, the pullback has also been slight.
  • There is next resistance in the $17.60 area, and then at the September high of $18.63
  • The 127.2% Fibonacci price target is at $17.68
  • The daily OBV has turned up and a move back above its flat WMA will confirm that the correction is over
  • There is minor support now at $16.60-$17 with stronger at $16.30
What it Means: The shallowness of the correction in gold and the gold ETFs is typically very bullish, as it suggests that prices can accelerate to the upside from current levels.
The previously recommended buying zones were not hit, and stops not under the recent lows should hold.
How to Profit: For the SPDR Gold Trust (GLD ), go 50% long at $170.44 and 50% long at $169.12, with a stop at $164.88 (risk of approx. 2.9%).
For the iShares Gold Trust (IAU ), go 50% long at $17.08 and 50% long at $16.86, with a stop at $16.32 (risk of approx. 3.8%).

Thursday, February 16, 2012

Orange juice volatility, not what you think

Trading Places
Trading Places (Image via RottenTomatoes.com)


It is New Year’s Eve. The Harrisburg Express speeds from Philadelphia to New York City. It thunders down the rails carrying passengers Inga from Sweden, Naga Eboko from Cameroon, Lionel Joseph, an Irish priest, a gorilla and Beeks, with his briefcase. The case contains the crop report for orange juice.

Possibly every single reader of Futures can remember every major scene from the iconic movie "Trading Places." Indeed, it made many of us take up trading futures and commodities. We’ve all likely said some variation of the great line: "Pressure? Here it’s kill or be killed. Make no friends and take no prisoners. One minute you’re up half a million, the next — boom! — your kids don’t go to college and you’ve lost the Bentley!"

"Trading Places" culminates in a wonderful scene in the frozen concentrated orange juice futures pit in New York. Back in the old days, all trading was pit trading. It was hectic and exciting. How exciting? There were times in the 1980s when, in an effort to get an edge, the runners were on roller skates.

The upshot in the movie was the main characters, Winthorpe and Valentine, waiting until Wilson drove the price of orange juice way, way up. They then sold into the market, the Secretary of Agriculture announced the real crop report and the price plummeted. Our heroes cover their shorts and make millions, putting the Dukes into the poorhouse at the same time. It’s a fun story that defined trading for a generation. The movie never gets old.

It also has some good lessons, particularly for the orange juice trader. One topic is the issue of volatility and some widely held beliefs. Does orange juice really swing wildly in January because of the crop report? More important, if such volatility does exist, can we use it to our benefit?

To answer these questions, the monthly range of orange juice prices was recorded starting with January 1996. The monthly range is defined as the high price of the month minus the low price. The closing prices were disregarded for the purposes of this test. Through Nov. 30, 2011, there were 191 pieces of data. The highest trade during the sample period was $2.0940, observed during the month of March 2007. The lowest price paid was $0.5420 in May 2004. The range of the orange juice contract, therefore, is $2.095 – $0.542, or $1.553. In percentage terms, the high is an increase of 286.7% over the low price.

In performing this test, it is important to make uniform comparisons. A 10¢ range with a low of 70¢ is not the same as a 10¢ range when the market is trading at $1.65. The former is a 14.28% range, which is far more volatile than the 6.06% range of the latter. Consequently, all of the range values were converted into percentages by dividing the range by the low price to normalize them across the sample universe. With these data, it now is possible to construct a meaningful statistical test.

If the calendar plays a significant role in orange juice price volatility, we would expect certain months to have much more volatility than others. To test this, we use an Analysis of Variance with an F-test statistic. The null hypothesis is, there is no effect.

For those whose statistics knowledge is a bit rusty, the F test examines different dependent values and assumes there is no significant difference between them based upon the observation of independent values. In other words, all of the fixed variables (that is, the different calendar months) will produce essentially the same dependent observations (that is, the average volatility during the month). The null hypothesis of the test is there will be no statistically significant difference between the mean volatilities of any of the months. The alternate hypothesis is that, yes, there is. Although the F statistic measures the variance, if the variance is low, it follows the means are essentially similar. If the variance is high, the mean volatility must be significantly different among the 12 months.

The Analysis of Variance test has 12 independent variables and 16 observations in each month. (Although December is missing for 2011, it is easy to perform this slightly unbalanced test using any statistical software package.) The F statistic will have 11 and roughly 180 degrees of freedom. This is a powerful test for discovering patterns, and we can have much confidence in its results.

The average volatility for each month is shown in "O.J. monthly" (below). The results of our Analysis of Variance test was p<0.00001. Essentially, there is virtually no significant chance that the means of the months are equal. We can conclude with great confidence that the calendar does indeed play a major role in the average volatility experienced in the orange juice market over time.

Click to enlarge

It is essential to realize that this does not prevent high volatility from taking place in any month. The test simply compares the averages and finds there is more variation between the months than within the given months.


In a blow to Hollywood, and perhaps running against the assumptions of most orange juice traders, the "Trading Places" months of December and January were not the top of the volatility list. Examining the table, it is easy to discern that October, August, January and December experience greater than average volatility, but October is much higher than December. Those four months account for 17.17% of the volatility of the orange juice market.

March, April and November are relatively quiet months by comparison, experiencing only 12.3% of the volatility. It may be concluded that the best trading opportunities are likely to be presented when volatility is greatest. It might also be concluded that the greatest risk occurs at those times as well. Short-term traders might find lots of trading opportunity in orange juice during October or August. March and April may be too quiet, but also present less risk.

On average, volatility throughout the year is 14.64%. As a side note, we can examine if extremely low volatility has been a harbinger of any movement. Indeed, it turns out it is, statistically speaking. When volatility in any month dropped below 7.25%, the market often changed direction within the three months thereafter. Often, the low volatility immediately preceded a major market shift.

For example, in December 2006, the monthly low was $1.96 and the high was $2.0940 (see "Calm before the storm," below). This range of 13.4¢ was only a 6.8% swing for the month. Given December is expected to be a pretty wild month, the volatility was less than 45% of what we might normally see. January 2007 saw a major drop in the market, with volatility falling to 13.35%. The all-time high was hit only two months later in March 2007, and then the orange juice market dropped precipitously, falling to $1.1060 in the next six months.


Similarly, in April 2004, the volatility dropped to 4.42% and the market low for the month was $0.5580. The following month, orange juice bottomed at $0.5420 before beginning its wild climb into the 2007 high. Several other examples of such predictive low-volatility activity may be found.

The lessons of the orange juice market may be extrapolated to other markets and shorter time frames. The trader easily can test different hours of the trading day to see if certain periods present higher volatility than others. Similarly, it may be tested to see if sudden contraction in the range of any time bar vs. its historical norm predicts a sudden change in market direction. After all, the goal, as Valentine and Winthorpe say at the end of the movie is: "Looking good; feeling good!"

See the original article >>

Saturday, September 24, 2011

THE BIGGEST BUBBLE OF ALL-TIME

By Randall Wray

Sorry, this is a day late (but hopefully not a dollar short).

Back in fall of 2008 I wrote a piece examining what was then the biggest bubble in human history: http://www.levyinstitute.org/pubs/ppb_96.pdf.

Say what? You thought that was tulip bulb mania? Or, maybe the NASDAQ hi-tech hysteria?

No, folks, those were child’s play. From 2004 to 2008 we experienced the biggest commodities bubble the world had ever seen. If you looked to the top 25 traded commodities, you found prices had doubled over the period. For the top 8, the price inflation was much more spectacular. As I wrote:

“According to an analysis by market strategist Frank Veneroso, over the course of the 20th century, there were only 13 instances in which the price of a single commodity rose by 500 percent or more. For example, the price of sugar rose 641 percent in 1920, and in the same year, the price of cotton rose 538 percent. In 1947, there was a commodities boom across three commodities: pork bellies (1,053 percent), soybean oil (797 percent), and soybeans (558 percent). During theHunt brothers episode, in 1980, silver prices were driven up by 3,813 percent. Now, if we look at the current commodities boom, there are already eight commodities whose price rise had reached 500 percent or more by the end of June: heating oil (1,313 percent), nickel (1,273 percent), crude oil (1,205 percent), lead (870 percent), copper (606 percent), zinc (616 percent), tin (510 percent), and wheat (500 percent). Many other agricultural, energy, and metals commodities have also had large price hikes, albeit below that threshold (for the 25 commodities typically included in the indexes, the average price rise since 2003 has been 203 percent). There is no evidence of any other commodities price boom to match the current one in terms of scope.”

Now here’s the amazing thing about that bubble. The staff of Senator Joe Lieberman and Representative Bart Stupak wanted to know whether the bubble was just due to “supply and demand”. Relying on the expertise of Frank Veneroso and Mike Masters (two experts on the commodities market), I was able to conclude beyond any doubt that it was a speculative bubble driven by a “buy and hold” strategy adopted by managers of pension funds. Hearings were held in Congress, with guys like Mike Masters testifying as well as representatives from the airlines and other industries.

The pension funds panicked, realizing that their members would hold them responsible for exploding prices of gasoline at the pump. Pension funds withdrew one-third of their funds and oil prices fell from about $150 per barrel to $50. If you want to read the detailed analysis, go to my paper cited above—it has to do with commodities indexes, strategies pushed by your favorite blood sucking vampire squid (Goldman Sachs), and futures contracts. It gets wonky. To make a long story short, the bubble ended in fall of 2008.

But then the crisis wiped out real estate markets and the economy. Managed money needed another bubble. They whipped up irrational fears of hyperinflation that supposedly would be caused by Helicopter Ben’s QE1, QE2, and the newly announced QE3. Better run to good “inflation hedges” like gold and other commodities. That did the trick. The commodities speculative bubble resumed.

And boy, oh boy, what a boom. An April report by expert Jeremy Grantham looks at the last decade’s bubble in commodities; Frank Veneroso expands upon that in a more recent report. Here’s the elevator speech summary. Take the top 33 commodities that are globally traded—everything from gold and oil to to rubber, flaxseed, jute, plywood, and something called diammonium phosphate. Over the past 110 years, an index price of these 33 commodities has declined at an annual rate of 1.2% per year. (Sure there are variations across the commodities—this is the average. And so much for inflation hedges. Commodities prices fell—they did not keep up with inflation. If you liked negative returns, commodities were a good bet.) Although demand for these 33 commodities has increased a lot over the century, new production techniques plus successful exploration has resulted in a declining price trend.

Further—and this is a bit surprising—deviations from the trend follow a normal distribution (you learned about this in high school; it is a bell curve with nice properties; chief among these is the finding that about 68% of outcomes fall within one standard deviation; about 95% fall within two standard deviations (once a generation); and you’ve got just about a snowball’s chance in hell of finding outcomes that are three or four standard deviations from the mean).

But what is more surprising is that over the past decade, the price rises you find for these 33 commodities are just about beyond the realm of possibility—2, 3, and 4 standard deviations away from trend. It is a boom without any precedent. Quite simply, nothing even close has ever happened before, in any market, including hi tech bubbles and real estate bubbles.

By now you’ve all read about black swans with fat tails—a reference to supposedly “unexpected” and highly improbable default rates on subprime mortgages and other toxic waste assets. (Way out the normal distribution’s “tail”.) As an insider quipped, you had once in 100,000 year events happening every day. But that is misleading. These were junk assets that from the get-go had nearly 100% probabilities of default—NINJA loans and so on. The models were flawed, indeed, fraudulent. That was all a scam. Those weren’t black swans with fat tails—they were Hindenburg blimps filled with explosive hydrogen just waiting for someone to light a cigarette.

By contrast, in the case of commodities, this is real stuff (not IOUs of deadbeats with no prospects). Barrels of oil that someone really wants. Corn to turn into pig and steer fat, or fuel for Midwest automobiles. Or gold to be hoarded by the University of Texas. There really is a demand for it; and someone produces it.

Yes, commodity bubbles happen, but eventually reality sets in and brings the price back down to reality. You don’t get 3, 4, and 5 standard deviation events. A four standard deviation price rise falls outside 99.994% of all outcomes—one in 100,000 years; a five standard deviation price rise is about one in 2 million years. That pretty much covers the time since our ancestors beat things with big sticks.

But wait a minute. The standard deviation of price rises for iron (5), coal, copper, corn and silver (4), sorghum, palladium, and rubber (3.5), flaxseed, palm oil, soybeans, coconut oil, and nickel (3), and so on down through jute, cotton, uranium, tin, zinc, potosh and wool (2) are so unlikely that they quite simply could not have happened. Individually. Together, the likelihood that we’ve got an unlikely boom in almost all of the 33 commodities? All at the same time? Impossible. Cannot happen. Not in the lifetime of our sun, let alone our planet.

But it did.

Why? China. Peak oil. Supply disruptions. Some markets cornered by speculators. Market manipulation by oligopolistic suppliers.

Yes, OK, those have played some small role. But remember, we are in the worst global slowdown since the 1930s. I will not go through all the data, but demand for most commodities is actually slumping. For many there is substantial excess supply. And China wants to slow. China is still largely a socialist society. China basically does what it wants to do. China will slow.

And yet the prices rise far beyond anything that has ever happened before. Beyond anything that can happen.

Why? Financialization. Just as homes became financialized (in many ways, including serving as the collateral for “ATM” cash-out home equity loans), commodities became thoroughly financialized. (So did healthcare and death, with peasant insurance and death settlements—topics for another day.)

Here’s the reason. Believe it or not, commodities markets are tiny; except for soy, oil, and corn they are smaller than tiny. Managed money is huge—tens of trillions of dollars floating around the world looking for high returns. US pension funds alone are three-fourths of US GDP–$10 trillion give or take. If you put even a fraction of managed money into commodities index funds, you blow up the prices.

The weapon of choice is the futures contracts—essentially you buy commodities for future delivery (a couple of months from now). When they mature, you do not take delivery but instead sell the contract to someone who actually wants the commodity, and roll into another futures contract. This is what pension funds, and so on, have been doing. If prices rise, you always win on the roll (sell for more than you paid).

The typical argument is that this cannot affect prices since for every buyer (long position in the contract) there must be a seller (short position). The balance between these two keeps prices in line with “fundamentals”.

In normal times, yes, more or less. But here’s the deal. What if I supply diammonium phosphate (whatever the heck that is) and you are speculating that the price will rise. You and every other pension fund and client of Goldman Sachs. I want to lock in the expected price rise, so I am a happy seller of future commodities. If prices go down, I do not get hurt—I locked in the price rise and have the right to sell the commodity at the higher price. And so even as prices leave all fundamentals, the producers continue to sell futures contracts to lock in higher prices.

I win, you win, we all win with price appreciation.

Now, to be sure, the whole thing is going to blow up, in what Frank Veneroso calls a commodities nuclear winter. As prices rise, consumption of the commodities falls (as we are already observing) both through substitution and through conservation. At the same time, additional supplies come on line. Real world suppliers feel the imperative to slash prices to have some actual real world sales. They cannot forever live in never-never land with rising prices and collapsing sales.

There are many shoes that will drop, bringing back the Global Financial Crisis with a vengeance. Commodities crash, default by a Euro periphery nation, failure of a Euro bank, or the closure of Bank of America or Citi. All of these are likely events, less than one standard deviation from the mean; probably all of them will happen within the next year.

No matter what the triggering event is, that commodities nuclear winter will happen.

Soon.

Sooner than later.

Wednesday, September 21, 2011

Morning markets:crop prices get steer from China import data

by Agrimoney.com

Has China bought corn? Or will harvest pressure come to bear on Chicago futures? Did Washington's announcement of a poultry trade battle against Beijing put Chinese buyers off?
"Not sure where this may lead, but we don't need to start a trade war with those folks," Mike Mawdsley at Market 1 said.
Corn futures, as in the last session, edged higher in opening deals only to fade, even by 07:40 GMT (08:40 UK time) as traders awaited answers.
"The market will be watching closely to see if the [US Department of Agriculture's] daily reporting system ends up releasing any US corn sales as we progress through the balance of the week," Jon Michalscheck at Benson Quinn Commodities said.
'$7-a-bushel magnet'
An early rise was in line with the broader market mood, with Tokyo shares closing up 0.2%, Seoul stocks up 0.9% and Shanghai shares trading up 2.7% in late deals, amid hopes for further progress in settling the eurozone debt crisis, although with the prospect of a conclusion to the US Federal Reserve's monthly monetary policy meeting injecting a note of caution.
The dollar and Brent crude were little-changed.
And for corn, there was an upward pull from the options market.
"October serial options will expire on Friday and that could be providing a magnet towards the $7.00-a-bushel level on the December contract," Mr Michalscheck said.
"The $7.00 strike price on the puts happens to have the largest amount of open interest going into today's session at 14,579 contracts and it also happens to be at the 50% level of the 108,945 total October puts that were still open as of today."
In short, all else being equal, the vote from options markets looks to be $7-a-bushel corn.
'US origin competitive'
A purchase by South Korea's largest feedmaker, Nonghyup feed, of 85,000 tonnes of corn, besides, 20,000 tonnes of soymeal, was also viewed positively.
"US origin was competitive. This was seen as a test for the competitiveness of US corn into Asian markets and indicates that the export demand destruction story from higher prices is not yet occurring," Paul Deane at Australia & New Zealand Bank said.
Furthermore, as a small insight into China's corn dynamics, customs data showed the country importing 244,500 tonnes of the grain last month, up from 172,600 tonnes in July.
Still, as Mr Mawdsley noted, "with harvest at our doorstep, it isn't the time of year to mount a big rally". The spike in supplies produced by harvests tend to press on crop prices.
There was enough uncertainty around to drag Chicago's December corn contract down 0.2% to $6.89 a bushel.
'Potentially massive wheat for corn substitution'
That put a dampener on other crops too, with Chicago wheat for December losing early gains to show a loss of 0.25 cents, at $6.74 ¼ a bushel, amid further mixed thoughts on prospects for sowing the southern US hard red winter wheat crop.
"The decent rains that fell in the eastern region of the hard red winter wheat area will allow for more planting progress this week, but many of the western areas will remain bone dry," Benson Quinn's Brian Henry said.
"However, the $8.62-a-bushel hard red winter wheat insurance price will entice producers to plant wheat, if at all possible."
Luke Mathews at Commonwealth Bank of Australia noted "reports of potentially massive wheat for corn substitution in China", encouraged by price differentials.
China's appetite
Soybeans maintained, just, a grip on positive ground, adding 1.5 cents to $13.39 ½ a bushel for November delivery, amid hopes for Chinese demand (chicken dispute or not).
Such hopes were whetted by Tuesday's announcement of China's purchase of 120,000 tonnes of US soybeans.
That said the Chinese customs data showed a slip in the country's imports of the oilseed last month, to 4.51m tonnes, from 5.35m tonnes in July, although it was South American supplies which took the hit, with trade from the US still low ahead of harvest.
Adding some support to sentiment was the first positive close on Tuesday in seven sessions by fellow oilseed canola in Canada, adding Can$7 to Can$555.60 a tonne for November delivery.
In favour, or not
In Kuala Lumpur, palm oil felt the heat from the China data, which showed imports slipping to 511,800 tonnes last month, from 595,000 tonnes in July (albeit remaining higher year on year), with Malaysia bearing the brunt of the slowdown.
Palm oil for December slipped 0.3% to 3,059 ringgit a tonne.
However, for cotton, the data showed imports rising above 207,000 tonnes, up 50,000 tonnes from July.
December cotton added 0.6% to 106.30 cents a pound in New York, for December delivery.


Food prices 'at risk of spike higher', says IMF

by Agrimoney.com

Food commodities escaped a downgrade by the International Monetary Fund to its outlook for raw material prices, with the "precarious" balance in crop supplies leaving markets open to "further price spikes".
The IMF, in a twice-yearly report, said that price risks in the broad commodities sector "seem more balanced" than both a year ago and in April, when the institution published its previous briefings.
"Downside risks to global growth have risen," the fund said, reducing to 4.0% its forecast for world economic expansion both this year and in 2012, cuts of 0.3 points and 0.5 points respectively.
However, for food prices, the "balance of risks… is still to the upside" thanks to the thin supplies of some farm commodities, notably corn.
"Given low global inventory levels for many crops, and significant adverse shocks… have the capacity to spike food prices higher," the fund said.
'Most immediate risk'
The "most immediate risk" to hopes for lower prices was of further poor weather, with the US extremes of a wet spring and hot summer following droughts in Europe and China.
"The recent pattern of extreme weather in major crop-growing regions seems to be continuing," the report said.
Even "modest" further cuts to crop production forecasts "could trigger a large price response, cross-commodity spillovers, and higher volatility".
And, unlike in markets for some other commodities, "demand growth momentum remains strong", with consumption of major crops set to grow by 2.25% in 2011-12, "considerably above the 20-year average".
"Rapid increases in emerging market economy food consumption are showing no signs of moderating," the fund said, noting the impact of higher incomes encouraging a shift to meat.
'Further price spikes'
The IMF said its central forecast was for food prices to "decline modestly, but remain high in real terms" through 2012, assuming a return to normal weather conditions and the absence of a rise in energy prices which would boost biofuels demand.
However, a "combination of low inventories, volatile weather, and demand uncertainties related to China and biofuels raises the prospect of further price spikes over the next 12-to-18 months".
Such an outcome was already being reflected into values of derivatives such as futures, in which, according to IMF analysis, investors were already pricing in a higher-than-average probability of a price spike over the next nine months.


Monday, September 12, 2011

Morning markets: Wasde bolsters crops as oil and shares slip

by Agrimoney.com

The September 11 commemorations stole the headlines this weekend, but they weren't the only sobering news in town.
In Europe, fears for Greece's debts got a boost from growing talk among German politicians that default may be in order.
Furthermore, in France, banks such as Credit Agricole and BNP Paribas, which are viewed as particularly exposed to Greek debt, are reportedly bracing themselves for a potential credit rating downgrade by Moody's.
With analysts hardly raving about US economic prospects either, Tokyo's Nikkei share index tumbled 2.3% to a two-year low. Wall Street stocks are expected to open lower later on too.
New York crude fell 2.1%, copper eased, the dollar gained 0.5% against a basket of currencies, hitting its highest since March – markets had a distinctly "risk-off" tone.
Data later
…which might have extended to crop markets were it not for two factors.
The first is the prospect later of the US Department of Agriculture's monthly Wasde report on world crop supply and demand which is expected to cut estimates for the domestic soybean and, in particular, corn crops, following a summer long on heat and short on rainfall.
Investors have been increasingly cautious ahead of data expected to move markets.
"Is the high in" for corn and soybean futures, Mike Mawdsley at Market 1 asked.
"No one knows for sure, but the USDA report will mostly likely give traders some fodder, bullish or bearish."
'Strong cold front'
The second is the prospect of further adverse US weather, an early frost, which showed no signs of letting up.
"Clearly the main issue this week is going to be the strong cold front which is going to bring a real blast of autumn into a good portion" of central and eastern America from around Thursday, weather service WxRisk.com said.
The high pressure formation "will be the largest and strongest since May".
"The frost risk for North Dakota, South Dakota northern Iowa Minnesota and Wisconsin is pretty high."
Chinese imports
There were some Chinese import data for August, released on Saturday, for traders to factor in too.
For soybeans, of which the country is the top importer, imports fell 15.7% month on month to 4.51m tonnes, although the data was less poor on vegetable oil, with a drop of 1.4% to 690,000 tonnes.
Overall Chinese soybean imports this year have reached about 34m tonnes, down about 1.5m tonnes on the same period in 2010.
And there is also mounting talk over the degree at which South American growers will switch sowings to corn, thanks to high prices of the grain.
"Surging corn prices have raised concerns farmers in the US and South America may cut soybean plantings in favour of corn," Lynette Tan at Phillip Futures said.
'Demand remains stagnant'
Still, with the Wasde ahead, Chicago corn moved all of 0.25 cents, downward, to $7.36 ¼ a bushel for December delivery, as of 07:50 GMT (08:50 UK time).
Soybeans added 0.3% to $14.30 ½ a bushel for November.
That left wheat the best performer of the Chicago majors, adding 0.7% to $7.34 ½ a bushel for December delivery, looking for its first positive close in four trading sessions.
"The bulk of the weakness [in wheat] has stemmed from upward momentum in the dollar, but overall demand for spring wheat and soft wheat remains rather stagnant," Brian Henry at Benson Quinn Commodities said, also flagging the competition from Russian exports.
"There is talk of Black Sea wheat and corn pencilling a profit into the [US] south east."
Luke Mathews at Commonwealth Bank of Australia held out hope for wheat futures,
"A strong [Wasde] report may see prices rebound, particularly given that drought conditions continue across the US Great Plains, negatively impacting hard red winter wheat planting," he said.
Thai rains
Elsewhere, dry weather in the drought-hit US South over the weekend, and estimates from Pakistan that some 2m bales may have been lost to heavy rains, allowed a rebound in cotton, which added 0.8% to 112.78 cents a pound in New York, for December delivery.
In Asia, palm oil picked up, adding 0.7% to 3,072 ringgit a tonne in Kuala Lumpur for November delivery, on the back of firmness in oilseed peer soybeans.
But rubber lost further ground, shedding 1.7% to 362.50 yen a kilogramme, well below the February high of 535.70 yen a kilogramme.
Still, the tyre ingredient's "downside is limited due to tight supply amid heavy rain in Thailand, wintering in parts of Indonesia and stock replenishing in China", Ker Chung Yang at Phillip Futures said.


Thursday, September 1, 2011

“COMMODITY PRICES SEEM MUCH TOO HIGH”

by Cullen Roche

I rarely use technical analysis in my work, but there are times when a picture really is worth a thousand words. Sometimes a chart can help an investor to visualize market relationships better than raw data can. In this way, technical analysis can be particularly helpful in gauging risks and potential mean reverting situations. One such potential mean reverting situation is the long-term outlook for commodity prices. This is, in my opinion, particularly important given Wall Street’s recent attempts to push the “commodities are an investment class” theme.

As I’ve previously mentioned, betting on the actual commodities is never an investment. In fact, over the long-term, commodities have very poor real returns. Rather, an investor who is looking to benefit from a commodity bull market or the negative correlation of some commodities, is better off investing in the ingenuity of the corporations that benefit from these markets. In this manner, you are actually buying human ingenuity rather than buying physical commodities which are the equivalent of selling human ingenuity.

In a recent strategy note, analysts at Societe Generale discussed the long-term surge in some commodity prices and why it could be foreshadowing of a mean reverting event:
“Commodity prices seem much too high as economic growth is slowing. Over the past three years, all commodities have touched historical highs. The most recent high seen for Gold, in August, was sparked by forex fears. Oil prices used to be very sensitive to US growth, but things are different this time, as emerging market demand partly outpaces that of the US, maintaining global oil demand at high levels. But, now the surge in Gold suggests that markets are looking for safe haven investments, as was the case in the 1930s and the 1970s. Hence, financial markets begin to doubt that the current forecast for global growth of 4% pa is sustainable, thus, commodity prices seem much too high at this stage of the economic cycle.”
Now, I don’t like lumping gold into this analysis because I think gold has some intangible components that make it more unique than other commodities, but I am generally skeptical of the idea that broad commodities are going to sustain high real prices in the same manner that other asset classes have historically. As Jeremy Grantham believes, this time would truly have to be different in order for this to persist. Of course, this is not my way of saying that one should go out and short all commodities. Quite the contrary. It just means that you have to recognize that you’re speculating when you buy raw commodities and if you’re trading that might suit your needs perfectly fine. If instead, you are an investor with a long-term diversified focus you would be wise to focus on the underlying ingenuity that benefits from commodity markets by investing in the actual corporations themselves. Don’t fall for Wall Street’s latest sale’s pitch which is trying to push investors into physical commodities of all sorts. History is not on your side.

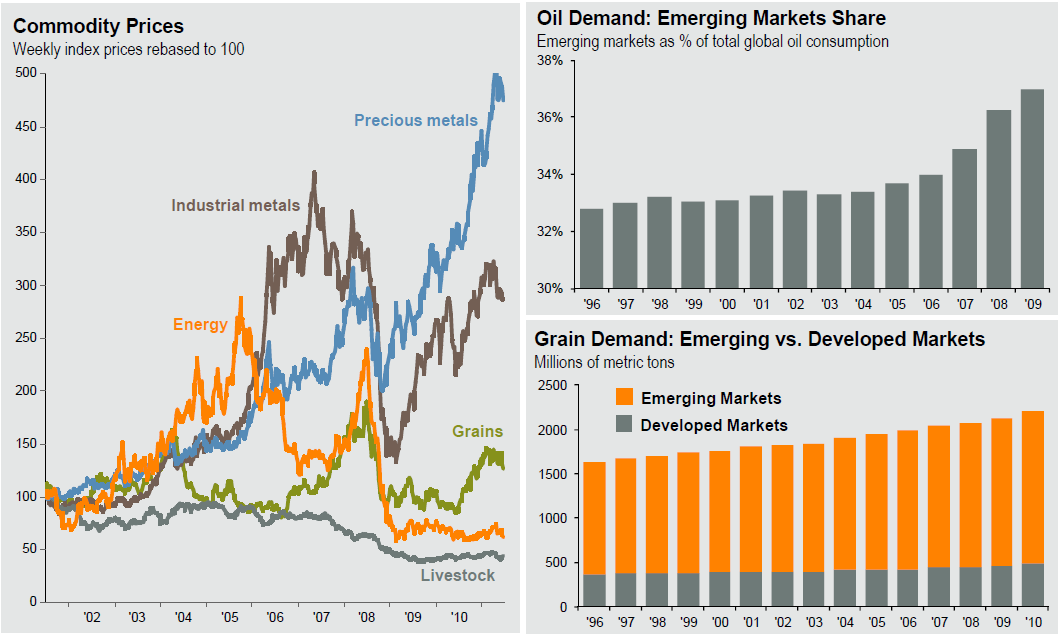
Global Commodities

By Barry Ritholtz

Given the spike in copper and oil (but not gold), perhaps its time to take a look this long term chart of commodities:
>


Friday, August 19, 2011

Morning markets: crop retreat slows in line with shares, oil

by Agrimoney.com

The declines in share markets keep on coming.
The turn of Asian shares to sit on investors' weighing machine produced more of the declines which marred their Western peers on Thursday.
There was some sign of assets disappearing down the toilet less fast than in the last session, although it might not appear so from the 6.2% slump in South Korea's Kospi index.
Tokyo stocks shed a more modest 2.5%, Shanghai stocks 1.1%, and the dollar added a less severe 0.2%. New York crude lost a less-panicky-looking 1.7% to $81.02 a barrel.
'Caught in the storm'
That, of course, was hardly good news for food commodities, as Luke Mathews at Commonwealth Bank of Australia noted, saying that "the biggest skeleton in the grains' closet is the influence of financial markets.
"The risk of a US and European recession has intensified. If global financial markets spiral out of control, agricultural commodities, no matter how tight their supplies are, will get caught in the storm," he said.
So, as might be expected, farm commodities headed downwards too although, mirroring broader markets, they were generally less enthusiastic in retreat this time – one notable exception being soybeans.
Chicago soybeans, which proved remarkably resilient in the last session, were additionally weakened by further news on selldowns by China, the top importer, of state reserves.
China plans to auction 4m tonnes of soybeans to edible oil groups such as Cofco and Wilmar's Yihai Kerry Group, for a price of about 3,500 yuan, some $550, a tonne the 21st Century Business Herald said.
(Longer-term, the auction might provide market support, it that it will leave China with, reportedly, only 1.4m tonnes of state reserves left.)
IL and IA
Even so, the oilseed's decline was hardly catastrophic for bulls, at 0.6%, leaving the November lot at $13.52 ¾ a bushel as of 07:00 GMT (08:0 UK time).
Weather in the US remains reasonably supportive.
"Soybean crop conditions and production are of concern, with key states of Illinois and Iowa unusually dry, with weekly US drought monitor expanding dry areas to cover all but the northern quarter of Illinois and northern half of Iowa," Kim Rugel at Benson Quinn Commodities said.
"Recent rains have not been able to make the leap over the river into Illinois," he said, while adding that forecasts for the weekend and next week predicted moisture, "which if realised should reduce stress of pod-filling soybeans".
And, bottom line, "grains still have good fundamentals", Mike Mawdsley at Market 1 said.
'Big unknown'
There is of course, "a big unknown as to just what do we have for a crop out there for corn and soybeans", which may gain some answers in next week's ProFarmer crop tour.
"All eyes and ears will be waiting to see and hear what they are finding," Mr Mawdsley said.
And, for corn, there is particular interest in Illinois and Iowa too, with Benson Quinn noting that "various trade houses have been questioning as to whether the US Department of Agriculture August projected yields for Illinois and Iowa will hold up of 170 and 177 bushels per acre respectively".
"They are both well above last year's levels of 157 and 165 bushels per acre."
Chicago corn limited its losses to 0.4% for December delivery, taking the lot to $7.10 ¼ a bushel.
More rain in Aus
And that helped wheat, a relatively poor performer last time, limit its decline to 0.6%, to $7.03 ¼ a bushel, for Chicago's September contract.
Minneapolis wheat eased 0.3% to 9.08 ½ a bushel for September, again gaining succour from a delayed US spring wheat harvest.
As an extra downer to wheat, reports continue to come of healthy rains in Australia, where eastern dryness had begun to raise eyebrows.
Both Luke Mathews at CBA and Australia & New Zealand Bank's Paul Deane said the rain had improved crop prospects.
"The east coast and South Australian wheat belt has now received August average rainfall with still 11 days to go," Mr Deane said.
He added: "The short-term rainfall outlook is predominantly dry for the east and west coast wheat belts over the weekend, but potential good rainfall in Western Australia on Monday."
'Fundamentals remain bullish'
In Asia, palm oil for November fell, but not too heavily, down 0.5% at 3,011 ringgit a tonne in Kuala Lumpur.
"Palm oil's fundamentals remain bullish, despite the uncertain economic outlook," Ker Chung Yang at Phillip Futures said.
Confidence in the uptick in Malaysia's production has waned, at a time of growing optimism for Chinese imports.
But rubber, lost a halo provided in the last session by data showing Japanese carmakers will build nearly 23m vehicles (worldwide) in the year to next March, close to the 2006-07 record.
Tokyo's January lot tumbled 2.7% to 352.40 yen a kilogramme.

Follow Us