by Kimble Charting Solutions
Showing posts with label Currencies. Show all posts
Sunday, September 25, 2011
Saturday, September 24, 2011
Dollar Index Joining Treasuries in the Smack Down
by Greg Harmon
Wednesday US Treasuries ($TLT)
delivered a smack down, putting the US Equity Markets ($SPY) and
Gold ($GLD) in their place. This was detailed in the
link below. Thursday this continued with the US Dollar Index, Copper and Crude
Oil taking sides. Let’s take a look.
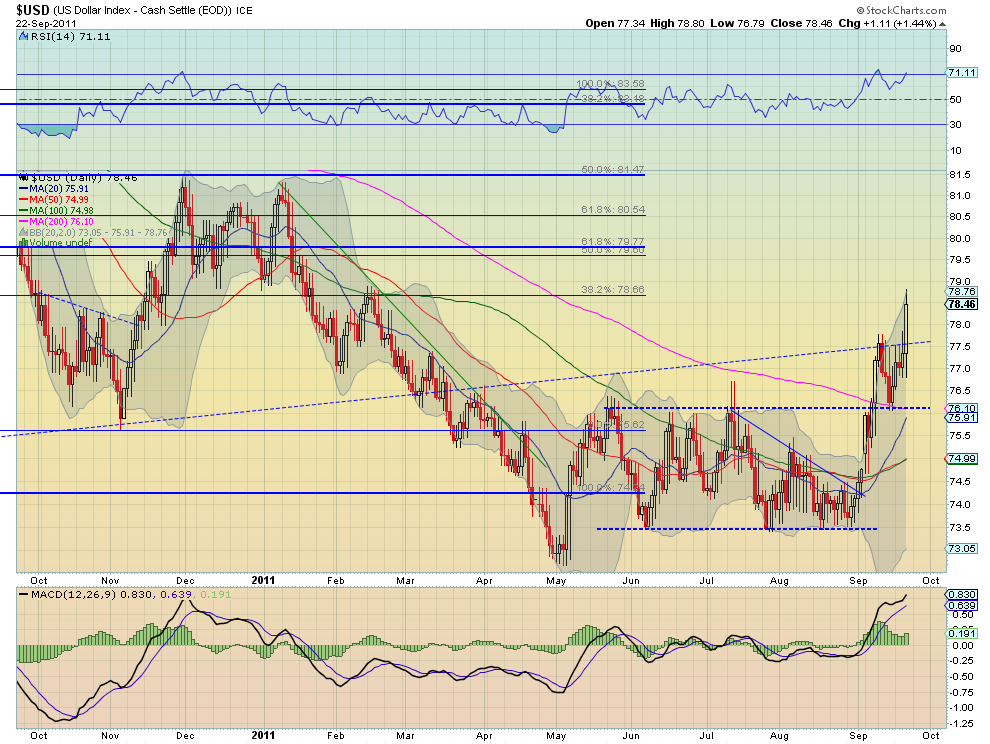
The US Dollar Index ($DX_F, $UUP) was
the big winner launching through the 3 year rising trend resistance out of a
bull flag. The measured move out of the flag is to 80.10 but it has some
resistance along the way at 79, and then 79.28, and 79.60. The rising Relative
Strength Index (RSI) and increasing Moving Average Convergence Divergence (MACD)
indicator support more upside. Like Rocky Balboa, almost down for the count, it
is rising up off the mat to take on the world, joining Treasuries.
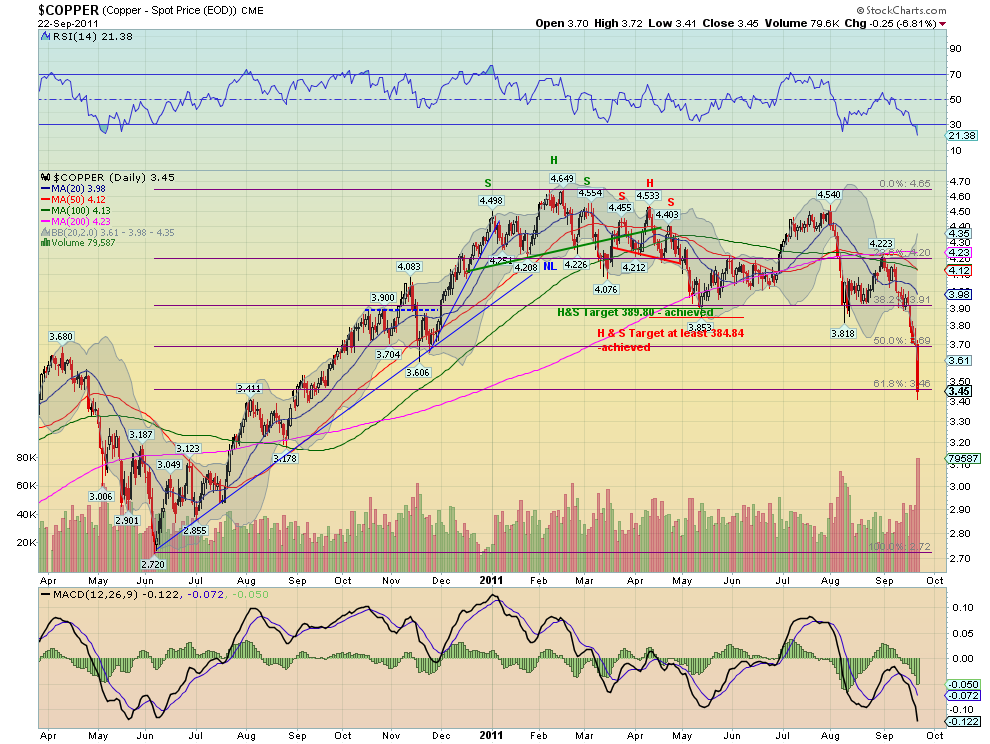
Copper ($HG_F, $JJC),
thought by many to be the tell for future market direction, responded with only
bad news. Falling through support at 3.69 and now attempting to hold support at
the 61.8% retracement of the move higher from June 2010, at 3.46 it’s best hope
is that the RSI is becoming oversold. That said the trend is down and the
indicators suggest more to come. If it is a market tell then this is not a
pretty story to come.
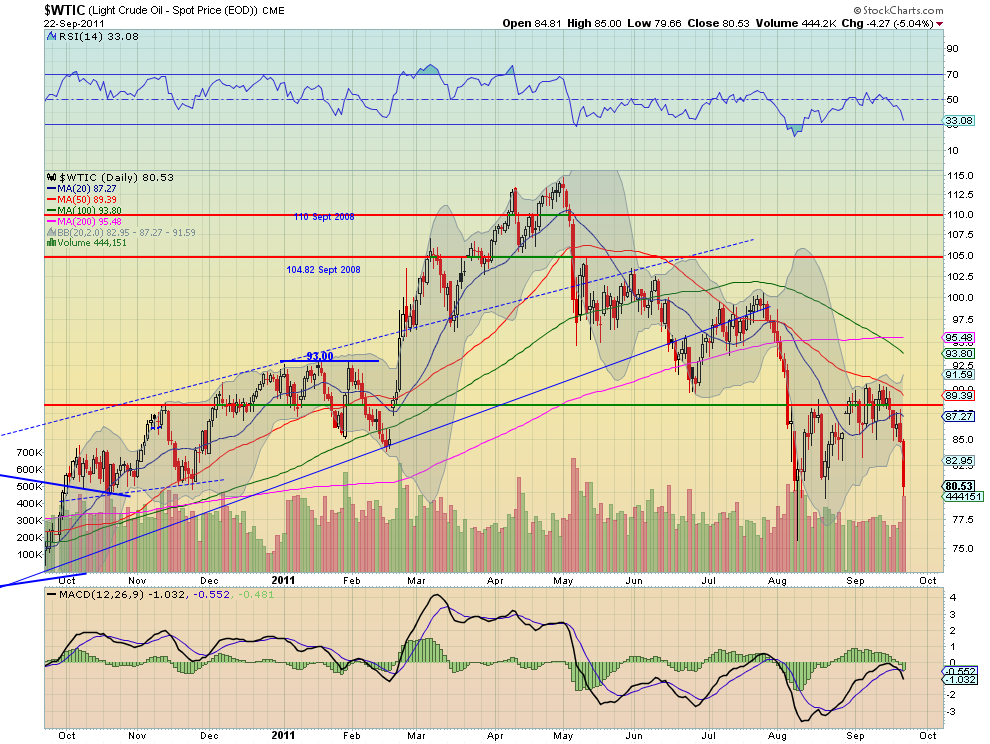
Crude Oil ($CL_F, $USO) was
also a casualty of the recent global moves. It finally broke the bear flag
lower, and now sees its next support at 77 and has a target on a Measured Move
to 70. The RSI and MACD also point to more downside.
Looks like the new world order, at least for the short run, has been set over
the last two days. US Treasuries and the US Dollar are in charge and driving all
risk assets and economically sensitive assets lower. Treasuries and the US
Dollar up, at the expense of the US Equity Indexes, Gold, Crude Oil, and Copper.
Paper promises outperforming hard assets and profitable companies. May God help
up.
Etichette:
Analysis Technic,
analysis technic article,
articles,
copper,
crude oil,
Currencies,
dollar index,
energy,
metals
September 20 Commitment Of Trader’s Report
by Macro Story
The COT report for the week ending September 20, 2011 shows copper still
setting up for further weakness while oil looks flat and the 30 year yield
possibly due for a move higher. Most interesting are the moves in the USD.
Copper: Finally after sounding like a broken record copper
has broken to the downside. Commercial net has been signaling this move for a
while and in fact had to readjust over the summer as copper remained stubbornly
high in price. Interesting to note even with the current weakness in copper
commercial net has in fact gone net long (buying copper into lower prices)
signaling even further selling to come.
Oil (WTI): Oil looks poised to remain slightly pressured to
range bound. No major change to report from this week’s report.
Long Bond: Based on a slight reduction in net short
positions for commercial accounts it appears the 30 year yield may in fact move
slightly higher over the coming week.
US Dollar: Very interesting changes
in position for both non reporting (retail) and commercial accounts. The USD did
break out of a multi-month trading range this week and has broken through
multi-year resistance. Below are two charts, the first shows how commercial net
moves relatively to the USD (i.e. they short or sell into strength). The second
chart shows how commercial and non reporting move inverse to one another.
USD VS Commercial Net
- notice the massive divergence signaling a major move higher in the
USD is highly probable or at least anticipated by commercial net.
USD Commercial VS Non
Reporting – Notice the extreme changes to positions for both. The non
reporting scale on the chart below is inverted to show the correlation. Although
easy to dismiss this as a USD selloff is pending as retail is massively net long
it is important to note that commercial net is supporting a move higher in the
USD.
Etichette:
Analysis Technic,
articles,
Currencies,
financials,
oil
Wednesday, September 21, 2011
The S&P 500 & the Dollar Ahead of the Fed Statement
by JW Jones
The Federal Reserve is holding a two-day meeting Tuesday and Wednesday of
this week. Market participants are expecting the Federal Reserve to prop up
financial markets yet again with some grand new plan. The fact is the Federal
Reserve is running out of bullets.
Interest rates cannot move much lower in terms of the Federal Funds rate,
additional quantitative easing seems redundant since Treasury yields are close
to all-time lows, and finally a twisting of maturities will do little to alter
the current economic conditions. The Federal Reserve is just repeating practices
which have proven over a long term do little to create jobs or get the economy
moving in the right direction. A stock market rally does not help a person
looking for a job!
It is possible that even if the Federal Reserve proposes additional stimulus
the market could sell off. I have been trading less in this environment and have
been focusing on looking for trade setups that could work regardless of price
action. For now I am sitting predominantly in cash waiting to see how price
action reacts to the news flow tomorrow.
S&P 500
If I had to guess, I continue to believe that
the S&P 500 will get back to test the key 1,250 – 1,280 price level. While
this resistance level is apparent, Mr. Market will be able to tear up traders if
price jams into that resistance zone. Mr. Market loves nothing more than to
shake people out of positions. If price works higher I would expect the 1,250 –
1,280 price range to offer just enough risk / reward to get investors and
traders involved in a choppy trading environment. The key upside levels on the
S&P 500 are shown below on the daily chart of the S&P 500 Index
($SPX):
The flip side of that argument would see the S&P 500 jamming into recent
resistance around the 1,230 price level. If prices rolled over and momentum
picked up, a test of the recent August lows would likely transpire and could
produce a breakdown and a lower low.
When looking at recent price action, the S&P 500 Index has put in a
series of higher lows which is a bullish signal, however the S&P 500 has a
long road ahead to break out above the 2011 highs. If the S&P 500 carves out
a lower high on the S&P 500 Index at 1,230, 1,250, or even 1,280 and
subsequently takes out the August lows then the secular bear will be back. The
weekly chart of the S&P 500 Index ($SPX) shown below illustrates key support
levels:
For now I am just going to sit in cash and wait for Mr. Market to provide me with some better clues. The trading range is pretty wide going from around 1,100 to 1,280. What I will be watching for is a strong move supported with volume that pushes price out of this range. As of the close today, price action was trading around the middle of this range but depending on how price action reacts to the news that comes out Wednesday it is possible that in coming days we could see a breakout in either direction.
Dow Jones Industrial Average
It will likely surprise long
time readers that I am actually going to comment on the Dow. I will keep this
brief, but I wanted to point it out to readers as I have not heard much mention
of this pattern in the main stream financial media.
Over the weekend I was looking at some longer term charts and I accidentally
stumbled across this head and shoulders pattern on a weekly chart of the Dow
Jones Industrial Average. I rarely pay much attention to the Dow as I monitor
the S&P 500 closely. However, I could not ignore what I was seeing. I also
noted that a similar pattern also exists on the S&P 500.
I am generally not the kind of trader who tries to predict where price action
will arrive in the distant future. However, I am not going to ignore clear chart
patterns that I recognize regardless of the time frame I am looking at.
For those not familiar with a head and shoulders pattern, it is a very
ominous signal. Head and shoulders patterns are generally topping formations
that if triggered result in violent selloffs. On this chart the pattern is
obvious and if the pattern were triggered the forthcoming price action would be
decisively negative for domestic equities. The long term monthly chart of the
Dow is shown below:
If the pattern is triggered on an undercut of the March 2009 lows, the head
and shoulders formation would produce selling pressure that would target the
3,800 – 4,000 level on the Dow. Yes, you read that right! I want readers to
recognize that this pattern is not a given and it could play out over a long
period of time. The pattern would suggest that a test of the 2009 lows is
possible, but I will leave the likelihood of that test up to Mr. Market.
I view this pattern as a potential warning signal for long term equity
positions. Consequently, it is far too early to jump into a plethora of short
positions or sell every equity position owned simply because of this pattern.
While I do not know where price goes from here or if this pattern will ever
trigger, I think market participants should be aware of its existence.
It would take the perfect concatenation of events to push prices down to the
March 2009 lows, but unfortunately the condition of social mood paired with all
of the risks facing financial markets is notable. The recent selloff in August
came on the heels of a head and shoulders pattern that was triggered. We all
know how August played out, but this pattern on the Dow Jones Industrial Average
has a long way to go before it can even trigger. Time will tell, but readers
should at the very least put this chart pattern on your radar!
U.S. Dollar Index
The U.S. Dollar Index has ripped higher by more than 5% since August 29th.
The strength in the Dollar has likely been precipitated by fear based on the
European sovereign debt and banking crisis. While the Dollar certainly has long
term flaws, it may simply be the best of the worst.
If the situation in Europe begins to break down
further based on any number of events it could likely push the U.S. Dollar Index
considerably higher. My trading partner Chris Vermeulen has been riding this
strong impulse wave with his subscribers Swing trading the UUP
etf and thinks there is big potential still if Euro-Land fears continue to
rise.
Mid-Week Market Trend Conclusion
Wednesday will be filled with a variety of news and headlines. The Greek
government is meeting and a news release regarding the conference will likely
come out around the time domestic markets in the United States open. The news
has the potential to move markets considerably.
In addition, the Federal Reserve is set to end its September meeting and
market participants will be sitting on the edge of their seats waiting to hear
from the Federal Reserve about any stimulus the central bank may provide.
Overall, the news and headlines on Wednesday will certainly impact the
current conditions of financial markets. Right now I am pleased to be sitting
primarily in cash. I have a few positions open, but for the most part the trades
are not directional and are profitable based on time decay.
The one directional trade I have on presently is a remaining sliver of a
position I have already taken profits from and stops are in place. While I have
been risk averse the past few trading sessions, I am flush with cash and ready
to accept new risk if high probability setups emerge.
However, the best trade can sometimes be no trade at
all and I intend to remain patient. Risk is extremely high!
Etichette:
Analysis Technic,
analysis technic article,
articles,
Currencies,
dollar index,
eMini Dow Jones,
eMini SP,
Index
Monday, September 19, 2011
Risk Off Day as correlations spike further
by the trader
The Day we sold everything. Oil, Gold, Silver, EUR, AUD, Equities all down
today. With correlations running high, we could be facing another Flash Crash
sooner than later. Only “thing” not trading at day lows, is actually the Athens
Index.
and the only asset bouncing is ironically the
Greek Market.
Etichette:
Analysis Technic,
analysis technic article,
articles,
Currencies,
Index,
metals,
oil
The Best Currency to Short Right Now
By Sean Hyman
There's never been a better time to be a short-seller.
Right now stocks are slipping and sliding all over the place, overall trending downward. And it doesn't look like this downtrend is going anywhere soon.
Short-selling can help you protect your overall portfolio when stocks start sliding off the map. Also, you can earn some of the fastest profits from short-selling in "down" markets because markets drop a lot faster than they rise.
We saw that over the last few weeks as the Dow Jones Industrial Average and Standard & Poor's 500 Index erased all their 2011 gains in a couple of days. That's pretty common. In fact, it usually takes an index all year to gain 10% to 20%. Then it can drop as much as 30% in a week.
So if you were able to short stocks during those times, you would make a decent return for a full year within weeks, or even days.
However, it's not always easy to execute short- sells in the stock market - which is why I always look for the best short-selling opportunities in foreign currencies first.
And I just found the ideal short-sell in the f orex market to play as markets fall.
Right now stocks are slipping and sliding all over the place, overall trending downward. And it doesn't look like this downtrend is going anywhere soon.
Short-selling can help you protect your overall portfolio when stocks start sliding off the map. Also, you can earn some of the fastest profits from short-selling in "down" markets because markets drop a lot faster than they rise.
We saw that over the last few weeks as the Dow Jones Industrial Average and Standard & Poor's 500 Index erased all their 2011 gains in a couple of days. That's pretty common. In fact, it usually takes an index all year to gain 10% to 20%. Then it can drop as much as 30% in a week.
So if you were able to short stocks during those times, you would make a decent return for a full year within weeks, or even days.
However, it's not always easy to execute short- sells in the stock market - which is why I always look for the best short-selling opportunities in foreign currencies first.
And I just found the ideal short-sell in the f orex market to play as markets fall.
Why to Use the Forex Market for Short-Selling
Many countries are instituting a ban on short-selling some stocks, making it hard to take advantage of market downtrends.France, Spain, Italy, Belgium, Greece, Turkey and South Korea recently have created some rules against short-selling.
With a short-selling ban in effect, it means even if you believe a stock will drop in value, you can't try to profit off that decline by simply shorting stocks.
Luckily, there will never be any short-selling bans in the f orex market.
You see, currencies are traded in pairs. When you buy the first currency listed in the pair, by default you're also shorting the second currency in the pair. And if you short the first currency listed in the pair, you're automatically buying the second currency.
In other words, you're always shorting something. That's why there will never be "short-selling bans" in the spot f orex market.
It also means that with currencies, you can just as easily profit in a "down market" as you can in an "up" market.
Even better - what if there was a "stock-market sensitive" currency in the forex market: As stocks dive, this currency would dive; as stocks rise, it would rise.
Thankfully, that pair does exist.
The Currency Short Sale to Make Now
It's the AUD/USD (Australian dollar vs. the U.S. dollar). Take a look at the accompanying chart .The AUD/USD has been in an uptrend as long as stocks have. This pair also traded sideways just like stocks did. That caused it to form a chart pattern called a "double-top" at the same time that stocks did.
Now it's started its downtrend, just like stocks.
Simply shorting this AUD/USD pair is like shorting the Dow or S&P 500. And since it's a currency pair, it's much easier to short-sell it in the f orex market.
It's one of the best hedges you can use to take the sting out of your portfolio as stocks drop. If the Dow really starts falling, your AUD/USD short position will grab even more profits.
Most people don't realize that such a simple solution is out there, but it is. Therefore, take advantage of this time in market history. Simply shorting the Aussie dollar in the f orex market is the easiest way to do that.
Etichette:
Analysis Technic,
analysis technic article,
articles,
australian dollar,
Currencies,
eMini SP,
Index
Sunday, September 11, 2011
Macro Week in Review/Preview September 10, 2011
by Greg Harmon
Last week’s review of the macro
market indicators looked like the moves that revealed themselves the
previous Friday would continue. Gold and US Treasuries were ready to continue
higher. Crude Oil looked poised to drop further and the US Dollar Index to move
sideways in the top of its range. The Shanghai Composite and Emerging Markets
looked to continue lower. Volatility looked to remain elevated with the US
Equity Index ETF’s SPY, IWM and QQQ ready to continue lower in their bear flags.
US Treasuries breaking out and Gold racing higher again could be the catalyst
for a break of the bear flags lower.
The week began Gold making a new high before pulling back to consolidate, US
Treasuries gapped higher and held there. Crude Oil held narrow range between 86
and 90 while the US Dollar Index marched to the top of the range and then peaked
out. The Shanghai Composite and Emerging Markets did move lower but with a mid
week blip higher for Emerging Markets. Volatility did hold higher with and the
Equity Index ETF’s remained lower, but still in their bear flags. What does this
mean for the coming week? Lets look at some charts.
As always you can see details of individual charts and more on my StockTwits feed and on chartly.)
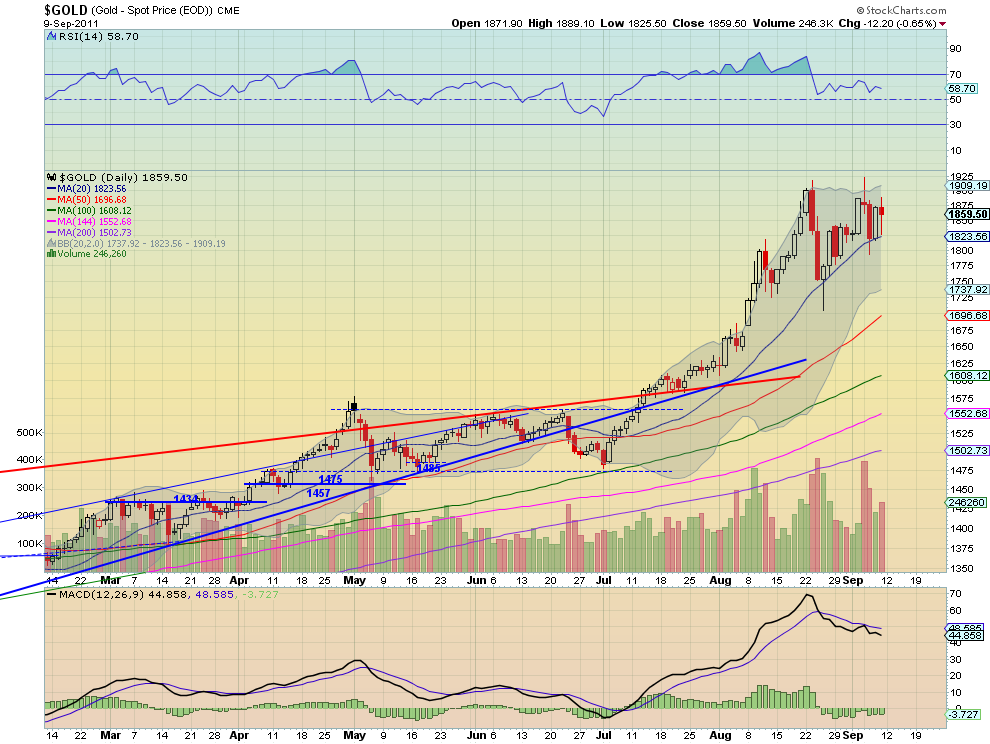
Gold Weekly, $GC_F
Gold consolidated this week over the break out of the ascending triangle
Monday and near resistance at 1875, after it made a new intraday high Tuesday.
The Relative Strength Index (RSI) on the daily chart remains in bullish
territory but moving sideways. The Moving Average Convergence Divergence (MACD)
indicator has been running flat but slightly negative on the daily chart but has
been rising on the weekly chart. The RSI on the weekly has held in the high 70′s
for several weeks. Look for the bull flag on the weekly chart and symmetrical
triangle on the daily chart to play out with either more upside or continuation
of consolidation near 1875 in the coming week. Any pullback should find support
at 1840 or 1800 lower. A move over 1930 triggers a target of 2250.
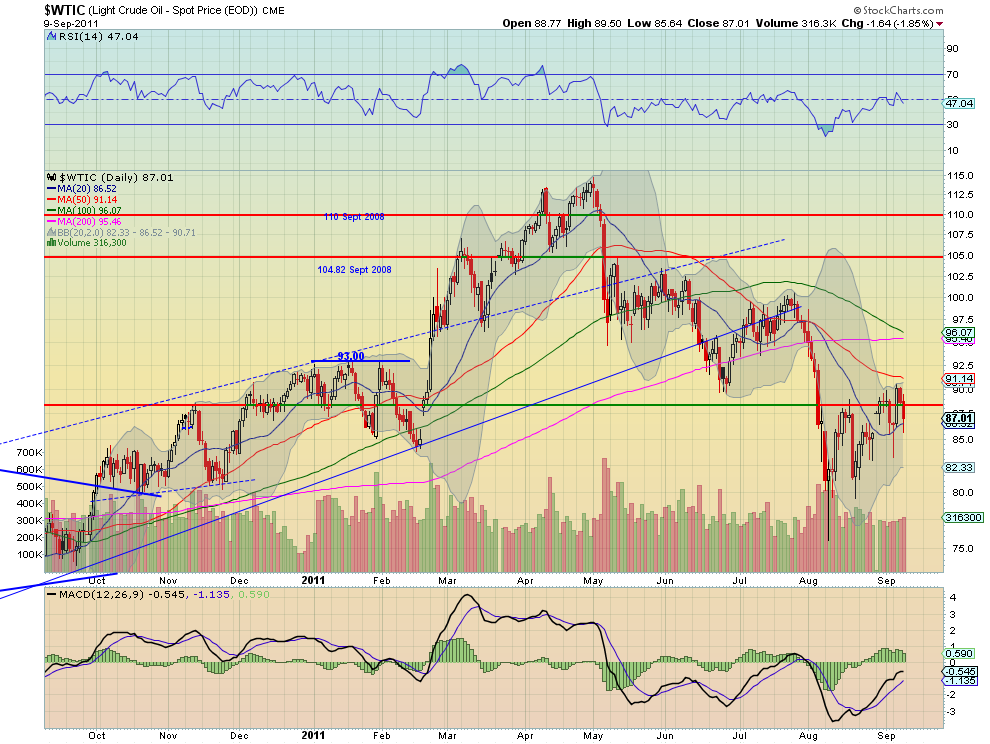
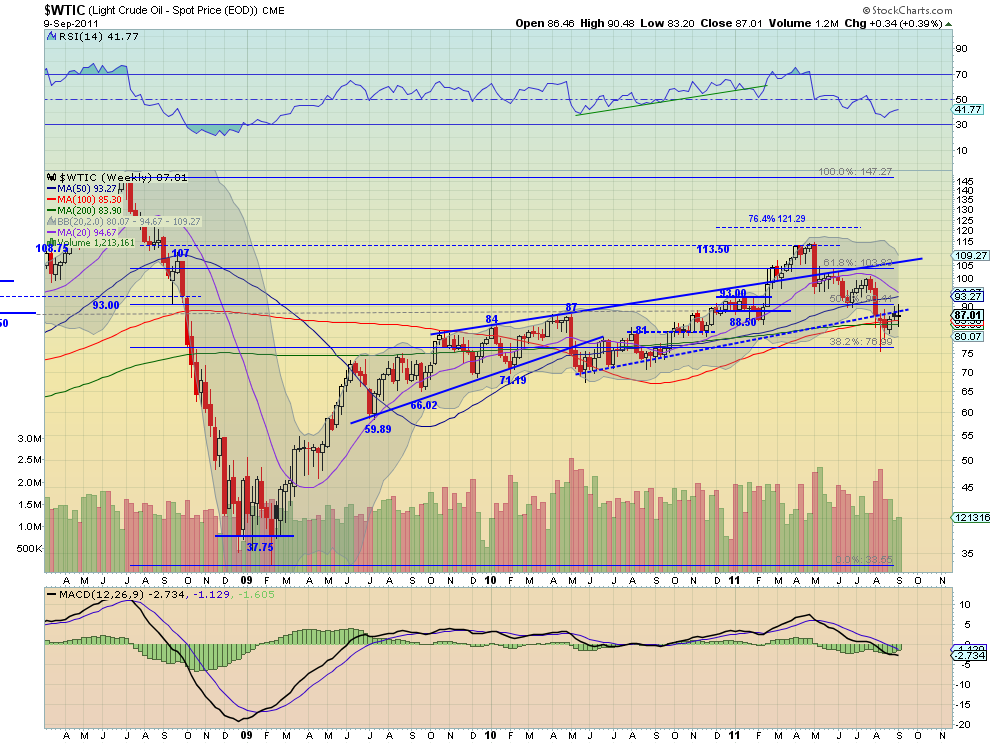
West Texas Intermediate Crude Weekly, $CL_F
Crude Oil continued its bear flag ending the week little changed and
vacillating around the 88.50 support/resistance line. The weekly chart shows
that resistance of the rising trendline extension form May 2010 is holding. The
RSI on the daily chart has stalled near the mid line and the MACD is positive
but fading slightly. The weekly chart shows the RSI currently rising but in a
downtrend and the MACD improving. These suggest the bear flag will continue next
week. Look for upside to be capped at 90 and a move to 93 above that as a break
of the bear flag. A move under 84 finds support at 81 and then 77 lower which
would trigger a target of 70 on the Measures Move (MM) out of the bear flag.
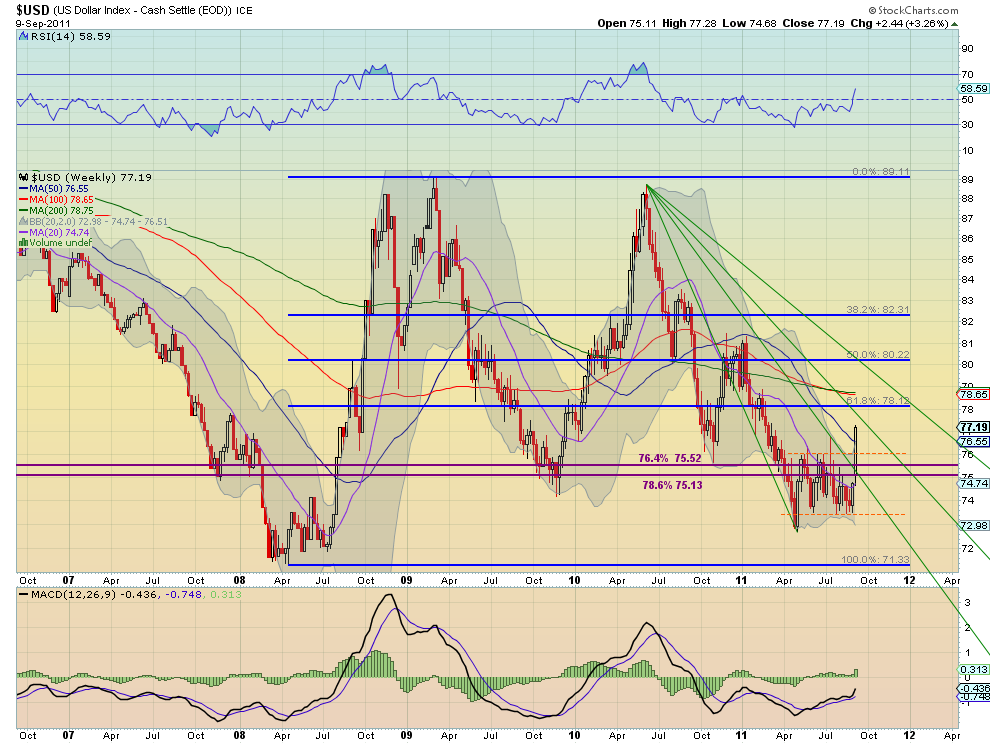
US Dollar Index Weekly, $DX_F
After peaking over the channel Thursday, the US Dollar Index broke the
channel higher Friday. It has a RSI that raced higher all week and is strongly
in bullish territory, and a MACD that is increasing on the daily chart. The
weekly view shows a vault over the resistance area, opening over the Fibonacci
Fan line and rising strongly towards the next line. The RSI on this timeframe
moved steeply higher and the MACD jumped higher. Look for continued movement to
the upside in the coming week with resistance higher at 77.50 and 78.15 as it
heads to the channel breakout target of 78.50 near the previous 78.66 resistance
area from February. As with any breakout, a retest of the channel at 76 is
possible and a move below it has support at 75.52 and 75.
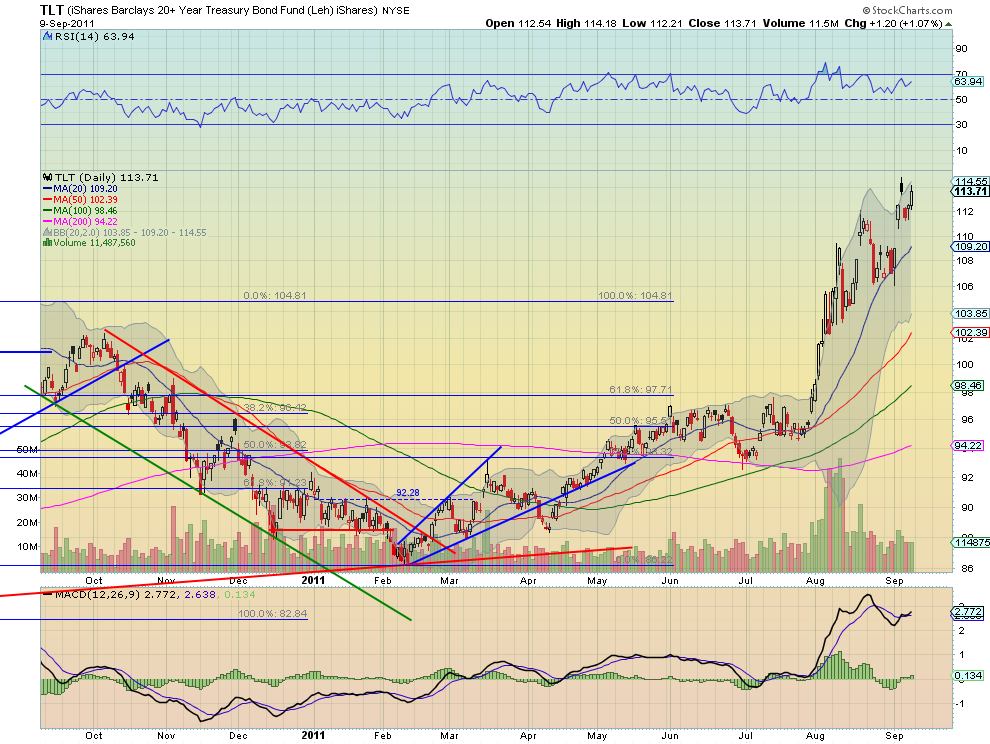
iShares Barclays 20+ Yr Treasury Bond Fund Weekly, $TLT
US Treasuries, measured by the ETF $TLT,
gapped up higher on Monday and held the gap. The daily chart shows the RSI
continuing to move in a range in bullish territory but with a MACD that has
crossed positive. The weekly chart adds that it broke the broad consolidation
around the 106 to 111.33 area and now has a MM higher to about 120.70. The RSI
on this timeframe remains bullish in the high 70′s with a MACD that is
increasing. With a touch of 115 this week, next week or shortly after looks a
lock to tag 120.70 and above that triggers a target on the symmetrical triangle
break at 137. Any pullback will find support 111.33 and 109.30, with a move
under 106 signalling a trend change.
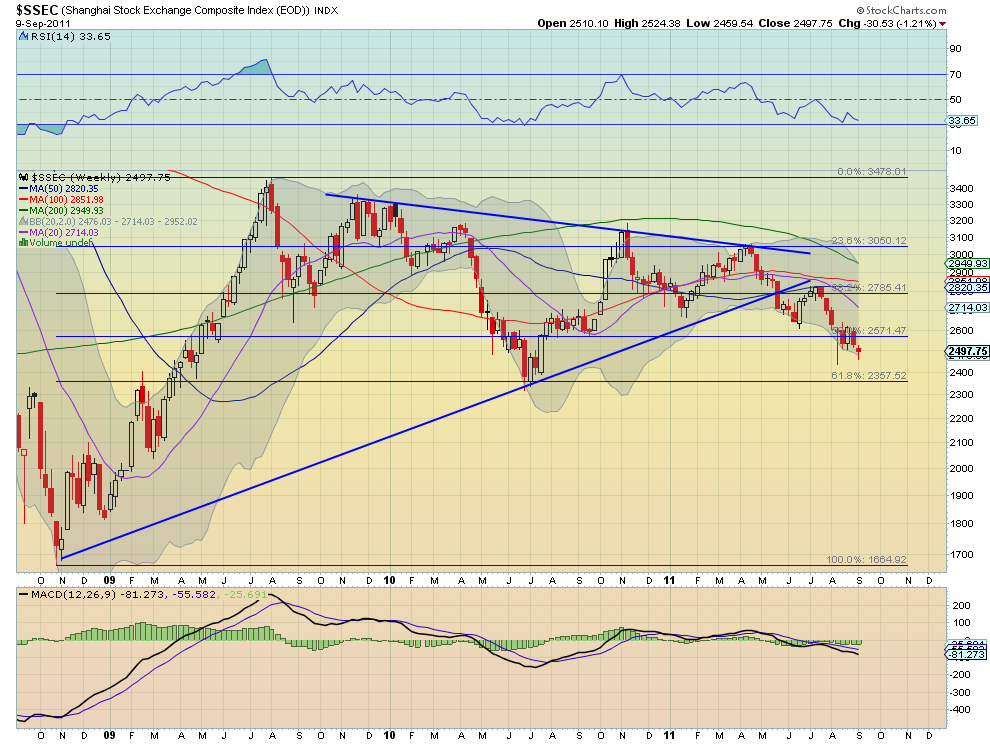
Shanghai Stock Exchange Composite Weekly, $SSEC
The Shanghai Composite showed continued resistance at the 2500 level holding
lower for the week. The daily chart has a RSI that has been bumping along the 30
technically oversold level, but no where near an extreme reading while the MACD
fluctuates around zero. The weekly chart shows the long trend of the RSI lower,
making lower highs, and the flat MACD. It also shows that it is starting to fall
out of the bear flag lower. Continue to favor the downside in the coming week a
move below support at 2400 leading to a test of 2357 and a target of 2300 on the
bear flag break. Upside should be capped for the week at 2571-2590.
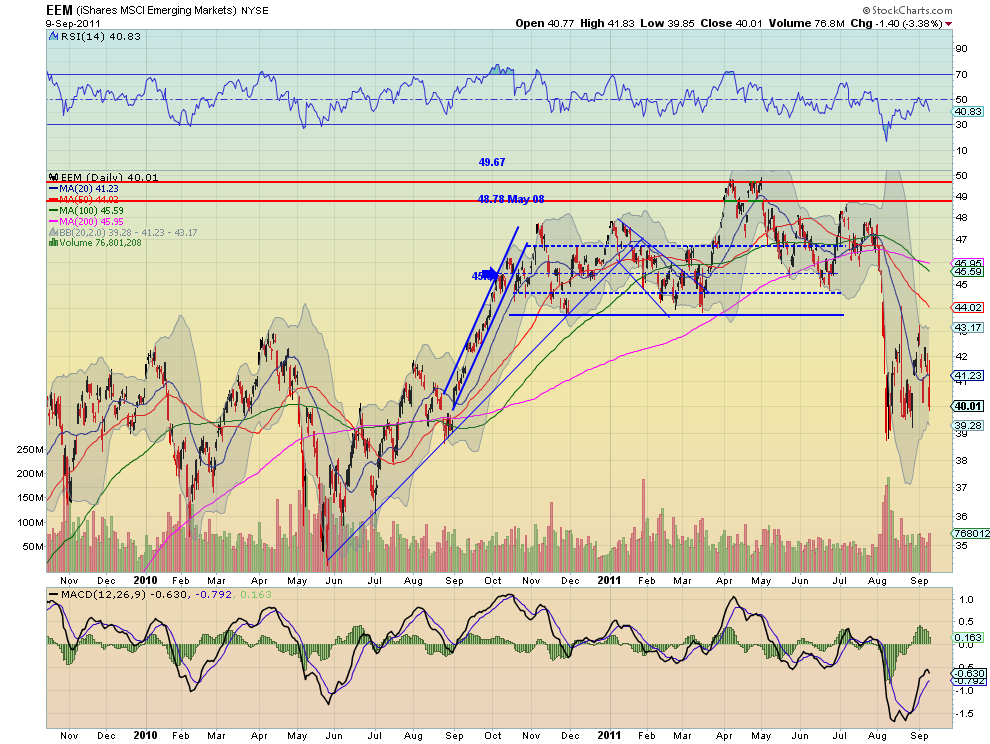
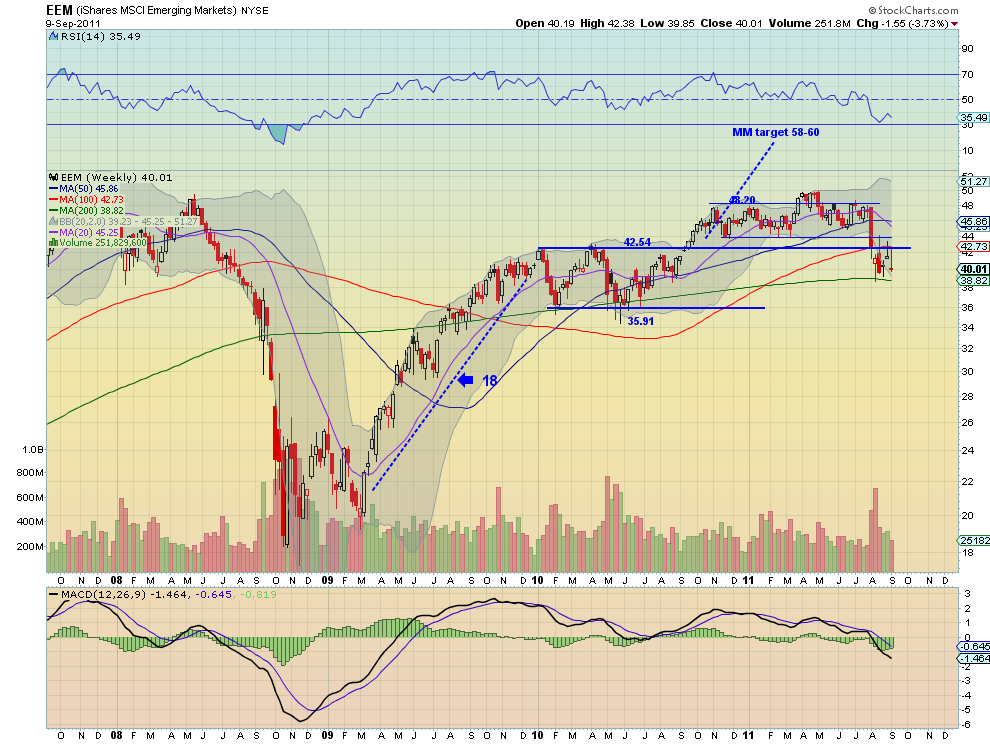
iShares MSCI Emerging Markets Index Weekly, $EEM
Emerging Markets, as measured by the ETF $EEM,
continued in their bear flag similar to the domestic markets. Notice the RSI on
the daily chart rejected lower at the mid line continuing in bearish territory
as the MACD fades lower. On the weekly chart the bear flag is distinct under the
42.54 resistance level. The RSI on this timeframe is struggling to stay over 30,
and is bearish, but the MACD is starting to improve. The downward bias remains
for eh coming week with a break below 39, out of the bear flag seeing support
lower at 35.91 and triggering a target of 32. Any upside will meet resistance at
42.54 and then 44.10 above that.
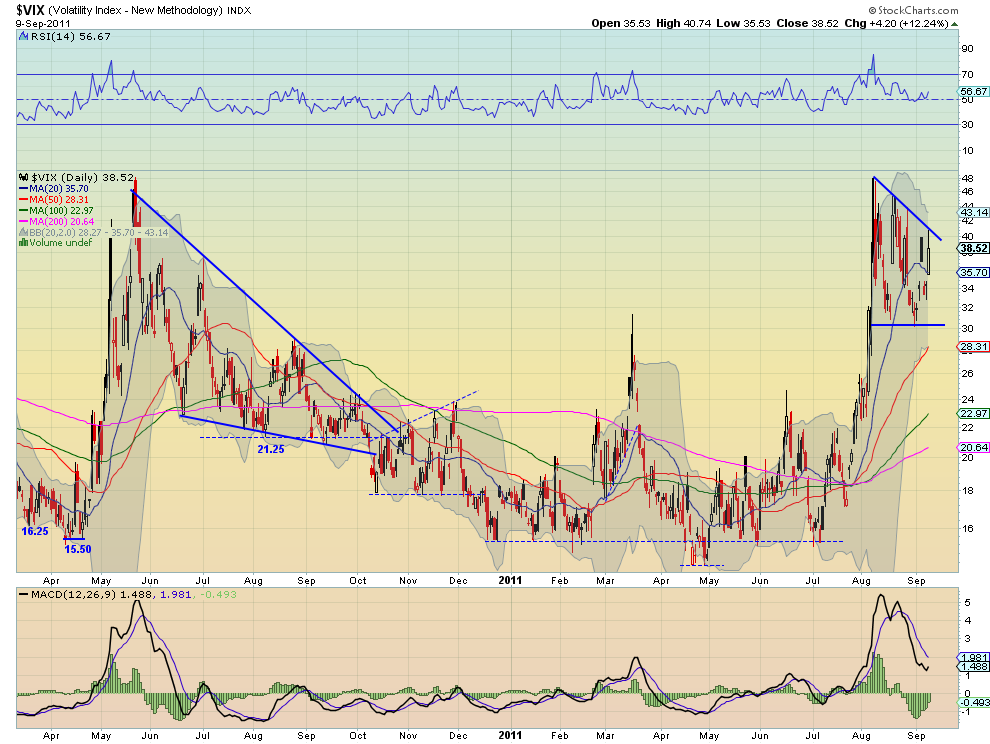
VIX Weekly, $VIX
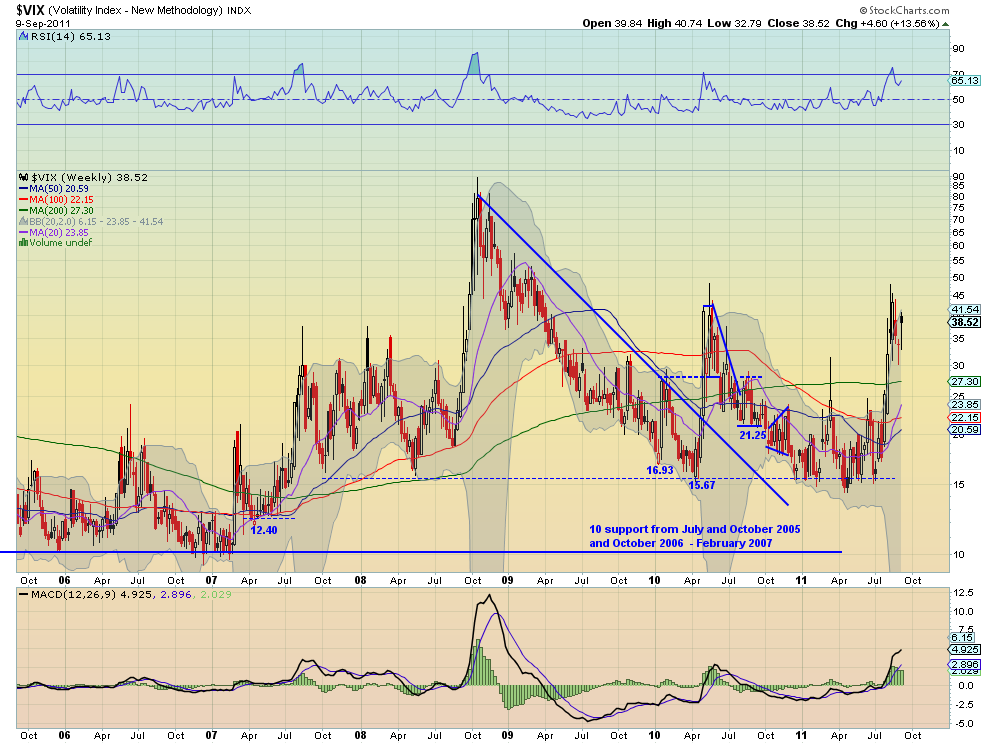
Volatility continues to remain elevated. The daily chart is sporting a
descending triangle and is testing the top side resistance with a RSI that
refuses to fall back below 50 and a MACD that is improving quickly. The RSI and
MACD on the weekly chart equally are supportive of further upside in volatility.
Look for volatility to continue to remain high next week with a move above 40
and then 45 triggering a target of 58. It would take a break below 30 to change
the mood and expectations for a move to support at 28 or 23 lower. The charts do
not show that now.
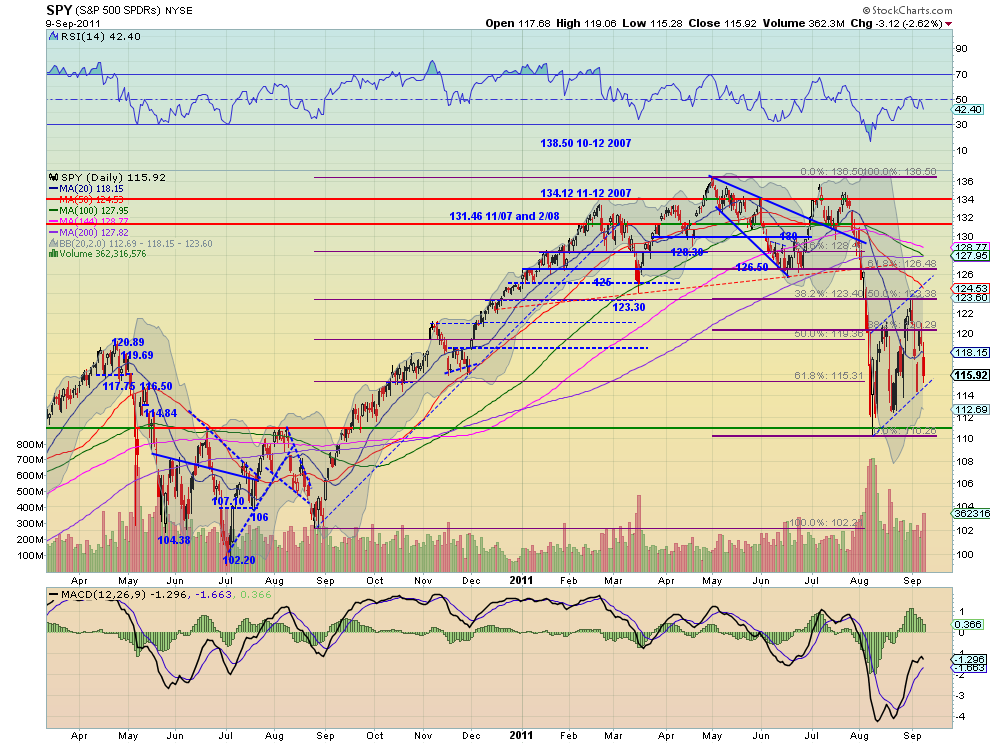
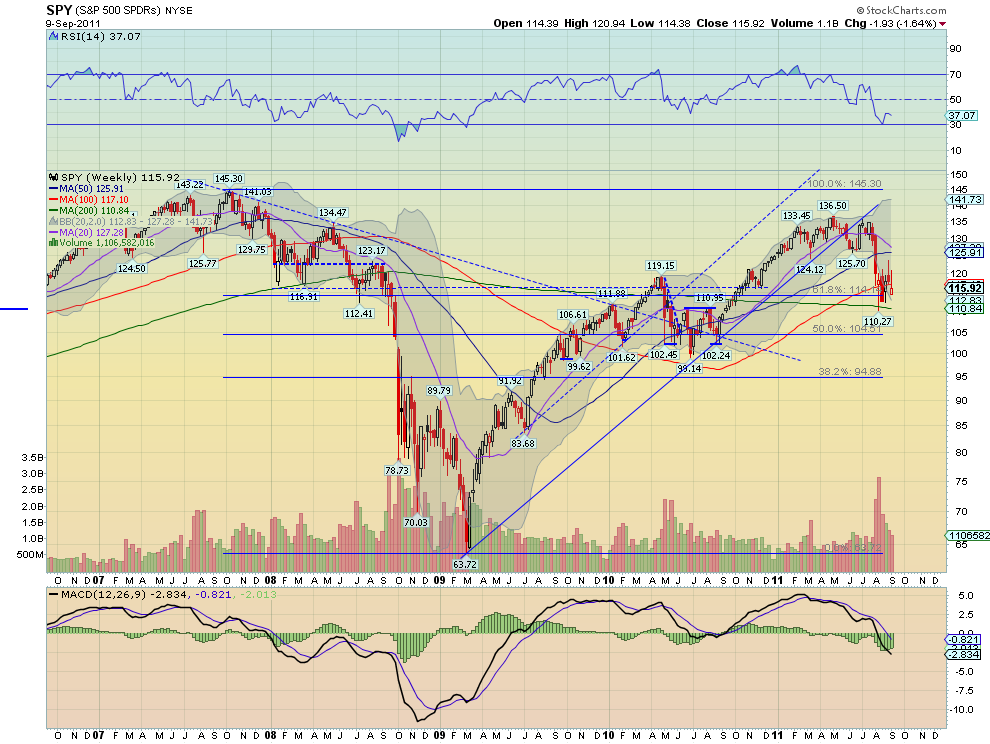
SPY Weekly, $SPY
The SPY continued in the bear flag this week moving back lower after
rejecting a retest at the 38.2% Fibonacci level from the broad move lower. It
has a RSI that also rejected at the mid line and is heading lower on the daily
chart and a MACD that continues to fade. The weekly chart shows the RSI bounce
off of the 30 level fading back towards it and the MACD remaining negative. The
downtrend remains for next week. If it breaks the flag lower under 115.30 there
is support at 111.15 and 104 on the way to a target of 95-100. Any upside should
find resistance over 121.50 at 123.30. Above that the trend may be changing.
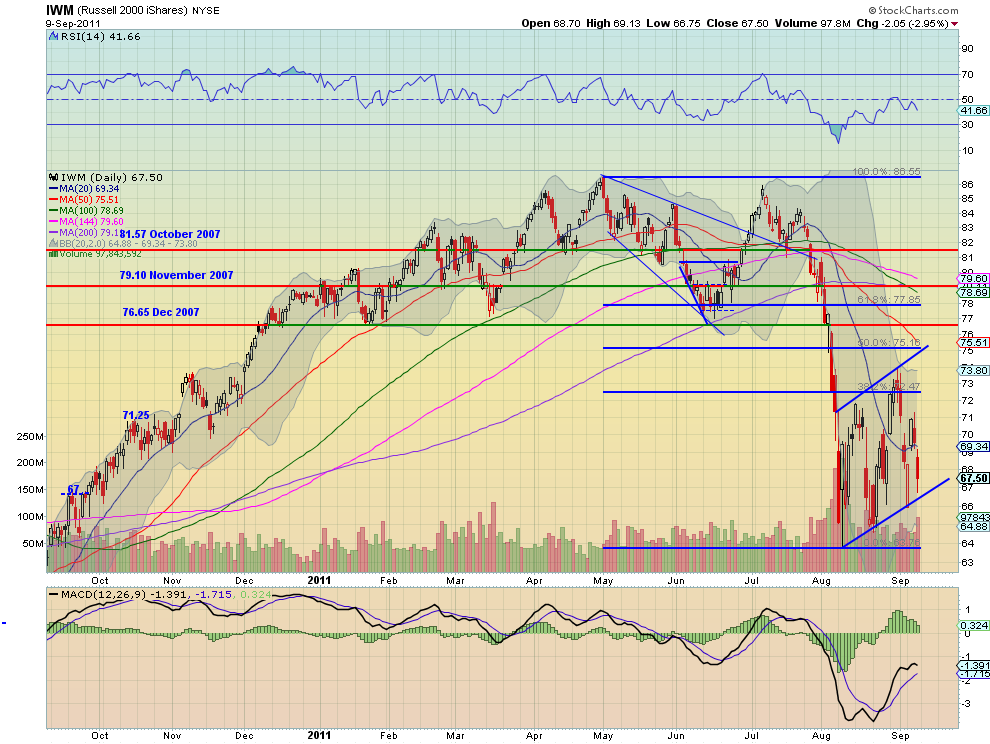
IWM Weekly, $IWM
The IWM moved in its bear flag this week, moving back lower after rejecting
at resistance at 71. It has a RSI that rejected at the mid line and is heading
lower on the daily chart and a MACD that continues to fade. The weekly chart
shows the same RSI bounce off of the 30 level fading back towards it and the
MACD remaining negative. The downtrend remains for next week. If it breaks the
flag lower under 66 there is support at 62.80 and 58.68 on the way to a target
of 44. Any upside should find resistance over 71 at 73.60. Above 75 the trend
may be changing.
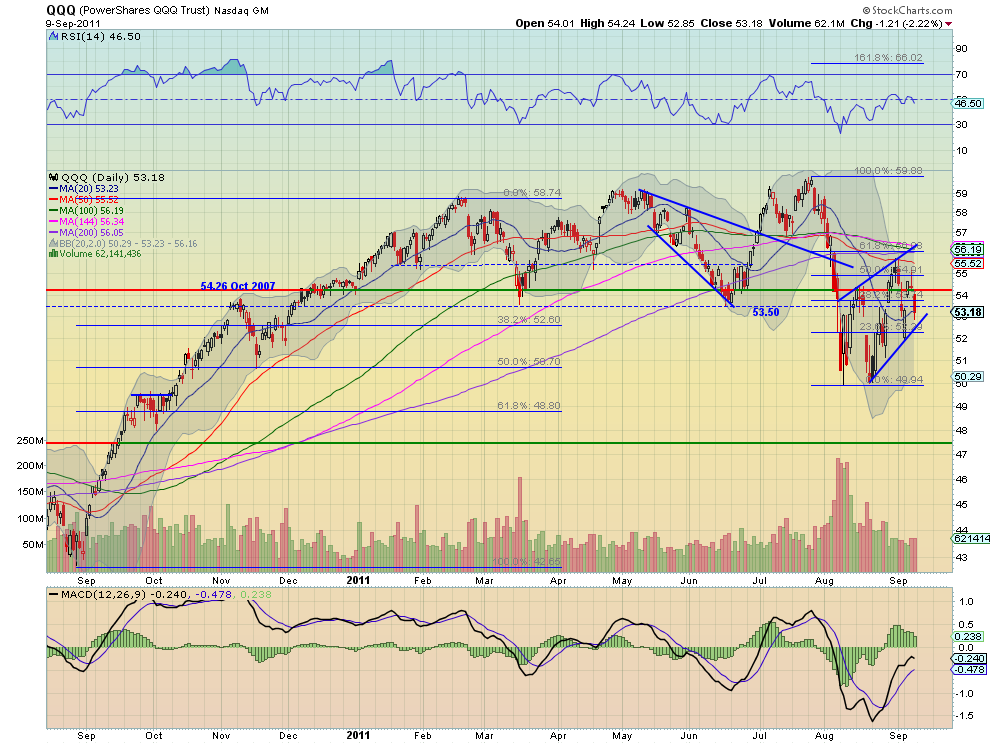
QQQ Daily, $QQQ
The QQQ moved in its bear flag as well, moving back lower after rejecting at
the 50% Fibonacci level. It has a RSI that rejected near the mid line and is
heading lower on the daily chart and a MACD that continues to fade. The weekly
chart shows the same RSI bounce leveling and the MACD remaining negative as the
flag sits on the 100 week Simple Moving Average (SMA). The downtrend remains for
next week. If it breaks the flag lower under 52.60 there is support at 50.03 on
the way to a target of 46-46.60. Any upside should find resistance over 55.50 at
57. Above that the trend may be changing.
The coming week looks positive for US Treasuries and the US Dollar Index.
Gold looks to continue to be biased higher and Crude Oil lower, but both may
also continue in the respective bull and bear flags. The Shanghai Composite and
Emerging Markets continue to favor the downside. Volatility looks to remain
elevated with a bias towards heading higher. This backdrop suggests favoring a
downside bias in the US Equity Index ETF’s SPY, IWM, and QQQ. They may continue
to hold their bear flags but a big push higher in the US Dollar Index and US
Treasuries are likely to push Volatility higher out of its range and lead to the
Equity flags breaking lower. Use this information as you prepare for the coming
week and trade’m well.
Etichette:
Analysis Technic,
analysis technic article,
articles,
crude oil,
Currencies,
dollar index,
eMini SP,
energy,
financials,
gold,
metals,
oil,
T-Bond,
Vix,
Volatility
Sunday, September 4, 2011
Macro Month in Review/Preview August-September 2011
by Greg Harmon
Last month in this space my Monthly
Macro Review/Preview suggested that the monthly charts had shifted to
showing Gold ready to move higher in the coming months along with US Treasuries
while Crude Oil and the US Dollar Index are biased to the downside. The Shanghai
Composite and Emerging Markets were set to slowly drift lower in a sideways
consolidation. Volatility was on the edge of a break higher at a critical level.
A move above 28 would signal regime change while a fall back, more of the same.
This was reflected in the Equity Indexes as well with the SPY, IWM and QQQ all
consolidating with indicators starting to point negative, but holding in their
ranges. A catalyst that pushes them higher could lead to a major rally. The QQQ
is the strongest of the Indexes as of the end of July.
Gold and US Treasuries held true to the charts and moved higher, a lot
higher, while the US Dollar Index and Crude Oil consolidated. The Shanghai
Composite and Emerging Markets also drifted lower as anticipated in the charts.
Volatility took the high rode and held higher all month concurrent with a move
lower in the Equity Index ETF’s. A month that was true to the technicals. How
does the month impact the longer term picture. let’s look at some charts.
As always you can see details of individual charts and more on my StockTwits feed and on chartly.)
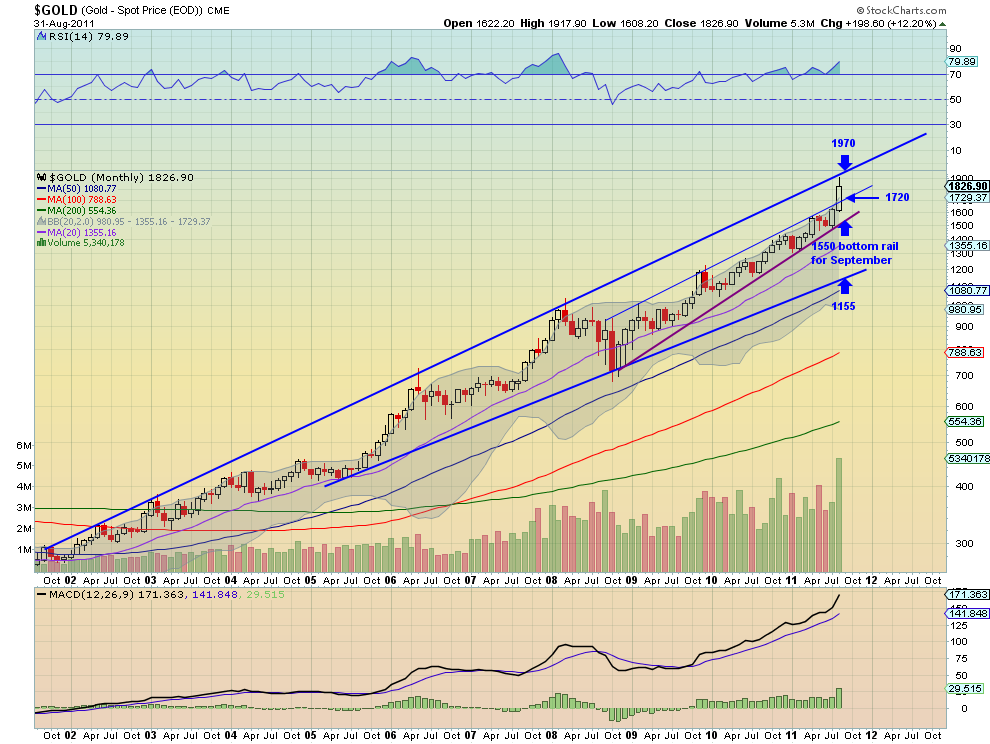
Gold broke above the rising two year trendline resistance and did not look
back until it ran near the 10 year resistance line at 1917.00. The Relative
Strength Index (RSI) remains elevated, but under 80 and the Moving Average
Convergence Divergence (MACD) indicator continues to move higher. These
indicators along with the Simple Moving Averages (SMA) sloping higher and volume
increasing point to more upside for Gold in the coming months. Support for any
pullback now stands at 1720 and 1550 below that while a move over 1970
resistance may slow it down.
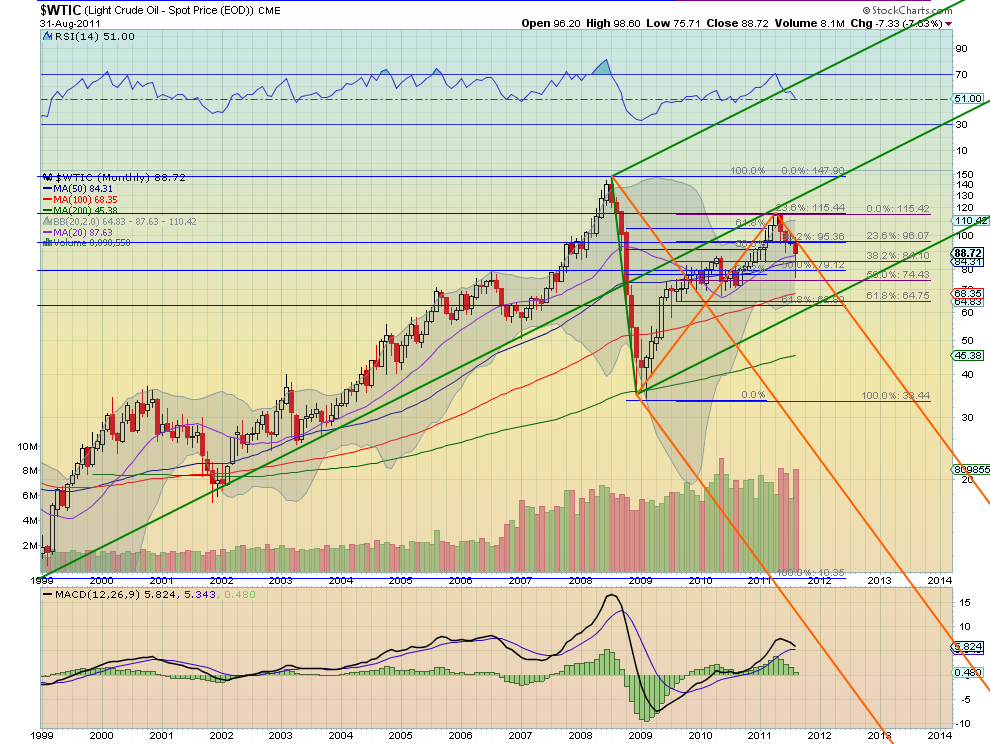
Crude Oil printed a Hammer candle this month, a possible reversal if
confirmed higher, giving hope that the short move lower may be ending. But the
RSI continues to look lower as it hits the mid line and the MACD is about to
cross negative, both suggesting more downside to come. The upside should be
capped by the overlapping Fibonacci levels a between 95.36 and 96 if it can get
above the Upper Median Line of the bearish Pitchfork. Downside support comes
first at 84.10 and then 79.12 and 74.43 before strong support at 71.
The US Dollar Index continued its series of tight doji’s after breaking the
symmetrical triangle lower in March. The RSI continues to linger near 40 as the
MACD stalls in negative territory. Both give no guidance for the future. The
SMA’s continue to slope lower adding to the understanding that the trend is
still lower. Any upside should be capped at a retest of the triangle near 77.50
and the downside support levels of 73 and 71.50 are the only thing between it
and targets of 52 and then 40 on Measured Moves (MM) out of the triangle and
from the 120 top in 2002.
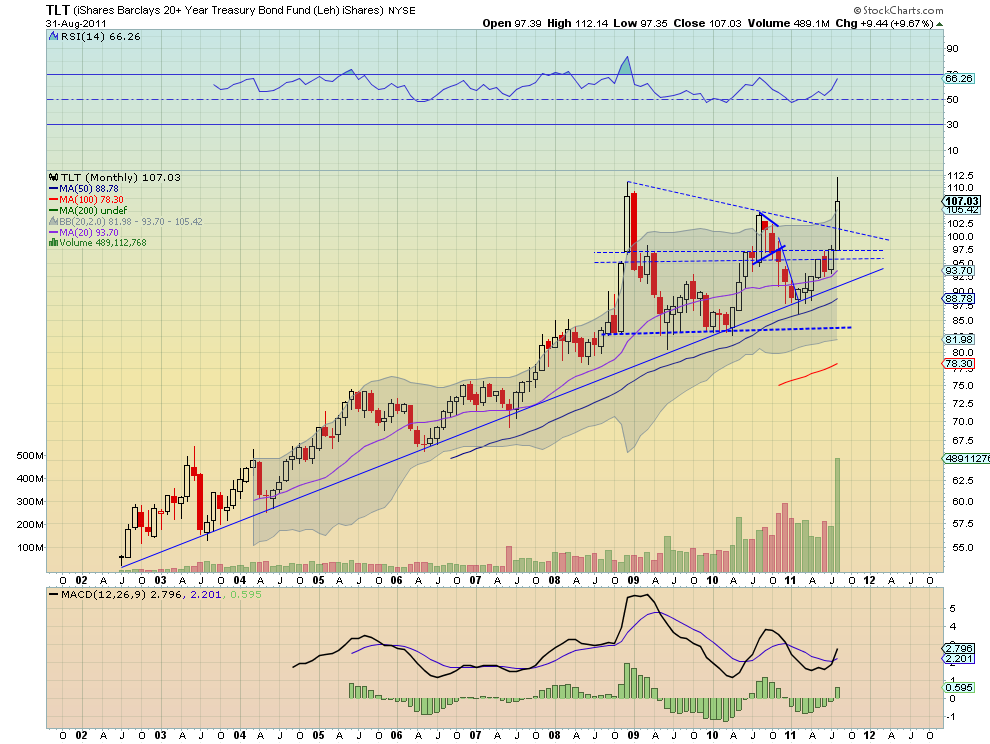
US Treasuries, as measured by the ETF $TLT,
broke above the two year symmetrical triangle on massive volume. It has a RSI
that points higher and a MACD that has just crossed positive both supporting
more upside. It printed a double top near 112 and pulled back slightly just
above the Bollinger band top, so it may consolidate. But longer term this chart
looks bullish. If it can get over 112 it has a MM on the pattern break to 137!
If that double top wins out and it moves lower, suggesting the volume is
indicative of a blow off top, then support lower comes at the previous top in
2010 at 104.80 and the top rail of the triangle at 101.26 before a move back to
the 95.30-97.50 area. Again, the chart favors the upside.
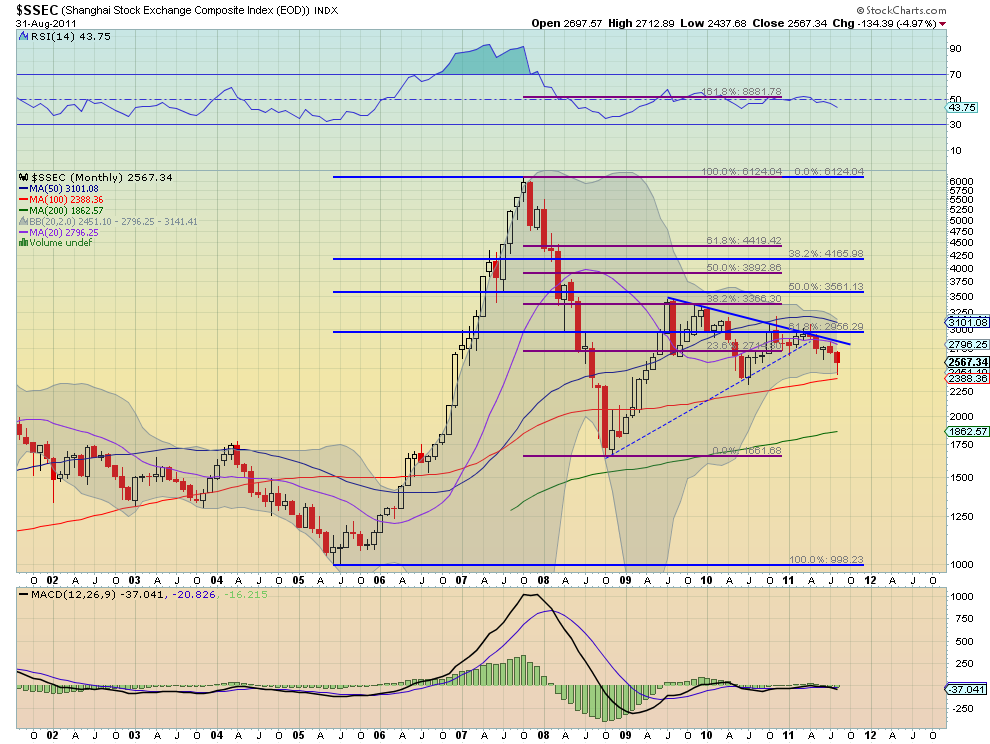
The Shanghai Composite continues to honor the resistance of the falling
trendline. The RSI is now moving lower like the shorter SMA’s, and the MACD
remains flat and not useful. Look for more grind lower from this Index with any
upside moves capped at 2715. Support on the downside comes at 2415 and then
2050.
iShares MSCI Emerging Markets Index, $EEM
Emerging Markets, as measured by the ETF $EEM,
rejected at the 48.20 resistance level and fell hard before recovering and
retaking the 42.20 support level. The candle for the month, suggests more
downside, despite the long shadow, and is backed up by a RSI that is rolling
down hard and a MACD that is about to cross negative. Look for more downside in
the coming months with any move higher capped at 44 and then the 48.20 area.
Support for the anticipated move lower may slow it down at 42.20 followed by
37.40 and 36.
The Volatility Index looks to have printed an interim double top at 48.22
this month with a long upper shadow similar to the other topping candle. With
the Bollinger bands expanding it could be prepping for more upside. If so
resistance should come at 35 and then the previous top at 48 followed by 60. But
it appears more likely that the longer term move will be lower with support at
25.50 followed by 22.30 and 20.50. The charts above give a mixed view on the
future of the $VIX so keep watching.
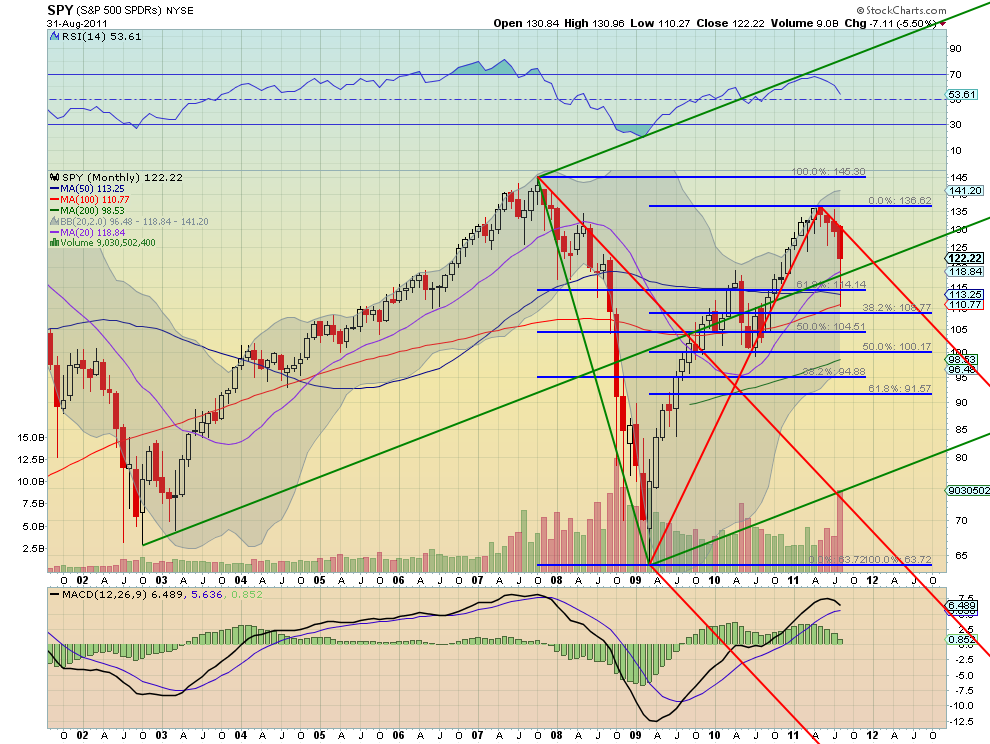
The SPY continued down along the Upper Median Line of the bearish red
Pitchfork during August, printing a long bodied red candle with a long lower
shadow, technically a Hanging Man since the long uptrend. The RSI pointing lower
and the MACD heading towards a bearish cross negative suggest more downside to
come. Any move higher over 123 can expect resistance at the Upper Median Line,
near 131.20 and then 136.62. Support on a continuation downward comes at 118.50
and then next at 116 and 114 before 108.77.
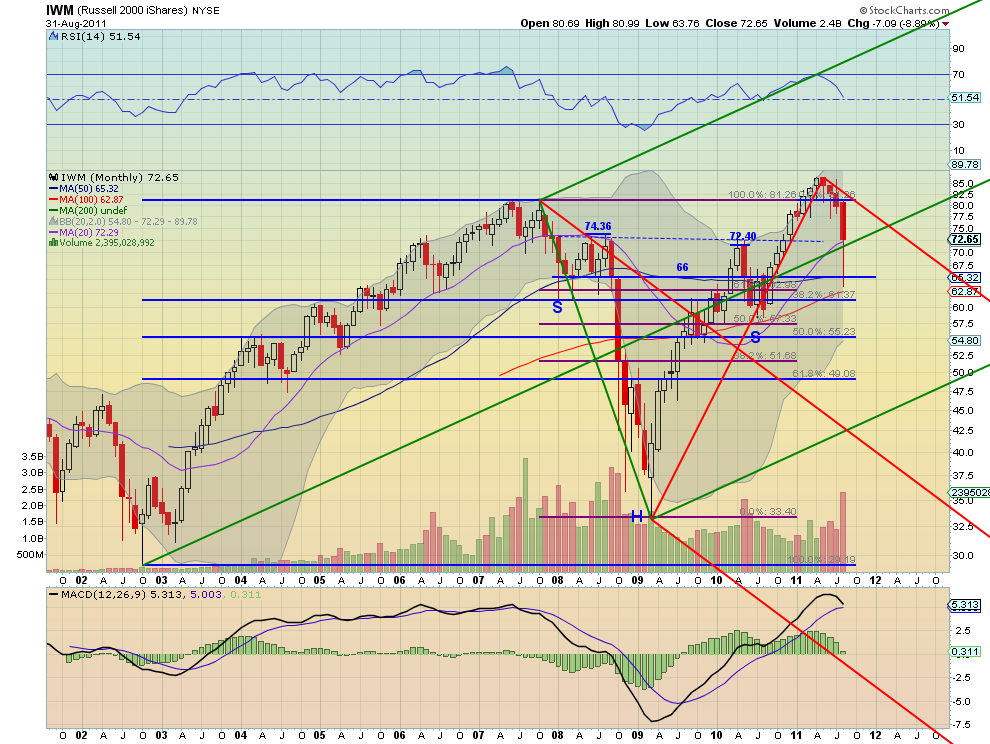
The IWM also continued down along the Upper Median Line of the bearish red
Pitchfork during August, with the same characteristics of the SPY. The RSI
pointing lower and the MACD heading towards a bearish cross negative suggest
more downside to come. Any move higher over 73.60 can expect resistance at the
Upper Median Line, near 81.15. Support on a continuation downward under 72.40
comes at 68 and then next at 66 and 63 before 61.37.
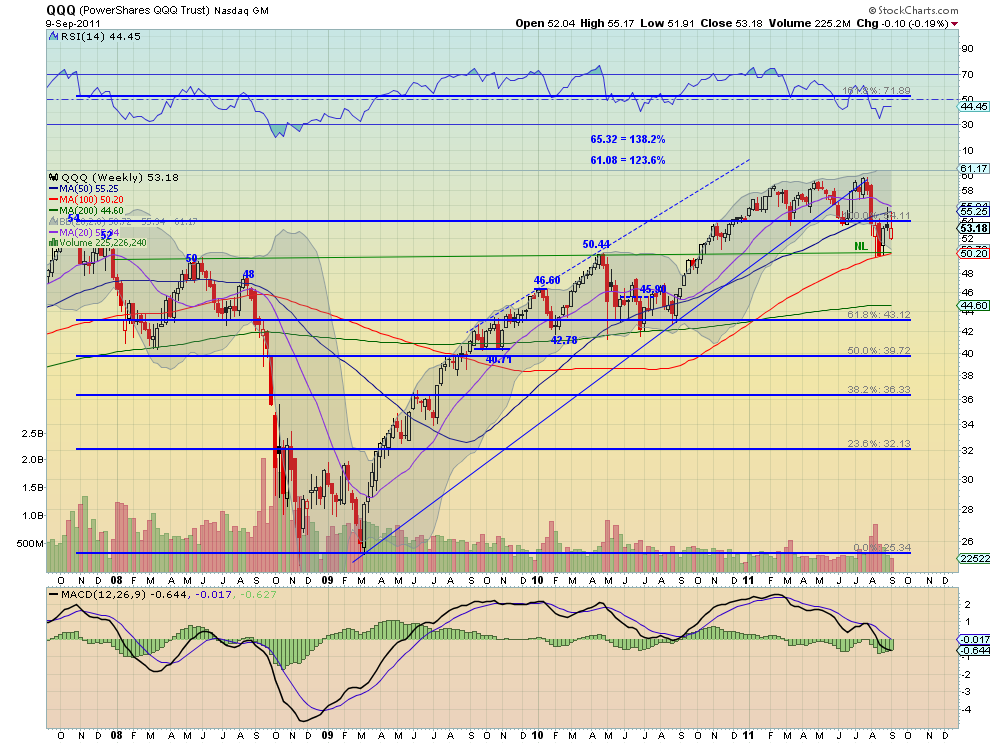
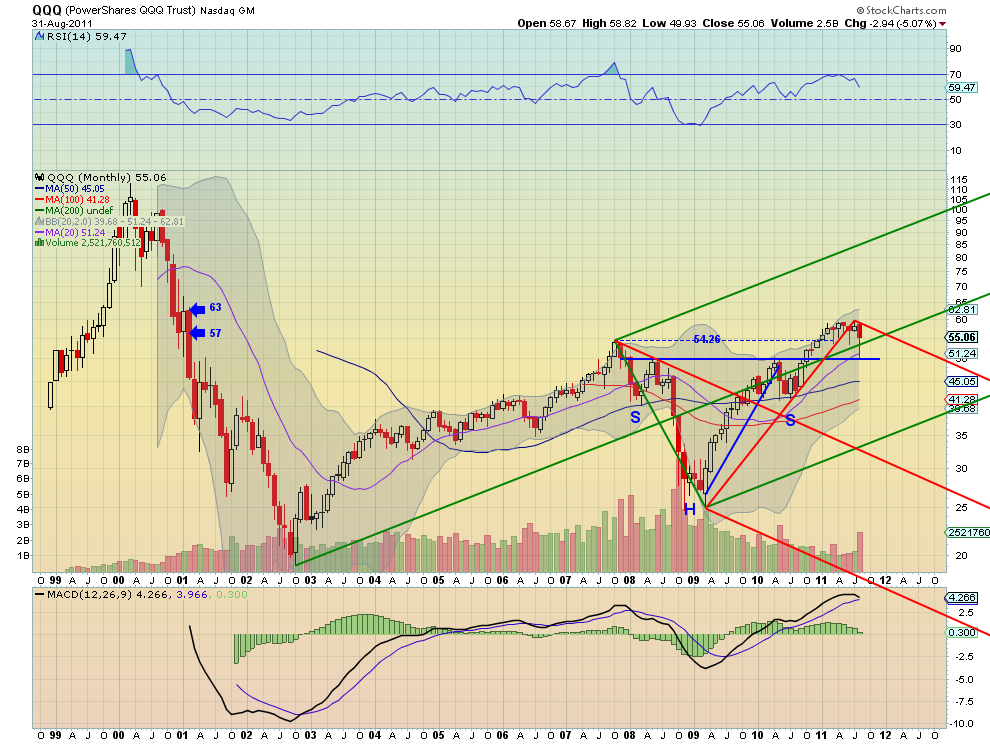
The QQQ continued to consolidate near its highs but with a wider candle
reaching down from the Upper Median Line of the bearish red Pitchfork. Also a
Hanging Man, it is bearish if confirmed lower next month. The RSI pointing lower
and the MACD heading towards a bearish cross negative suggest more downside to
come. Any move higher can expect resistance at 57 and then 60. Support on an
expansion downward under 54.26 comes at 50 and then next at 46.20 and 44 before
strong support at 42.20.
The monthly outlook suggests the upside for Gold and US Treasuries will
continue while the trend lower for Crude Oil and the US Dollar Index will also
continue. The Shanghai Composite and Emerging Markets look to continue to move
lower as well. Volatility can go either way but looks to remain above the lower
range experienced in the last six months with the VIX in a wide range between
the mid 20′s and 48. Despite that uncertainty, the Equity Index ETF’s SPY, IWM
and QQQ are set up to continue lower in the coming months. As noted on the
individual charts there is room for some short term upside without breaking the
downward bias. Use this information to understand the long term trends in
Equities and their influencers as you prepare for the coming months.
Etichette:
Analysis Technic,
analysis technic article,
articles,
commodity,
crude oil,
Currencies,
dollar index,
eMini SP,
energy,
financials,
gold,
metals,
oil,
T-Bond,
Vix,
Volatility
Subscribe to:
Posts (Atom)