Showing posts with label Real Estate. Show all posts

Sunday, September 18, 2011

TIME FOR A RALLY IN UNLOVED HOUSING STOCKS

by Tom McClellan

Sentiment could not be much worse for the U.S. housing market than it is right now. And why shouldn’t people be pessimistic? All of the governmental efforts to stimulate a housing rebound, so people start thinking that if the government cannot fix it, what can?

Meanwhile, most people are unaware of a major rebound brewing for the home building stocks. That is because most people are not readers of our publications.

This week, I’m revisiting a topic addressed here before, concerning the way that housing stocks tend to follow in the same footsteps as lumber futures prices. The price plot of lumber futures has been shifted forward in the chart by a year to reveal how the same patterns tend to show up in the PHLX Housing Sector Index HGX about a year later. It is not a perfect correlation; it is merely very good.
Lumber prices leading indicator for housing stocks
A year ago, lumber prices were finishing the bottoming process after pulling back to test the top side of a broken declining tops line. Lumber prices then surged into early 2011, which means that we should expect the HGX to see a similar surge into early 2012.

This next chart looks at the same relationship, but zooms in closer.
Lumber's leading indication for housing stocks
One important point to notice is that the lumber price top a year and a half ago was a lot sharper of a blowoff move than what ended up being seen in the HGX’s own topping structure. There is a very good reason for this. At the end of an ordinary up move in lumber prices, the Maule earthquake struck Chile on Feb. 27, 2010. That earthquake shut down lumber operations in that country, disrupting supplies and sending lumber buyers scrambling for alternate sources.

Once the lumber and other markets had a chance to recover, prices normalized and came back down from that sharp blowoff top. The HGX decline in 2011 matched the timing of the lumber decline in 2010, but not the magnitude.

The lessen here is that lumber tends to respond a year ahead of time to the economic forces which will strike the housing market a year later. I liken this to a wave passing under the end of a long pier. The same wave eventually strikes the beach, and so if you know the length of the pier and the speed of the wave, you can know when the wave will hit the beach.

The same economic wave which caused a decline in housing stocks in 2011 had caused a decline in lumber prices a year earlier. Lumber’s price pattern also reflected a temporary anomaly from the Chile earthquake, which was not a factor that affected housing stocks. That’s the hard part with using a leading indication like this, or any of our other Liquidity Wave relationships: one has to figure out which movements are due to economic forces, and which are due to something putting a thumb on the scale.

Lumber’s price rally in late 2010 was not due to any one-time factors like earthquakes, and so it seems much more likely to have its full echo observed in the prices of home builder stocks.

Sunday, September 11, 2011

IS IT TIME TO SELL GOLD AND BUY A HOUSE?


The struggling real estate market remains a concern for investors. For some perspective on home prices, today’s chart presents the median single-family home price divided by the price of one ounce of gold. This results in the home / gold ratio or the cost of the median single-family home in ounces of gold. For example, it currently takes a relatively low 94 ounces of gold to buy the median single-family home. This is dramatically less than the 601 ounces it took back in 2001. When priced in gold, the median single-family home is down 84% from its 2001 peak (to a level last seen in 1980) and remains well within the confines of a six-year accelerated downtrend and continues to close in on its 1980 trough.

See the original article >>

Monday, July 25, 2011

Property Loans Halted in China's 2nd and 3rd-Tier Cities; Is China's Spectacular Real Estate Bubble About to Pop?

by Mike Shedlock
Commercial banks are halting individual property loans in the face of tightening monetary policy and limited lending quota, the China Securities Journal reported Thursday.

"We will not accept property loan applications at present, even if it is from a first-time home buyer," a bank staff in Chongqing told the paper.

Meanwhile, some banks are mulling over whether to raise the ratio of down payment.

"You'd better prepare to pay 40 percent of your home price as down payment, because commercial banks are going to ask more for a property loan," said Gong Hang, a bank staff in Taiyuan, Shanxi province. "It is only a matter of time," he said.

Requirements for second-home loans have also become stricter in these cities. Home buyers may have to pay 50 to 60 percent of their home prices as down payments, with lending interest rates 10 to 15 percent higher than the benchmark rate, the paper said.
Jeremy Warner writing for The Telegraph says China's spectacular real estate bubble is about to go pop
So you thought that UK housing was unaffordable. Try Beijing and Shanghai, where as can be seen from the graphic below, prices are off the scale relative to income, the commonly used yardstick for measuring affordability. OK, so these are the boom cities of the Chinese economic miracle, but even on a nationwide basis, affordability is no lower than in the UK.


Residential and commercial property development have been such a big component of growth in recent years that anything that damages the property market risks upsetting the entire apple cart. Nobody can forecast with any certainty when the crash will come, but come it will. You cannot cram that much development into such a short space of time without there eventually being a correction.

And when it comes, its knock on consequences are going to be extreme, possibly just as seismic as the rolling series of banking crises we’ve had here in the west. As noted in the IMF’s latest staff report on China, published this week, the property sector occupies a central position in the Chinese economy, directly making up some 12pc of GDP. It is also highly connected to the health of basic industries such as steel and cement, and to the success of downstream industries like domestic appliances and other consumer durables.

More worrying still, direct lending to real estate (developers and household mortgages) makes up around 18pc of all bank credit (see second graphic below). Again, even by UK standards, this is extreme. And for local authorities, which account for 82pc of public spending in China, property related revenues are an important constituent of the overall revenues used as collateral to back borrowing to fund property and infrastructure development. There’s an element of ponzi scheme here.


Any reading of economic history reveals that in the end this path to growth and development is as unsustainable as excessive consumption. The Chinese leadership recognises this deficiency and is taking active steps to liberalise and reform, so as to achieve a more sustainable form of growth. Yet as the IMF notes, progress is painfully slow, and for the time being China is stuck on the treadmill of the old model. Personally, I doubt the switch in horses is going to occur without mishap.
Bubbles Pop

Jeremy Warner makes a case there is a bubble in Chinese real estate. Moreover, and by definition, bubbles pops.

The question at hand is "when?"

Warner states "soon". However, it is difficult to predict exactly when bubbles pop. There was clearly a Nasdaq dot-com bubble in 1998. However, the bubble got more extreme, rising another 100% in 1999. The bubble did not pop until March of 2000.

Australia's property bubble has popped and it will play out in years of pain. Many are still in denial.

A US housing bubble was brewing for years. Even after it popped in summer of 2005, many did not recognize that fact for 18 months as the chain reaction mentality "it's different here" spread to every city that had not yet burst.

We cannot say "when" China's bubble will burst or if it will be city-by-city as happened in the US, or one big bang where everything implodes at once.

However, we can say with certainty China's property bubble will pop. We can also say the longer it goes before it bursts the bigger the mess when it does. As with the US, the property bubble will take China's massive credit bubble and banking system with it. Indeed, China property bubble is only a subset of a much larger credit bubble.

China's implosion looks to be massive. Few are prepared for the implications of a rapidly cooling Chinese economy.

Wednesday, July 20, 2011

The Real Estate Market in 2030.


A number of analysts, and even some of those in the real estate industry, are finally coming around to the depressing conclusion that there will never be a recovery in residential real estate. Long time readers of this letter know too well that I have been hugely negative on the sector since late 2005, when I unloaded all of my holdings (click here for “The Hard Truth About Residential Real Estate”). However, I believe that “forever” may be on the extreme side. Personally, I believe there will be great opportunities in real estate starting in 2030.

Let’s back up for a second and review where the great bull market of 1950-2007 came from. That’s when a mere 50 million members of the “greatest generation”, those born from 1920 to 1945, were chased by 80 million baby boomers born from 1946-1962. There was a chronic shortage of housing, with the extra 30 million never hesitating to borrow more to pay higher prices. When my parents got married in 1948, they were only able to land a dingy apartment in a crummy Los Angeles neighborhood because he was an ex-Marine. This is where our suburbs came from.

Since 2005, the tables have turned. There are now 80 million baby boomers attempting to unload dwellings on 65 million generation Xer’s who earn less than their parents, marking down prices as fast as they can. As a result, the Federal Reserve thinks that 50% of American homeowners either have negative equity, or less than 10% equity, which amounts to nearly zero after you take out sales commissions and closing costs. That comes to 70 million homes. Don’t count on selling your house to your kids, especially if they are still living rent free in the basement.

The good news is that the next bull market in housing starts in 20 years. That’s when 85 million millennials, those born from 1988 to yesterday, start competing to buy homes from only 65 million gen Xer’s. By then, house prices will be a lot cheaper than they are today in real terms. The ongoing melt down in residential real estate will probably knock another 25% off real estate prices. Think 1982 again. Fannie Mae and Freddie Mac will be long gone, meaning that the 30 year conventional mortgage will cease to exist. All future home purchases will be financed with adjustable rate mortgages, forcing homebuyers to assume interest rate risk, as they already do in most of the developed world. With the US budget deficit problems persisting beyond the horizon, the home mortgage interest deduction is an endangered species, and its demise will chop another 10% off home values.

For you millennials just graduating from college now, this is a best case scenario. It gives you 15 years to save up the substantial down payment banks will require by then. You can then swoop in to cherry pick the best neighborhoods at the bottom of a 25 year bear market. People will no doubt tell you that you are crazy, that renting is the only safe thing to do, and that home ownership is for suckers. That’s what people told me when I bought my first New York coop in 1982 at one tenth its current market price. Just remember to sell by 2060, because that’s when the next intergenerational residential real estate collapse is expected to ensue. That will leave the next, yet to be named generation, holding the bag, as your grandparents are now.

Opportunities for Careful Investors

by The Investment Insight

THE current financial climate is making it harder to decipher where investors are going to find returns. The rates on holding cash are low, bond yields in general have narrowed substantially and there is much uncertainty on the outlook for the stock market. In addition, with macro risks on our minds and the sovereign debt crisis raising concerns, risk aversion is on the rise. In this environment, investing in something tangible that could provide a potentially uncorrelated return is attractive. Nevertheless, there has been a vast difference in returns from various investments in this market. Therefore, it will pay to be particular.

There has been a stark divergence of fortunes between property prices inside and outside of London. Location within or access to the city is a price-setter. Fundamentally, prime assets in attractive sectors should see a level of demand providing a floor on prices. Foreign investors have been quoted as spending £3.7bn per annum for London residences, due to the inviting exchange rate, national ties, as well as in some case the greater political stability that our city can offer. The emergence of an appetite for second homes has created demand in another segment of property investing, where the right location will again be crucial.

Students are another opportunity. Regional student housing is the UK’s best performing sector with around a 15 per cent ROI last year thanks to a shortage of suitable one-bed apartments. Broadly speaking, this is a “buy-to-let” approach. Rental rates are at all-time highs and the short-let market is booming. It is predicted that for the Olympics, rates will increase six-fold.

Therefore, depending on your strategy, timing may also be crucial. To play the school or student market, the run up to September is a key window of opportunity. The challenge is in finding the investments that fit your aspirations, and putting your plan into action at the right time. In a desired area, properties can attract multiple buyers, making this task tougher.

Nevertheless, with inflation one of the biggest threats to the market currently, implementing the right strategy and picking the right property will help provide some protection.
Source: www.workforce.com


Saturday, July 16, 2011

NEW EVIDENCE OF A CHINESE HOUSING BUBBLE

by Cullen Roche

When people discuss the surge in Chinese real estate you’ll often hear that the issue is not broad and is instead contained to a few of the larger cities (sounds familiar – hello Miami, Los Angeles, NYC and Boston!), but new research from Professor Christian Dreger and economist Yanqun Zhang say the problem is more wide ranging and consistent with a bubble that threatens the Chinese economy:
“In recent research (Dreger and Zhang 2010), we use a dataset for 35 major cities to estimate the size of the bubble relative to the equilibrium level implied by the panel cointegrating relationship. We suggest that positive deviations from the long run might indicate the presence of speculative bubbles. However, many analysts have argued that a bubble has emerged only in recent years, probably spurred by the recent fiscal stimulus package (Wu et al. 2010). Hence, the evidence can be misleading if the cointegration relationship is considered over the entire period. In a first step, we estimate the long-run relationship only up to some point in time. The fundamentals include real per-capita income, real interest rates, real land prices and population. Cointegration between these variables and the real house price can be established. City fixed effects are embedded to control for unobserved heterogeneity.
In the second step, the house price evolution is predicted over the rest of the sample, i.e. the last two years, where perfect foresight is assumed with respect to the fundamentals. This gives an estimate of the fundamental development of house prices, and the size of the bubble can be addressed. As an exception, land prices are held constant throughout the forecasting horizon to reduce endogeneity problems.
Our results indicate the presence of a house-price bubble. In Figure 1it can be seen that increasing imbalances have emerged over the past two years. For example, real house prices in Shanghai have been 28% above the long run equilibrium in 2008, and 35% in 2009. While the evidence is similar for Beijing, the increase is more spectacular in Shenzhen. Compared to the cointegrating relation, real house prices are overvalued by 66% in 2009, after 23% in 2008. In general, the bubble is more pronounced in the special economic zones and the south-eastern coastal regions. Overall, the size of the bubble is 20% in 2008 and 25% in 2009, regardless of whether GDP or population weights are applied.”
Figure 1. House price bubble in major Chinese cities

Thursday, June 30, 2011

Chinese Homebuyers Throw a Life Raft to the U.S. Housing Market

By Jason Simpkins

From New York to Honolulu, Chinese homebuyers are swooping in to help salvage the U.S. housing market.

Indeed, California, Florida, New York, and even Hawaii have seen a marked up-tick in home sales to Chinese buyers who are exporting their country's real estate boom to the United States, according to Bloomberg News.

Increased regulation at home and education and investment opportunities are chief among the reasons real estate in the United States - as well as the United Kingdom, Australia, and Canada - has piqued Chinese interest.

According to a survey by the National Association of Realtors, Chinese buyers accounted for 9% of foreign home purchases in the 12 months ended in March of both 2010 and 2011. That's up from 5% in 2009.

"The purchase restrictions in China drove them overseas, while they look for investments to counter the inflation," Mo Tianquan, founder and chairman of Beijing-based SouFun Holdings Ltd. - a company that runs China's biggest real estate Website and organizes buying excursions abroad - told Bloomberg. "Some of them will buy homes considering better education opportunities for their kids, while others look for immigration options."

Take Cupertino, Calif., for example. Sales of existing single-family homes in Cupertino rose 21% in the first quarter from a year earlier, largely due to an influx of Chinese shoppers who are making huge cash purchases.

"We're seeing a huge number of all-cash transactions, and most of those are from mainland China," Nina Yamaguchi, managing broker at Coldwell Banker's residential office in Cupertino, told Bloomberg. "The thing that draws the Asians here is the schools are so highly touted. Cupertino is certainly not beautiful. It doesn't have wonderful architecture." 

Of course, education isn't the only reason many Chinese people are seeking abodes abroad. They're mainly concerned with the high prices and increasingly strict regulations they're finding at home, and looking for better investment opportunities.

Bailing on the Bubble

China's housing market certainly seems to have gotten ahead of itself.

Goldman Sachs Group Inc. (NYSE: GS) said in a recent report that housing price increases have outpaced wage hikes by 30% in Shanghai and 80% in Beijing in recent years.

The value of homes sold in the first quarter of 2011 increased to $132 billion (860.7 billion yuan), driving overall property transactions 27% higher to $157 billion(1.02 trillion yuan), according to the Statistics Bureau.

Overall investment in China's real estate market rose 34% to $136.4 billion (885 billion yuan) in the first quarter.

Furthermore, UBS AG (NYSE: UBS) economist Jonathan Anderson estimates that property construction alone accounted for 13% of gross domestic product (GDP) in 2010, twice the share of the 1990s. That means China's economy has grown increasingly vulnerable to a real estate bubble.

As a result, China's government over the past year has sought to cool the housing market by increasing regulation.

In January, Beijing raised the minimum down payment for mortgages on second homes to 60% from 50%. The government has also increased down payment requirements on homes that cost more than $770,000 (HK$6 million) and enacted China's first property tax.

However, the measures have had only a modest effect. Annual property inflation eased to of 4.2% in May - its slowest pace this year, but down only slightly from April's 4.3%.

And the value of home sales climbed 16% in the January-May period, as property investment rose 35%.

An Investment Opportunity

Higher prices and tougher regulations at home may be the biggest reason many Chinese homebuyers have sought shelter overseas, but it's not the only reason. There's also an investment aspect.

"The majority of these buyers are not buying trophy properties, but cash flow as they understand fundamentals," Andrew Waite, publisher of Personal Real Estate Investor Magazine. "They are buying managed turn key rental properties. One of my clients is selling about 25 homes a month to Asian buyers at an average price point of $60,000 with positive cash flow. They understand that rental real estate offers one of the few inflation indexed assets available with inflation-indexed income."

Indeed, one of the most popular properties among Chinese buyers is the Trump SoHo in New York. The Trump SoHo is a condominium hotel where the apartments are rented out as hotel rooms for more than half the year and owners share the revenue.

"Chinese love the Trump," Asher Alcobi, president and co-founder of Peter Ashe Real Estate, told Bloomberg. "Anything that has the Trump name is good."

Given the huge mark-up in Chinese real estate, even luxury properties in New York look like a bargain.

"From a price perspective, New York is actually cheap," Wei Min Tan, founder of Castle Avenue Partners, a group within New York's Rutenberg Realty that assists buyers from overseas, told Bloomberg. "Hong Kong is 50% more expensive than Manhattan on a square-foot basis."

Other pricey assets in Las Vegas and Honolulu have garnered a lot of attention as well, helping to stabilize home prices across the country.

And that help is desperately needed.

Sales of previously owned U.S. homes fell 3.8% month-over-month in May to an annual rate of 4.81 million units - the lowest level since November. Home resales were down 15.3% in the 12 months through May.

Meanwhile, the median price for a home fell 4.6% year-over-year to $166,500. That compared with a 6.6% decline in April.

Wednesday, June 1, 2011

Its Official: Housing Double Dip is Here

By Barry Ritholtz

Case Shiller is out, and it confirms what we have known for quite some time: Without artificial government stimulus, Housing is going lower.

The double dip in Housing has now been officially recognized:
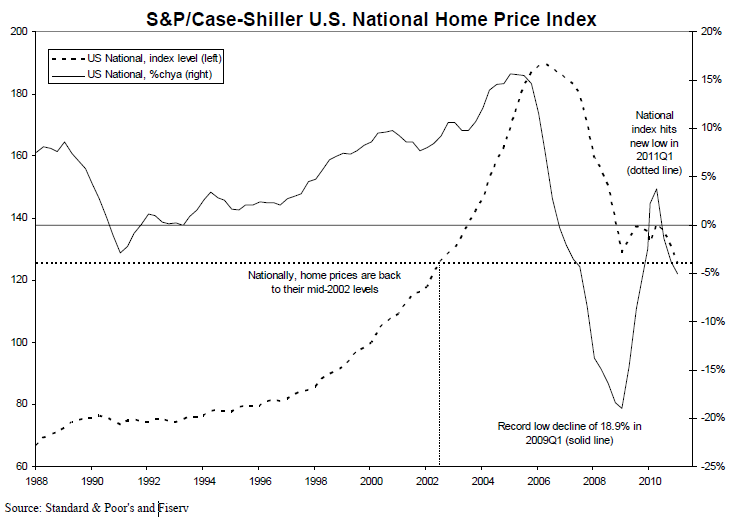
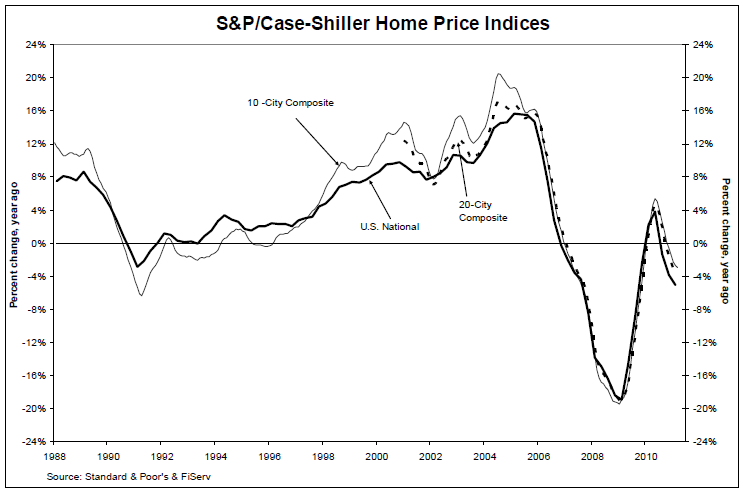
“Data through March 2011, released today Case-Shiller Home Price Indices show that the U.S. National Home Price Index declined by 4.2% in the first quarter of 2011, after having fallen 3.6% in the fourth quarter of 2010. The National Index hit a new recession low with the first quarter’s data and posted an annual decline of 5.1% versus the first quarter of 2010. Nationally, home prices are back to their mid-2002 levels.”
>


See the original article >>

Saturday, May 14, 2011

ALL CASH BUYERS PREVENT HOUSING MARKET COLLAPSE

By Keith Jurow

I’ve asserted in previous writings that buyers paying all-cash for properties have been keeping some of the worst bubble markets from collapsing. Inside Mortgage Finance, which surveys roughly 3,000 brokers each month and issues a monthly report, revealed at the end of March that a record 33.7% of property purchases nationwide were all-cash.

The National Association of Realtors (NAR) conducts an Investment and Vacation Home Buyers Survey annually. The latest survey covering 2010 found that a record 59% of investors paid all-cash for their property. That figure was only 32% in 2006 and a mere 17% in 2004 according to previous NAR surveys.
For Broward County on the Florida east coast, the Southeast Florida MLS reported that a record 69% of all February property sales were all-cash purchases. Zillow.com revealed at the end of February that 54% of all sales in the three south Florida counties of Dade, Broward, and Palm Beach were purchased with cash in the fourth quarter of 2010. In California, 30% of all 2010 sales were cash purchases. According to the highly-regarded California blog, drhousingbubble.com, the average in that state over the last 10 years was a mere 12.9%.

Take a look at this amazing chart showing cash sales in Phoenix.
Notice that while cash purchases have been a substantial portion of Phoenix sales since early 2009, it reached a record 50% in January of this year.

Who are these all-cash buyers? Leif Swanson, the creator of this chart and an active Phoenix broker, explained to me that many were over 50 with plenty of liquid assets who could not stand the interest rates they were getting. This was also told to me by Jim McClelland, Sr., a major property “redeveloper” in Chicago who resold many of his foreclosure purchases to all-cash investors. Most were cash buyers who were 50+ years old and were tired of earning interest rates of 1% or less.

Can you blame these 50+ savers, especially those nearing retirement? Take at look at what has happened to their interest income because of the Fed’s policies.
A substantial number of these savers are what I consider to be reluctant real estate investors. They are being pulled into this arena by the plunge in their interest return. I strongly suspect that many have little sense of how much risk they are taking with their capital.

Consider this example from a March 1 article in the online Palm Beach Post about all-cash investors. One retired couple decided to buy a three-bedroom home for $149,000 in cash because they believed a home would bring a better return on their money than a CD or other investment. The wife said that “any kind of interest income is so low right now, we might as well put it into a house.” She went on to predict that “If prices go down any more, they’re not likely to go down appreciably.” Had she read the second issue of my Housing Market Report and its focus on Miami-Dade County, they might have reconsidered their decision to buy.

Or take this example from an early February article in the Wall Street Journal. A 62-year-old piano teacher saw a three-bedroom bungalow that was listed as a short sale last summer in Georgia. The desperate sellers had dropped the original asking price of $159,000 to $129,000 and then to $79,900. Sensing that the market was awful, she offered $50,000. The sellers accepted $52,000 in cash.

While these purchases may make good sense, they aren’t necessarily smart investments. On April 25, I spoke again to noted real estate writer, San Diego State University lecturer and investor Leonard Baron about purchasing investment properties with cash. He reiterated that these investors must do a careful due diligence analysis to see if the property makes financial sense. Link to his terrific 7-page due diligence checklist on his website for the tool to enable you to do this – professorbaron.com. On the right side of his homepage, you will see the table of contents for his book. Link to Chapter One and it will take you to the checklist. Just scroll down a little until you see it. You can print it out and then use it for your analysis. You’ll be glad you did.

Would most of these older, all-cash buyers be searching for investment properties now if interest rates had not been pushed down so dramatically by the Fed? Think about it. If you were either close to retirement or actually retired, would you be plunking down anywhere from $50,000 to $1 million or more in cash on a house or condo if the interest rates on your Treasury securities, CDs, bonds, or money market funds were at historical norms?

The vast majority of these cash buyers (excluding perhaps some foreign investors) are not speculators. If they can land a decent tenant, the investment might make good sense. Yet do they really have a good idea about the state of the housing market where they are investing their hard-earned savings? If I thought they did, I would not have launched my Housing Market Report.

On the basis of my in-depth research, it’s quite clear to me that the “normal” housing market in most major metropolitan areas is shrinking. The percentage of sales in these markets which are distressed properties – either foreclosures or short sales – is climbing steadily. Conversely, the percentage of homeowners wanting to sell who still have equity left in their property is declining. My goal is to inform readers why this will not turn around anytime soon.

Friday, May 6, 2011

CLEAR CAPITAL: THE HOUSING DOUBLE DIP IS NOW OFFICIAL

by Cullen Roche

Well, this is no surprise to regular readers. We’ve been expecting a double dip in real estate for well over a year now. As soon as the government stepped out of the market the weakness was likely to reemerge and that is exactly what has happened. According to Clear Capital, the double dip in real estate is officially here as housing prices make fresh new lows:
TRUCKEE, CA – May 5, 2011 – Clear Capital (www.clearcapital.com) today released its monthly Home Data Index™ (HDI) Market Report, and reports prices have double dipped nationally 0.7 percent below prior lows experienced in March 2009. This month’s HDI Market Report provides the most current (through April 2011) and relevant analysis of how local markets performed compared to the national trend in home prices.
Report highlights include:
  • National quarterly home prices changed -4.9%; while year-over-year national price changes reached -5.0%.
  • National home prices have fallen 11.5% over the previous nine-month period, a rate of decline not experienced since 2008.
  • In a sign of the continued volatility and fragility of home prices, all the major Metropolitan Statistical Areas (MSA) tracked in this month’s report showed quarter-over-quarter price declines.
  • National REO saturation rate reaches 34.5%.
“The latest data through April shows a continued increase in the proportion of distressed sales that are taking hold in markets nationwide,” said Dr. Alex Villacorta, director of research and analytics at Clear Capital. “With more than one-third of national home sales being REO, market prices are being weighed down as many markets have not regained enough footing to withstand the strain of the high proportion of REO sales.


See the original article >>

Thursday, April 14, 2011

Chinese Real Estate Bubble Pops: Beijing Real Estate Prices Plunge 27% In One Month

by Tyler Durden

Could the Chinese monetary tightening be working? The National Bureau of Statistics has released its latest food price update for the period April 1-10, which shows that while most foods continue to rise modestly, several food products have plunged particularly cucumbers and rapes, both falling 8.8%, kidney beans 6.3% and kidney beans down 6.3%. Yet this is nothing compared to what is happening to Chinese real estate: it appears Chanos' long anticipated property bubble may have popped... but the supersonic boom is so loud that nobody has heard it yet.
Prices of new homes in China's capital plunged 26.7% month-on-month in March, the Beijing News reported Tuesday, citing data from the city's Housing and Urban-Rural Development Commission.

Average prices of newly-built houses in March fell 10.9% over the same month last year to CNY19,679 per square meter, marking the first year-on-year decline since September 2009.

Home purchases fell 50.9% y/y and 41.5% m/m, the newspaper said, citing an unidentified official from the Housing Commission as saying the falls point to the government's crackdown on speculation in the real estate market.

Beijing property prices rose 0.4% m/m in February, 0.8% in January and 0.2% in December, according to National Bureau of Statistics data.

The central government has launched several rounds of measures since last year designed to cool the housing market, though local government reliance on land sales to plug fiscal holes mean enforcement hasn't been uniform.
The only question is how much actual equity buffer was used in these purchases. For all intents and purposes a drop of this magnitude levered even 2 times (assuming 50% or so equity down) means that China is on the verge of a complete bubble implosion. If the pummelling in the Beijing real estate market shifts to other cities not only is the Chinese tightening regime over, but the SHCOMP in the next few weeks could get very interesting as people understand the world's biggest marginal bubble has popped.

See the original article >>

Friday, March 11, 2011

China Housing Market Bubble Bust Could be Dubai X1000

By: MISES

Markus Bergstrom writes: It's an eerily familiar story. Shortly before the American housing bubble burst, pundits across the globe argued that the world had reached a new plateau of economic growth, where the old rules of economics no longer applied — "this time it's different." The same has been said about the current boom in China, specifically with regards to its large degree of top-down state control over the economy, which somehow enables it to ignore the laws of economics.
 
Indeed, this notion seems plausible according to traditional Keynesian aggregates. After all, China's GDP growth recovered in record time and at record pace from the global slowdown in 2008, hitting a staggering 10.7 percent toward the end of 2010. While some of this growth certainly comes from true economic development, a substantial portion is driven by monetary expansion, government "stimulus," and a massive, unsustainable real-estate bubble.

In 2008, in order to get back to postcrisis growth levels, the Chinese government prescribed a favorite statist remedy for times of economic hardship: monetary expansion. This was "necessary" in order to increase domestic investment and consumption, as well as to compensate for the slowing down in exports. In November 2008 the government also announced $586 billion worth of "investment" with the very same purpose.

However, when governments claim to be "investing" in something, one should always substitute it for "spending" or "printing money." As governments rarely spend money with the hope of reaping a profit, there's no way of knowing whether it was put to productive use or not. Even when profit-and-loss calculations guide these "investments," the capital still comes from forced taxation or inflation rather than voluntary savings. Thus it's still impossible to determine whether the money could have been spent on something better.

Hello, Anybody Home?

Well-known Austrian investor Jim Rogers has long played down speculations about a major Chinese bubble. He argues that while real-estate prices in some coastal cities are overheated, a cool-down of these would leave a slight dent on Chinese growth rather than result in a major slump. The rest of the country, he says, is "hardly in a bubble."

Another well-known Austrian investor, Doug Casey, is a lot more pessimistic, arguing that China "is in an unbelievable real estate bubble," which will cause "millions of Chinese — and the banks that lent them money — [to] lose everything."

There is certainly good reason to be concerned about China. A study conducted last summer by the Beijing University of Technology reported that a typical Beijing flat costs a staggering 22 times the average income in the city, while The Telegraph reported in December that the same figure for the city of Shenzhen is 18. On a national level, the Chinese Academy of Social Sciences (CASS) concluded last year that a typical Chinese property costs 8.8 times the average income. Compare this to just 5.5 in the United Kingdom in 2007 and 4 in 2009. In the United States, home prices peaked at a little over 5 times average income during its housing bubble, according to the S&P Case-Shiller Index.


A housing development in Ordos

As in the United States, the Chinese real-estate market is plagued by overconstruction, and not just in megacities like Shanghai, Beijing, and Shenzhen. Brand-new ghost towns have sprung up all across China in recent years, the most famous of which is perhaps Kangbashi in Ordos, Inner Mongolia. That city's housing capacity can currently accomodate well over 300,000 residents, yet only one tenth of that number actually live there. Numerous other lesser-known cities also boast swaths of high-rise apartments and majestic public buildings while appearing to be entirely devoid of residents.

Jim Chanos of Kynikos Associates claims that the new office space currently being constructed in China is enough to provide a five square-foot cubicle for every single citizen in the country. And that's just corporate real estate. 
Finance Asia reports that some 64 million homes and apartments across China have sat empty for the past six months, enough to house 200 million people — 15 percent of the country's entire population. Along the same lines, a study conducted in 2007 by the Beijing Union University found that 27 percent of all newly sold apartments in over 50 different residential areas in Beijing remained unoccupied.

Why, then, is this mad overproduction continuing? After all, such massive discrepancies between units produced and units actually inhabited should result in falling prices. However, most new real-estate developments are actually snapped up before they're even built. The buyers are usually speculators who refrain from even renting out the properties, hoping instead that they will yield even higher profits once flipped in pristine condition in the future. Bill Powell of Fortune recalls a neighbor in Shanghai who has bought a staggering 43 homes in just three years for this exact reason.

This absurd demand is in turn enabled by the aforementioned credit expansion. Officially, Chinese M2 grew by 58 percent between November 2008 and December 2010, while total bank lending (including informal lending) is said to have doubled in 2009 compared to 2008.


Monetary Aggregates for China (measured in 100 million Yuan)
Source: The People's Bank of China (Central Bank of China)

A contributing factor to the real-estate mania is that, to most Chinese, real estate is the most lucrative and (seemingly) the safest investment option available compared to the alternatives; bank deposit rates are below CPI inflation, domestic stocks and other equity have performed poorly in recent years (to say the least), and capital controls still prevent citizens from investing overseas.[1]

More than Meets the Eye

Of course, overproduction and overpriced property weren't the only factors behind the American financial crash. Another major ingredient was the house of cards that made up the American mortgage market, which, at first glance, looks considerably different in China. For example, the down payment requirement for first homes is 25 percent, while the same figure for second homes is 60 percent (up from 50 percent in November last year) — third homes and everything beyond that require all-cash financing. Furthermore, reserve requirements for major Chinese banks were raised to 19.5 percent in January, following several increases in 2010.

Yet these factors pale in significance when viewed against China's huge informal economy. For example, recent estimates by Fitch Ratings suggest that China's banks lent out some 30 percent more credit (informally) than the government-regulated target of 7.5 trillion yuan ($1.1 trillion) in 2010. This comes despite the major curbing efforts by the government, as well as the fact that the four biggest banks in China are all — ironically enough — state-owned.

Rather than reducing the cash flow, the tighter regulations have simply encouraged banks to get creative about their credit pumping. By repackaging and selling off loans to state-owned trusts and asset-management companies, banks have been able to keep their true lending at about the same levels as before while simultaneously staying below their official quotas. At other times, the banks have turned loans into investment products and sold them to private investors, much as American investment banks did during the 2000s.

The situation is not made easier by China's lack of property rights in land, all of which is owned by the government and leased out to private and state-owned companies through so-called land-use rights. In turn, the sales of these rights constitute a vital revenue stream for local governments, providing powerful incentives for them to help spur the real-estate boom. This adds another explanation to the ghost towns all across China. Many local governments will find themselves in economic peril as revenue dries up.

Some may point out that China has both higher household savings and less private and public debt than the United States, which will help soften the blow from a real-estate slump. This is true to some extent, but things are not as simple as they first appear.

For example, Ernst & Young estimated as far back as 2005 that the total bad debt held by China's banks was then close to $1 trillion. The number today is probably several times that, given the fact that lending has exploded in the last two years. Mortgage levels are also increasing rapidly: almost half of all residential properties sold in 2009 were funded by bank loans; in 2007 it was only 20 percent.

Another example comes from Professor Victor Shih of Northwestern University's 2009 study of China's public debt. He concluded that it is more likely to be somewhere around 40 percent of GDP, rather than the official 20 percent. Even the director of one of China's state-owned research institutes put the public debt at an estimated 50 percent last summer.

Hence both public and private debt could equal a substantial portion of China's $5.7 trillion GDP.

China's $2.8 trillion foreign-currency reserves will be of little help to recapitalize banks or prop up local governments, as these reserves would mostly be good in an external debt crisis, not a domestic one (among other things, trading in these reserves for yuan would cause the currency to appreciate sharply, damaging China's exports). And, for the record, the United States of the late 1920s also held massive foreign-currency reserves, as did Japan in the late 1980s.

China's gold reserves will be of even less help, as they only amount to about 1.7 percent of the foreign-exchange reserves.

Inflation or Stagnation?

It's obvious the bust will have an impact on sectors beyond real estate and construction. Some analysts even believe that China's GDP growth will drop to around 5 percent, i.e., half of its current level. Fitch Ratings and Oxford Economics recently did a study on what might happen if this came true. Among the main conclusions was a major economic slowdown in both developed and emerging economies in Asia, with GDP levels almost halving across the continent. The sectors most likely to suffer in China and elsewhere included steel, energy, and heavy manufacturing.

The report also predicts a 20 percent plunge in industrial-commodity prices following such a scenario, which would have serious implications for countries like Australia and Canada, both of which are heavily reliant on mining exports. This is of particular importance to Austrian investors and anyone else looking to such commodities and mining stocks as a hedge against looming American and European inflation.

In China, too, price inflation is a growing concern. The official number in late 2010 was 5 percent — a 28-month high. In reality, though, this number is likely to be far higher, as food prices alone jumped by an estimated 50 percent in Shanghai last year, even doubling in other parts of the country. Li Wei of Standard Chartered expects official price inflation to reach 8 percent just in the first half of this year, while Yu Song of Goldman Sachs expects it to go north of 10 percent.

In December last year the Politburo announced it would move from a "relatively loose" monetary policy to a more "prudent" one in 2011. Apart from destabilizing the economy, the government knows that high inflation can also trigger civil unrest. This was, for example, a root cause of the Tiananmen Square protests, where the official CPI jumped from 7.3 percent in 1987 to 18.5 percent in 1988, and then to 28 percent in early 1989. Then as now, there is growing unrest in China over soaring consumer prices, yet many people reluctantly accept it — just as long as the economic boom carries on.

Conclusion

China may very well become "Dubai times 1000," as Jim Chanos puts it, though the jury is still out on what the actual magnitude of the crash will be.

While the economic systems of China and precrisis America are certainly different, below the surface China is plagued by staggering levels of credit expansion, speculation, malinvestment, and toxic loans — much like what we saw in America. The notion that the iron-fisted Chinese government is in control of this situation is a dangerous one. The laws of economics are omnipresent and cannot be overridden simply by force. Trying to apply top-down central planning to an economy that is more and more driven by bottom-up market forces will inevitably have grave consequences. Wild credit expansion always leads to the same things: price inflation, malinvestment, and bubbles.

Monday, March 7, 2011

Dubai Property Market Crash BubbleOmiX Update 2011


If you drive out on the highway towards Abu Dhabi past the Jebel Ali Free Zone, look on the right and you will see, partly covered in sand, the remnants of the billboards that used to declare, “Where the Vision of Dubai Get’s Built”.

I met a guy who claimed to have come up with that tag-line. He was a young American, very nice and very-very smart, based in New York working for a big-name branding company, with absolutely no clue of what Dubai is/was about. But he was making really good money, and that’s fundamentally what everything is about, in Dubai.

That particular “vision” was going to be bigger than Hong Kong. My conversation with the nice young American was a big factor in what made me decide to “retire” the part of my business that did real estate consulting. 

Up to then I could explain what was happening and if I did a ten-year projection on the revenue stream for a shopping mall or a hotel, I’d have a pretty good chance of being within 20% on Year Ten. Starting 2007 my models broke down. The “crunch” came when I gave my “”opinion of value” to an investor on a “fantastic-once-in-a-lifetime” plot of land that was being offered at a very special price that only someone “really connected” could get, of $200 a square ft of GFA. 

I told him that was a stupid price and he should not buy; three months later he called me in a huff to complain that the land had been flipped at $300. I said “OK but you were going to develop (a four-to-five year commitment), not flip; and anyway I don’t do gambling”. That didn’t go down well and we haven’t spoken since; although I did notice his Ferrari in the long-term parking at the airport a while back, covered in dust.
Anyway, the “vision” that I’d been working with until then was the one that Sheikh Rashid told to my mate Eric Tulloch (sadly departed) in 1978.

 “I will build the infrastructure and the rest will follow”.
At some point in all the excitement, that vision got changed to:
“We will build the rest and the infrastructure will follow”.

Back then I knew nothing about bubbles but I was fascinated with Dubai and how and why the economy had more than doubled in size from 1990 to 2000, and then more than doubled again from 2000 to 2005. In 1990 Dubai was 15% the size of Singapore; in 2005 it was half its size and Singapore is no slouch when it comes to allowing free-market economics to rip, like when you start main-lining Adam Smith mixed with Speed.
Then there was the bubble, then there was the bust, and here we are.

What Next?

This is a chart that I put up in July 2009 which was when I think I finally figured out how bubbles work. I’ve updated it to my estimate of where prices are now (the Orange dot).


That orange dot is about 10% below where I predicted, I think the reason for that is I had not anticipated how much the bust would affect economic activity and also I under-estimated how much pipeline inventory there was. Although in my defence by that time I’d found other jobs for my researchers so I was eyeballing.
What caused the bubble in property in Dubai was pretty simple, (although I admit it took me about a year to “twig” what had been going on).

Up to early 2007 the price of housing (rentals and owned) had tracked the ratio of economic activity divided by the numbers of housing units, just like it does everywhere in the world. Sure interest rates are important but local interest rates hardly changed over that period. 

But there was a lot of growth in the economy, on top of that was the start of property that foreigners could own, called “freehold”, which created a bit of a feedback loop as more and more people got involved in property, and they all needed a place to live, so more and more people got involved in property, round and round.

Then people piled in from far-and-wide with money in their pockets so then there was a shortage of new places to live, and so prices got bid up, for anything that was available. That resulted in a huge discrepancy between rents/prices for new units and what tenants in the older units paid in rent (there was no market for sale in that sector since foreigners could only buy freehold), so prices of the new stuff almost doubled. Everyone was looking at the “new” prices, which reflected only a sub-section of the market, rather than the market as a whole.

The red line “Other than Market Value”, is where (in my opinion) prices ought to have gone if the market had been “efficient”, and would probably reflect the whole market of rental (practically everyone rents in Dubai), if the “older” units were included. But there are no statistics on that; in fact there are hardly any statistics on Dubai, and those that there are, are one-year to eighteen months late, which is pretty useless in a place that’s changing that fast. 

In my opinion, the lack of meaningful statistics was one reason there was a bubble, which was a classical example of “asymmetry of information”, people would look at the newspapers, they could see that an apartment could rent for say $25,000, and that the nominal yield was say 5%, so it made sense to pay $500,000.

But the “assumption” they made was that the price they could rent-out a new unit for today was a reflection of what the whole of Dubai was paying, on average. And as we all know, “Assumption is the Mother of all Frappuccinos”. 

Then, the big-name branded real estate consulting companies who didn’t have any more of a clue of how Dubai worked, than the nice American branding expert; piled into town, and they got paid big bucks “facilitating” the new-boys-in-town bankers like RBS and Deutsche Bank to lend $100 billion to developers based on “sure-fire” RICS valuations; plus a total misunderstanding about how the constitution of the UAE works, as in “sorry sweetheart, Uncle Abu Dhabi is not your fairy godmother”.

But that was good money if you could get it, and if you had the ethics of a sewer-rat and if you didn’t mind your customers leaving their Ferraris at the airport. 

Anyway just as the new-kids-in-town declared that 2009 was going to be an “even better year than 2008”, the penny dropped. Or more precisely the demand for the sub-market of hugely over-priced property started to get satisfied by new inventory, and then there was the “pop”.

The pop was helped along by a decision to make it more difficult for people from non OEDC countries to get visas, which was a factor feeding the market. But “visas” were not the cause of the bubble; up to 2006/7 the market had been driven by “fundamentals”, which included people who live behind the barbed-wire fence that separates the rich nations from the threat of influx from poor nations.

There’s nothing wrong with that; Dubai works, first because it has modern infrastructure including reasonably good standards of the rule of law (at least compared to its neighbours, and sure the courts are not Dubai’s strong-point), it is safe, and outside of the “vision” thing, there an absence of petty corruption that is endemic in the “Third World”. Second it’s open; anyone who has money can come to Dubai and set up a business (that often does not do any business in Dubai). 

As in the line from Confucius on how to get a city to prosper, “Make the local people happy, and attract foreigners from afar”, which is something China has been very successful at doing.

Dubai was then, and still is, the best place to base a business for 2,000 miles in any direction; and now that property prices have come down from where they were when everyone was having “visions”, it’s even better.

The black dotted line that dips down to 150 was the prediction that I made in July 2009 about where the bottom would be, although you would have had to be pretty quick to catch it, and it was pretty “theoretical” because there were practically no transactions. 

The thing about Dubai is that there isn’t a proper law on foreclosure so when you take a loan, you just write a hundred post-dated cheques, and if the cheque bounces, you go to jail, or you run away before your name is posted on the computer at the airport.  Foreclosure takes a lot longer, so the market didn’t exactly “clear”, it just stopped.

But I know of some transactions that followed that path; a friend of mine wanted to buy on the Palm in early 2009, and he asked for some free advice. I said “if you want to live there” (I couldn’t imagine why anyone would want to live on the banks of an algae-filled canal), “then now is the time”. He was offered a “standard” villa for $1.75 million; I said “grab it”. 

But my friend is real-smart which he says explains why he has much more money than me. My theory by the way is that’s more to do with my deep vein of human kindness, as in giving free advice to people who can afford to pay, and if they did pay they might be more inclined to take it. Anyway he told me, “I Never Accept the First Offer”.

So he messed around looking for a better deal, and what he did was typical Dubai; instead of trusting the agent he was using, he went to see ten other agents. And every one of them found the same property, and they all told the owner they had a “cash buyer” in their pocket. So he figured that with ten “cash buyers” in the market he was going figure a way around whatever it was that was forcing him to sell at that juncture, and he put the price up, so my mate was gazumped by himself (as in “shoot yourself in the foot”). Nowadays you won’t find a unit like that for less than $2.3 million, which pretty much fits the curve.

Right now (in my opinion) the price of property in Dubai more or less reflects the fundamental of supply and demand.

Prices are down on pre-bubble (say January 2007) because there has been a lot of new inventory (and there is more to come), and also the amount of economic activity has gone down (a bit) in nominal terms since then (my opinion also).

That explains why a temporary 40% over-pricing ended up in a fairly short-lived 60% decline; that subsequently bounced (a bit).

Where Next?

No one with any brains is building new property in Dubai at the moment; unless they managed to get some really cheap land (construction costs are rock-bottom), but most good land is tied up in litigation and has a half finished building on it; all that’s happening now is that some of the half-competed units are slowly getting finished. 

One of the things about Dubai was that many developers (not the ones I advised mind), forced contractors to take risk and signed lump-sum contracts rather than taking the risk of price changes in steel,  concrete and MEP during construction themselves; now those owners are crying.

What will drive the future now, is the rate of growth of the Dubai economy.

Of course, no one really knows what the size of the Dubai economy is, since there is not really any tax and so there is no direct way of measuring it. And the valiant efforts to estimate the size of the economy (typically done by benchmarking some not particularly reliable proxies), are a year to eighteen months late.
But you can build pretty good models if you know your proxies; here are some that I use: 


That data is all “public-domain”, as in you can look it up on the net or in the Dubai Chamber of Commerce Library. Of course if you know your way around and you pay a bit extra, you can get it in “real time”, but then that’s not “Official”, and if something is not official in Dubai then it’s a rumour; although in some cases even if it’s “official”, it’s a rumour too. I hope that’s clear!

Anyway, sticking with the “public” stuff; my comments are as follows:

1: Net Airport Arrivals: That’s the numbers who came into Dubai Airport less numbers who left and it’s a pretty nifty way to get to population. Although not all of the people passing through the airport live in Dubai, and Abu Dhabi Airport is catching market share, but for the first time in many years, in 2009 more people left Dubai Airport than flew into Dubai Airport.

Notice how it’s gone down quite dramatically, like 17%; the last time that happened was in 1998 when they had a purge on the “illegal” immigrants (people who had over-stayed their visas). Those all came back the next year, but the ones who left Dubai in 2009 and 2010 probably won’t come back, unless they want to subscribe to Dubai’s unique guaranteed sure-fire weight-loss program, as in debtor’s jail.

2: Occupied housing units are from DEWA; anyone who does not have an electricity connection in Dubai is “not economically active”; so that’s a good benchmark. Interestingly those were still going up in 2009, probably reflecting migration of people with jobs in Dubai from next-door Sharjah.

3: Light passenger vehicle registrations are a reflection of how much money is being spent (new-car sales). Although there is a complication there because many cars are re-exported from Dubai which affects the ratio of new-buys, and to get to the bottom of that you have to look closely at that which is really tedious; big picture, that flat-lined in 2009; reflecting a drop in economic activity (the amount of money being spent).
4: City Deluxe Hotel Lodging Revenues used to be one of my favourite proxies (goes to business travellers who relate to the way Dubai’s economy works), but when occupancies go over 90% annually there is price elasticity; plus I suspect the property bubble migrated into that market, people who think they are rich when in reality they are not, spend big on luxuries like first-class hotels.

5: GDP is a bit of a mystery, up to 2006 that was published promptly (i.e. never more than nine months late) by the highly efficient and very professional, Dubai Municipality. Then that job was transferred to the newly formed Dubai Statistics Centre, which only recently published the outcome of it’s deliberations for 2006, 2007 and 2008, so now it’s running two years late.  

What’s interesting is that the numbers put out by Dubai Municipality (before) used to be posted on their website, but now they are not there any more; as if they have been “expunged”. That’s quite a mystery; a possible explanation is that the people putting the new numbers out were at the time, very much into the “new” vision of Dubai that you can see on the road just past Jebel Ali. Plus of course when you are having a conversation with the guys you owe $100 billion to, $90 billion GDP has a better ring to it than $60 billion.

The Future

The ultimate driver of economic activity in Dubai is the price of oil and the price of oil has gone up and is going to go on going up.


Dubai hardly has any oil; revenues are about $2 billion a year out of $91 billion GDP claimed “officially” in 2008; but it services a region that is full of oil; which is why it works.

Now that the “visionaries” have run out of foolish bankers to lend them money so they can create housing bubbles and clog up the roads with their Ferraris, the rest of Dubai can get back to what it did before, with the bonus of a great infrastructure, a pretty decent government (particularly after the re-shuffle), and very cheap property prices relative to anywhere within 2,000 miles (for the same quality).

Insofar as property is concerned, as I said, prices are on the “fundamental” now; they may go down a bit as the last of the developments get finished which will drive the fundamental down (that could take another one or two years, realistically). After that, prices will start to rise, albeit quite slowly.

After so much “vision”, it’s nice to get back to reality.

Follow Us