Showing posts with label eMini SP. Show all posts

Sunday, February 19, 2012

Stock Market SPX Uptrend Topping


The market gapped up on monday. Then after a pullback on tuesday, it made three consecutive new uptrend highs the following three days. For the week the SPX/DOW were +1.3%, and the NDX/NAZ rose 1.6%. Economic reports for the week were heavily biased to the upside. On the uptick: retail sales, business inventories, export prices, the NY/Philly FED, capacitiy utilization, the NAHB index, housing starts, the CPI/PPI, the WLEI, the monetary base, and weekly jobless claims improved. On the downtick: import prices, industrial production, building permits and the M1 multiplier. Overall it was a fairly solid week for stocks and the economy. Next week we’ll get reports on Existing/New home sales and Consumer sentiment.
LONG TERM: bull market
It does appear, at least to this observer, many have joined the bull market camp and are expecting, at best, small pullbacks along the way as the market works its way higher. Not surprisingly, this is exactly what the market has done for the past three months. We are thinking, however, this market may have other plans for the medium term. Every one to three months, since this bull market began in March 2009, this market has experienced a significant pullback, if not a correction. While we do not see the technical deterioration which usually occurs before corrections. We do see a short term wave count that suggests the uptrend is nearing a conclusion. More on this later.
We continue to label this bull market as a five Primary wave Cycle wave [1]. The last time a Cycle wave [1] occurred in the US stock market was between 1932-1937. Right after the 1929-1932 crash. Thus far, Primary wave I rose from Mar09 at SPX 667 to May11 at SPX 1371. Then Primary wave II unfolded in an elongated flat into the Oct11 low at SPX 1075. We are currently in Primary wave III. Since rising Primary waves divide into five Major waves, as illustrated by the five Major waves of Primary I, we are currently counting Major waves 1 and 2, of Primary III, completed in Oct 11 at SPX 1293 and Nov11 at SPX 1159 respectively. We are currently in Major wave 3.
The technicals on the weekly chart, as well as many other technicals, continue to confirm this scenario. The MACD is now well above neutral, which only occurs during bull markets. And, the RSI is now quite overbought, which also occurs only during bull markets. Before this bull market ends it is likely to approach, or even exceed, the Oct 2007 SPX 1576 high.
MEDIUM TERM: uptrend high SPX 1363
The current uptrend, which started in November at SPX 1159, we have been counting as Intermediate wave i of Major wave 3. Every rising Major wave, during a bull market, divides into five Intermediate waves. Thus far we can count five Minor waves up from that low as noted on the daily chart. While Minor wave 4 looks small in comparison to Minor wave 2. That pullback was the second largest of the entire uptrend. Minor waves, of course, are the subdivision of Intermediate waves.
After the Minor wave 4 low at SPX 1300, we calculated some fibonacci relationships for the waves within this uptrend, and arrived with the following: at SPX 1367 Minor 5 = 0.618 Minor 1, at SPX 1381 Minor 5 = 0.618 Minor 3, at SPX 1408 Minor 5 = Minor 1 and 0.618 Minor waves 1 – 3, and at SPX 1432 Minor 5 = Minor 3. Also, this uptrend equals the Major wave 1 uptrend at SPX 1377. Since the three lower figures fell within our 1361, 1372 and 1386 pivot range we considered this zone to be significant resistance for this uptrend. Should the market clear it, then we would be looking at SPX 1408 and then the OEW 1440 pivot. However, we are seeing a negative divergence starting to unfold on the daily charts. This usually occurs as uptrend tops unfold.
SHORT TERM
Our short term count displays the five Minor waves, with each rising Minor wave subdividing into five Minute waves. Notice Minor 1 had a short Minute i and v and an extended Minute iii. Then Minor 3 had only a short Minute i, and an extended Minute iii and v. Minor wave 5 appears to be acting like Minor 3 but on a smaller scale.
When we take a closer look at Minute wave v of Minor 5 we see two potentials. First, the market rallied from SPX 1337 to 1353 completing a Micro wave 1. Then pulled back in an irregular flat at SPX 1341 for Micro wave 2. And, now it is in Micro wave 3. Second, the SPX 1353 high was a wave A, the 1341 low a wave B, and the current rally wave C of an ongoing diagonal triangle. If this market continues to rally, then the diagonal scenario will be eliminated. However, if the market has a significant pullback into the low 1350′s, then rallies. The diagonal could end on the next new high. Early next week should gives us some indication of what is next.
FOREIGN MARKETS
The Asian markets were mostly higher gaining 1.9% on the week. All are uptrending.
The European markets were mostly higher gaining 1.2% on the week. All uptrending.
The Commodity equity group were all higher gaining 2.4%. All uptrending.
The DJ World index is uptrending and gained 1.5% for the week.
COMMODITIES
The Bond uptrend is beginning to weaken a bit as bonds lost 0.4% on the week.
Crude is uptrending again gaining 5.2% on the week.
Gold continues to consolidate in its uptrend gaining 0.1% on the week.
The USD is trying to reverse its downtrend, gaining 0.3% on the week.
NEXT WEEK
A holiday shortened week as monday is Presidents day. On wednesday Existing homes sales will be reported. Then on thursday, weekly Jobless claims and FHFA housing prices. Then on friday, Consumer sentiment and New home sales. The FED has nothing scheduled. Best to you and yours this extended weekend and week.

Friday, December 2, 2011

New Stock Markert Cycle is Bearish for the Year-End


The up sloping Head and Shoulders pattern had successfully decline to its target of 1160.00. Normally head and shoulders neckline's are not recrossed once they are violated. However, up sloping Broadening Wedge formations have a 7% probability of an incursion back into the formation. This is one of those rare incursions.

The only model suggests that the final wave five of c may go as high as 1288.67. Elliott Wave relationships suggest a top at 1279.00. What we now have is a smallish wave (i) and an oversized wave (ii).


The next opportunity for cycle turn is Monday morning. The low on November 25 is 1 1/2 daily pi cycles early, which is outside the normal range for a trading cycle low. For example, the October 4 low came one half pi cycle early.


However, the cycles were calling for a Master Cycle low between November 20 and November 29. It appears that the Master Cycle was on time. This Master Cycle is not the dominant cycle, but will have to keep an eye on it as we go and 2012.


In the meantime, I am still expecting a new low by December 8. That new low should take up the new head and shoulders neckline at 1158.67 and with it the October 4 low at 1074.77. Under the new cycle regime, it appears that we may get a bounce into options expiration week, ending December 16. However, that bounce may fail and produce a very nasty year end for equities.


Sunday, September 25, 2011

SPY Trends and Influencers 9/24/2011


Last week’s review of the macro market indicators looked to bring more consolidation for Gold ($GLD) in a broad range, but with the bias to the down side if forced to pick a break direction. Crude Oil ($USO), the US Dollar Index ($UUP) and US Treasuries ($TLT) all also look to be headed lower in the short run. The Shanghai Composite ($SSEC) looks to continue lower while Emerging Markets ($EEM) consolidate further. Volatility ($VIX) looks to remain elevated with any break bias to the downside as Equity Index ETF’s $SPY, $IWM and $QQQ are set up to extend their gains. The QQQ is by far the strongest of these index ETF’s and should be watched for broad direction. The correlations to watch for driving the Equity markets this week are the inverse relationship to the US Dollar and US Treasuries. Should these areas reverse and move strongly higher Equities will likely fall. Gold should play less of a role as it is moving in a broad range.

The week began with Gold moving sideways before a massive collapse and Crude Oil falling lower. The US Dollar Index and US Treasuries also drifted before launching higher and as warned knocking the Equity Indexes lower. The Shanghai Composite continued to consolidate while Emerging Markets were sucked into the downdraft again. What does this mean for the coming week? Lets look at some charts.
As always you can see details of individual charts and more on my StockTwits feed and on chartly.)

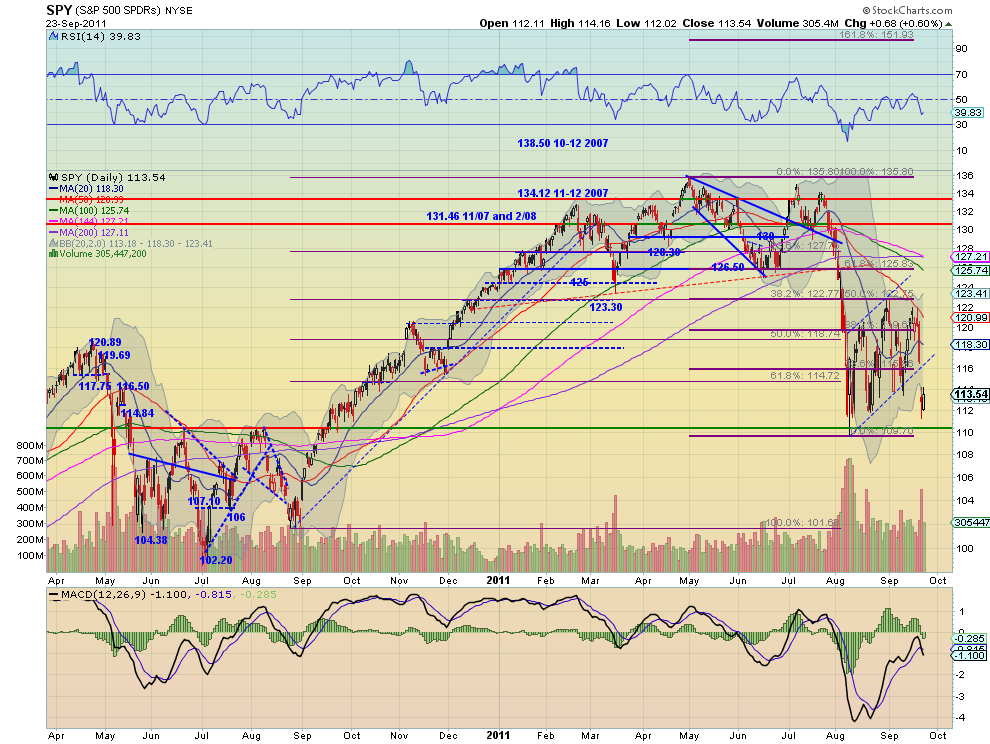
SPY Daily, $SPY

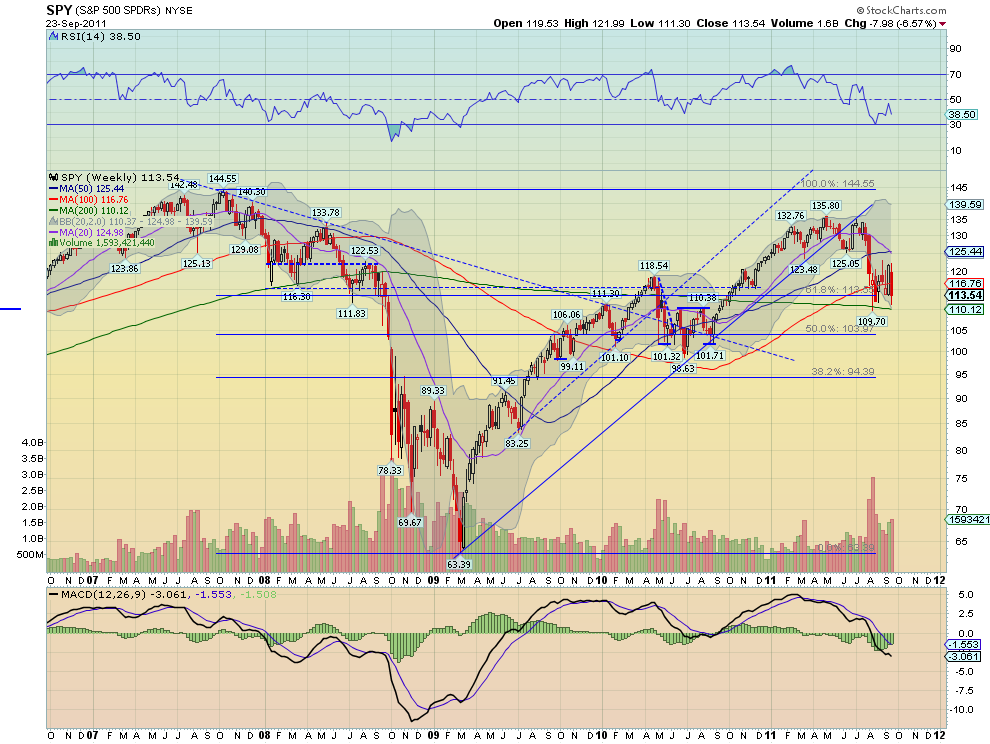
SPY Weekly, $SPY

The SPY gapped lower out of its bear flag Thursday and then held that range Friday, at the closing low support since early August. The RSI is pointing lower and the MACD crossed negative on the daily time frame. All of the SMA’s are sloping lower on both time frames except for the 100 week SMA. The weekly chart also shows a bearish RSI but the MACD is diverging, starting to improve. It is not as certain of the flag break on the weekly chart. The bias is to the downside for next week with support below 112 at 110.26 and then 108 and 104. Any bounce above the gap level of 114 should see resistance within the bear flag and first near 116.

Rolling into the last week of the third Quarter, Gold and Oil are ready for more downside. The US Dollar Index and US Treasuries look to continue higher. The Shanghai Composite and Emerging Markets also look to continue their down moves. Volatility looks to remain elevated and possibly break higher. The equity Index ETF’s, SPY, IWM, and QQQ are all looking better to the downside. The QQQ again may be the key to holding the market together. If it loses support of the flag, the SPY and IWM could take the whole market lower. A spike in Volatility and continued moves higher in Treasuries and the Dollar Index should ensure it. Use this information as you prepare for the coming week and trade’m well.

See the original article >>

Choppy Stock Market May Bottom Soon


After some big gains last week and a SPX 1216 close, the market gave it all back this week with a SPX 1136 close. Economic reports were light, but still mostly to the downside. On the positive were building permits, existing home sales, the monetary base and a downtick in weekly jobless claims. On the negative were declining housing starts, FHFA/NAHB housing prices, leading indicators, excess reserves and the WLEI. The big news for the week was the ‘sterilized’ Operation Twist. A $400 bln program to purchase long term debt with short term debt. The market apparently wanted more liquidity in the form of outright purchases. For the week the SPX/DOW were -6.45%, and the NDX/NAZ were -4.85%. Asian markets lost 5.0%, Europeans markets lost 5.2%, the Commodity equity group lost 10.3%, and the DJ World index dropped 7.7%. Next week will be highlighted by Q2 GDP, the Chicago PMI and Case-Shiller.

LONG TERM: bear market highly probable

When the markets start displaying a bunch of mixed signals it is best to step back and look at the overall picture. Between March 2009 and May 2011 the stock market doubled in a five wave advance, (SPX 667-1371). After the peak the stock market experienced a modest decline to SPX 1258 and then a fairly good rally to SPX 1356. While this was unfolding many foreign markets were starting to break down. After a review of the long term technical indicators we concluded these two waves represented the beginning of a new bear market. After posting these findings the US stock market started breaking down. The decline was quite swift, and within a month the SPX dropped from 1356 to 1102, or 18.7%.


The weekly chart signalled there was potential trouble ahead when the first decline, SPX 1371-1258, was quite oversold, (RSI red arrow). This typically does not occur during bull markets, as you can observe on the chart. When the market started breaking down the MACD turned negative. This also does not occur during bull markets. While OEW quantitative analysis has yet to confirm a bear market it certainly looks like we are in one. This is the reason we have been posting, since early August; “bear market highly probable”.

All bear markets unfold in three significant waves, ABC, not five. They are corrections to previous bull markets of a greater wave degree. The declining A and C waves may take the form of a five wave structure, as demonstrated by the 2007-2009 bear market. Or, more typically, a three wave decline, as demonstrated by the 2000-2002 bear market. Until the first signficant wave completes, wave A, either combination is possible. To cover these two possibilities we have been tracking an ABC decline on the SPX charts, and a 1-2-3 decline on the DOW charts.

Also of note on the weekly chart is the two green, wave structure, support lines. The first is at SPX 1011, the Primary wave II low. This level also represents a Fibonacci 50% retracement of the entire bull market. The 38.2% retracement level was hit exactly at the August low of SPX 1102. The second green line is posted at SPX 869, Major wave 2 of Primary I. This would be the logical wave structure support, should the first one fail. It represents a 70.7% retracement of the bull market. For the record there is one intervening level of support, the Fibonacci 61.8% retracement: SPX 936.

The overall picture suggests we are in a bear market with the first level of support at SPX 1011, the next level at SPX 936, and the likely maximum level at SPX 869. The market closed at SPX 1136 on friday.

MEDIUM TERM: July downtrend likely still underway

From the SPX 1356 uptrend July high this market declined in three waves: SPX 1296, 1347 and then 1102 on August 9th. After that the market went into a trading range between SPX 1121 and 1231 for five weeks. This week it took out the 1121 low on thursday when it hit 1114. Our first thought was the low of the range, SPX 1121 on August 22nd, ended the downtrend with a failed fith wave, (higher than the third). We then tracked the market as if it were a counter-rally uptrend. This approach worked quite well for the past four weeks, until the market started breaking down after the FOMC meeting.


Our counter-rally uptrend scenario suggested the market would hit the OEW 1240 pivot, and higher, from the September 12th SPX 1136 low. On tuesday, however, the market made a double top at SPX 1220 and started to decline. When it dropped through the OEW 1187 pivot, the previous short term support, on wednesday afternoon we knew something was amiss. Anticipate, monitor, and adjust. On thursday the SPX found short term support at 1114 and then rallied, from extremely oversold levels, to 1142 on friday. On thursday, however, the DOW made a new print low for the July downtrend suggesting it had resumed after several weeks of sideways activity. We then posted a special thursday night update: http://caldaro.wordpress.com/2011/09/22/thursday-night-update/.

When we take into account these recent events. The new print lows in the DOW, TRAN, and NYSE. The fact that OEW has yet to confirm an uptrend. And, the somewhat sloppy wave counts on the SPX charts. We have shifted the short term count posted on the DOW charts to the SPX charts. This is now the preferred short term count. The alternate count is now posted on the DOW charts. We should know for certain, in a week or so, which of these two counts is the market’s count.

The updated SPX chart is as follows. From the July SPX 1356 high the market has declined in four waves: Int. i SPX 1296, Int. ii SPX 1347, Int. iii SPX 1102 and Int. iv SPX 1231/1220. Int. i and iii were five wave declines, Int. ii was a zimple zigzag, and Int. iv was a complex inverted failed flat ending at 1220. We had observed these inverted failed flats during the previous bear market.

SHORT TERM

Support for the SPX is at 1136 and then 1107, with resistance at 1146 and then 1168. Short term momentum ended the week around neutral. Anticipate, monitor and adjust. When we take into account the preferred short term count the anticipated medium to long term wave structure changes just a bit. The long term supports, noted in the long term section, remain the same. The wave structure for this bear market, however, can now be either a 5-3-5 ABC, or an abA-B-abC ABC. Both options are again possible.


We did a Fibonacci analysis on the relationships between the Intermediate waves and arrived with the following numbers: @ SPX 1093 Int. waves iii thru v = 2.618 Int. i, @ SPX 1080 Int. v = 0.618 Int. iii, @ SPX 1074 Int. v = 2.618 Int. i, and finally @ SPX 1060 this third wave (trend) down = 2.618 the first wave (trend) down. Since we have OEW pivots at 1090 and then 1058, we’re probably looking at either the SPX 1093 relationship, or the 1060 relationship, for the end of this Int. wave v and downtrend. Best to your trading!

FOREIGN MARKETS

The Asian markets were all lower on the week for a net loss of 5.0%. China and Hong Kong made new downtrend lows.

The European markets were also all lower on the week losing 5.2%. The Stox made a new downtrend low.

The Commodity equity group all dropped substantially for a net loss of 10.3%. Canada and Russia made new downtrend lows.

The DJ World index made a new downtrend low as well and lost 7.7%.

COMMODITIES

Bonds continued their extended uptrend gaining 1.2% on the week. The 10YR dropped to 1.70% before ending the week at 1.81%. The 30YR hit 2.75%.

Crude tumbled 9.0% as its choppy attempt at an uptrend ended with a continuation of the ongoing downtrend.

Gold also tumbled, losing 8.4%. We had expected both Gold and Silver to be in downtrends and this week’s action confirmed it. In fact, Gold has already come down to our anticipated support zone $1650-$1700, and even dipped below it on friday. As soon as this downtrend ends the bull market will resume.

The USD continued to uptrend, especially against the Euro, and gained 2.5% on the week. The EURUSD lost 2.2%, and the JPYUSD gained 0.1%.

NEXT WEEK

New home sales kick off the economic week on monday at 10:00. On tuesday we have the Case-Shiller index and Consumer confidence. On wednesday Durable goods orders, and then on thursday Q2 GDP, the weekly Jobless claims and Pending home sales. Friday closes out the week with Personal income/spending, PCE prices, the Chicago PMI, and Consumer sentiment. The FED has two speeches scheduled. FED governor Raskin on monday before the open at 9:15 AM. Then FED chairman Bernanke on wednesday after the close at 5:00 PM. With this week representing the end of the month, and the quarter, it should be quite interesting. Remember we’re probably in a bear market, so tread lightly.

Saturday, September 24, 2011

Bull market leaders on the edge of support ...

by Kimble Charting Solutions


Value Trading


It appears that in academic hindsight the markets have ruled out Door # 3 and moved onto the remaining outcomes; either continuing down the slope of hope or meeting the requirements of a successful retest of the early August lows.

Considering we are sitting at the bottom of the range, my confidence, with regards to pulling up to the trough and buying stocks more aggressively here - has risen commensurate with the declines. As I have maintained since the early August lows, I still hold the overarching opinion that equities will continue to be forgiving with tactical purchases on the long side of the ledger. This posture towards equities has been maintained, because I believe that although the range has been wide, it will drift higher over time. I believe to some degree you can use the 1987 crash analog as a general impression on what to expect in the coming months.

I will continue to average into a position if and when I have been early; almost in the style a value investor approaches an asset class - just with tighter timeframes and through the window of technical analysis and not fundamental analysis. The analogy works for my style, because like a value investor, I do a rigorous study of a given market, feel a level of confidence towards the respective outcome - then start building a position around that expectation. This method is unconventional with trading shorter time frames in the sense that if my market expectations were off the mark - it would compound the positions losses, very much like a value trap. Fortunately, I continue to be close enough with my respective timing and the market maintains its considerable inertias - that I have been on the right side of the trade when I exit. Trading is typically not this complex, either from a research and timing perspective or the amount of trend reversals you need to stomach to profit from a trade. But for a seasoned and professional trader - there is no trading environment better for outsized gains if you continue to ride the volatility, are well capitalized and have done your research. With that said, this market is extremely dangerous for those a step or two behind, or unwilling to commit capital through volatility. It is no market for the inexperienced or weak handed trader.

My returns this year have been atypical in the sense that I do not expect to maintain the degree of profitability that I have enjoyed year to date. With that said, I try not to set specific goals with regards to my ROR, because I firmly believe it causes you to chase those expectations.

In athletics it is often said, "go for an inch and you will get the yard." It applies very nicely to trading as well.

My bottom line has always been a direct result of my own research and how I perceive the markets to function in the near to intermediate time frames. In trading environments such as these when you need to be proactively positioning and confident to withstand the volatility, it is the difference between getting bled by a thousand cuts - or holding firmly to a realized return. As always, it is much easier said than done and only comes with experience through loosing capital in different market environments and finding your own respective edge and rhythms. As a general rule, and because of the nature of this strategy, I do not use external margin on my account. I like leverage intrinsically built into the positions - so the leverage ETF products work very well for me. I described a bit of that dynamic in a note in April - Waiting on a Train.
"In the right desensitized hands they are outstanding tools for capturing a trading thesis over the near to intermediate terms. Many traders bleed themselves to death and second guess their research by entering and exiting a trade several times before the market turns. It can be death by a thousand cuts and quite confusing to navigate.

In a trading and media environment that is so heavily dominated by the approach of high frequency trading, "cut your losses quickly" can at times preclude you from missing the train entirely. It is often prudent advice to follow in the typical continuation or trading range environment.

However, when it comes to extreme market action, there is an exception to the rule."
Most traders should never use these trading vehicles for a variety of reasons. Stick with the plain vanilla ETFs. But over the years since they were first introduced, I have learned to appreciate their utility - even in markets environments such as today. Position sizing and averaging in and out is a must when trading these very volatile instruments.

The Week Ahead: Is the Majority Wrong?


Bearish sentiment and economic troubles continue to take their toll on the markets, but certain sectors look good and a buying opportunity may be right around the corner, writes MoneyShow.com senior editor Tom Aspray.

Even though global stock markets were able to stabilize on Friday, the sharp declines last week added to the overwhelming negative sentiment in the markets.

The technical formations prior to last week suggested that stocks were vulnerable to decline, and the short-term outlook turned more negative Tuesday.

Of course, the magnitude of the decline was a surprise to all, and Thursday’s sell-off was similar to the panic selling that occurred in early August. This gave the investment firms and major banks some vindication, as they have been racing each other for weeks to cut their forecasts for the economy and lower their year-end targets for the S&P 500.

Even the Federal Reserve joined in, as their new plan to lower long-term rates was accompanied by the comment that there are “significant downside risks to the economic outlook, including strains in global financial markets,” something that undoubtedly spooked an already skittish market.

Though I think the Fed’s concern is valid, the general consensus of economists makes me more skeptical. Many believe that if we are not already in another recession, we will be soon. If this turns out to be the case, it would be the first recession that was predicted by most as it was occurring.

These predictions comprise the majority of market sentiment, even though last week’s housing data was better than expected; existing home sales jumped 7.7% in August. Nevertheless, a survey of 100 economists painted a bleak picture of housing, as they expected prices to drop 2.5% this year, and then only rise 1.1% through 2015.

In my experience in the market, the majority is rarely right. When you have a consensus view—especially one that persists for some time—I always look at the technical evidence to see whether it supports this consensus.

For example, my volume analysis on gold turned positive in 2006, but sentiment toward gold was often mixed. In the fall of 2009, however, public sentiment on gold was overwhelmingly positive, right before gold topped out on December 1.

This began a months-long decline. The correction was severe enough to turn enough of the bulls negative on gold, which created another good buying opportunity.

Therefore, while the short-term outlook for the global equity markets is decidedly negative (as I detail later), I think by year’s end the stock market may surprise many of the current bears.
chart
Click to Enlarge

Of course, the problems with the US economy and our leadership are just magnified overseas. Many are suggesting that the Eurozone will eventually break up, as their leaders fail to comprehend the severity of their debt problems.

The focus remains primarily on Greece, but the contagion fear is still hurting the markets. The economic news last week was also grim, as the Eurozone purchasing managers’ index dropped in September for the first time in two years. Rating agencies downgraded many Italian and Greek banks, which did not help. (I would love to see someone start rating the rating agencies.)

Late last week, the G-20 announced that it would take “all necessary action” to shore up the banks and financial markets. I think they will eventually figure out the necessary actions and move accordingly.

Unlike the US stock market, the German Dax Composite has continued to decline after the sharp drop in late July. The Dax was sharply lower early last Friday, but closed higher, and could have formed a very-short-term bottom.

Things weren’t that much better in Asia, as selling was heavy. News that China’s factory activity declined in September reversed some of the positive sentiment that had been building for their economy.

The Hong Kong Hang Seng Index had a rough week, down 7.9%, and as the chart shows, the long term 50% Fibonacci support was broken. The 61.8% support stands at 16,544, which is 7.5% below Friday’s close.

The market is likely to get a good test from the economic data this week. On Tuesday, we get new-home sales figures, the S&P Case-Shiller Housing Price Index, and the latest readings on consumer confidence.

Wednesday will bring the latest numbers on durable-goods orders, followed Thursday by the final reading on second-quarter GDP, jobless claims, and pending home sales.

On Friday, we get the numbers on personal income and consumer sentiment, which is likely to be watched closely by Wall Street.

WHAT TO WATCH

The sharp drop last week pushed many of the market indicators to levels where a sharp rebound is likely. The odds would have been even greater if stocks had been sharply lower again on Friday.

Some charts show potential double bottom formations, and while the volume action does support this view, the evidence is not strong enough to act. Given the overhanging political and economic problems, a new trading range is more likely.

I still think the current decline will be an opportunity to establish long stock positions in some of the sectors that I like, but we need to see a decrease in downside momentum first. Technology and cash-rich, high-dividend stocks are my favorites, followed by the retail sector, as I do not think Christmas shoppers will stay away.
chart
Click to Enlarge

S&P 500

The Spyder Trust (SPY) is holding above the August lows as it is testing the daily Starc- bands. Last Thursday’s gap lower opening took out the prior lows at $114.05.
 
If the August lows are broken, then the 127.2% Fibonacci target from the flag formation is at $106.50, while the width of the flag gives downside targets in the $104 to $105 area.

First resistance stands at the gap in the $114.21 to $116.27 area, with stronger levels at $118.50. The daily trend line resistance is at $121.50.
.
The S&P 500 A/D line is so far holding above both the recent lows and those that were made in August (line d). This is an encouraging sign, but a move through the downtrend (line 3) is needed to confirm a bottom.

Dow Industrials

The Spyder Diamonds Trust (DIA) came very close to the 38.2% support of $105.46 last week, as DIA gapped though the lower boundary of the flag formation (line f) on Thursday.

There is resistance now at $107.95 to $110.69, with a key level to follow at $114 to $115.25.

The Dow Industrials A/D is diverging from prices (line h), but needs a move through the resistance (line g) to confirm the divergence. A convincing break of this support will indicate a further decline.
chart
Click to Enlarge

Nasdaq-100

The PowerShares QQQ Trust (QQQ) also gapped lower Thursday, then closed back above the uptrend (line b) on Friday, which is positive.

It would take a close below the September 6 lows at $51.91 to signal a test of the August lows.

The Nasdaq-100 A/D line overcame its downtrend (line c) last week, which suggests the A/D line could be bottoming. The A/D line shows a slight uptrend (line d) which could be broken on a further decline. A move in the A/D line above last week’s high would be positive.

There is resistance now at the gap in the $54.46 to $55.37 area.

In a recent article, I took a close look at not only the PowerShares QQQ Trust (QQQ), but also the Select Sector SPDR Technology (XLK), Semiconductor HOLDRs Trust (SMH), and Apple (AAPL).

Sector Focus

All of the major sectors were hit hard last week, and three—energy, materials, and industrials—look the weakest.

The Select Sector SPDR Utilities (XLU) is holding first support in the $32.70 to $33 area, and a drop back to the $32 to $32.40 area should be a buying opportunity.

The Select Sector SPDR Consumer Staples (XLP) and Select Sector SPDR Health Care (XLH) are also holding well above their highs, but the short-term momentum is still negative.

Oil

November crude plummeted as expected last week. The support at $85 and the $83.20 level both gave way, with crude hitting a low of $77.55 on Friday.

This could be a final washout, but it will take some time for the market to recover from a $13-plus drop.

There is initial resistance at $82, with stronger levels in the $84 to $85 area

Panic Sellers Are Often Sorry


Widespread recent selling in equities and gold looks to be a panic reaction by the masses, as opposed to a calculated response to real market data.

The over 5% decline in the Dow Industrials in the past two days has turned investors’ focus back on the downside, which is different from the positive spin that prevailed just a week ago.

From a technical standpoint, I have been making the case that the rebound from the August lows was a typical flag formation. The Nasdaq Composite has been the strongest since the August lows, but the negative signals from the McClellan Oscillator as of Tuesday’s close indicated even the Nasdaq had likely topped out.

Those who sold at the August 9 lows have had almost two months to watch the market stage a typical 50% rebound. If anyone sold yesterday because stops were hit or as a result of a previously developed plan, that is fine, but Thursday’s drop suggested many were just hitting the sell button in a panic reaction.

The bearish sentiment of individual investors jumped sharply this week, as 48% are now bearish with just 25% bullish. These numbers are as of Wednesday, so they should become more bearish by next week.

Gold was also hit hard Thursday and could be vulnerable to more panic selling before the current correction is over. By looking at the charts, we can get a better idea of what may occur so that you can develop a plan based on data, not emotion.

Chart Analysis: The daily chart of the Spyder Trust (SPY) shows that it gapped below support on Thursday, line b, completing the flag formation. SPY is now just above the August lows at $110.27, which are likely to be tested over the next week.
  • The 127.2% Fibonacci target from the flag formation is at $106.50, while the width of the flag gives downside targets in the $104-$105 area
  • The NYSE Advance/Decline (A/D) line broke support, line d, with Wednesday’s close, setting the stage for Thursday’s plunge. The last rally had taken it just barely above its weighted moving average (WMA)
  • The A/D line needs to move above its downtrend (line c) to turn positive
  • The A/D line shows a band of major support between the March 2011 lows and the November 2010 highs
  • Volume had been declining as the flag developed, but broke its downtrend on Thursday’s drop. It is still well below the levels seen in August, so the volume should be watched closely

The Nasdaq Composite was much stronger than the S&P on the rally, but the PowerShares QQQ Trust (QQQ), which tracks the tech-heavy Nasdaq 100 Index, was even stronger, as it surpassed the 61.8% retracement resistance.
  • Thursday’s drop gapped through support at line b, completing the flag formation
  • The close was at the daily Starc- band with next support at 2330-2385. The 127.2% target from the flag formation (lines a and b) is in the 2250 area
  • As noted Wednesday, the negative divergence in the McClellan Oscillator, line c, indicated the rally was over. It is back to -150 and could fall to the -250 or -300 level before the decline is over
  • A rebound over the next week or so is likely to fail near the zero line
  • Resistance now stands at the gap in the 2500-2550 area
The SPDR Gold Trust (GLD) dropped 2.6% Thursday on volume of 32 million shares and is down another 2% in early-Friday trading. This will take GLD close to the weekly Starc- band at $163. Over the past month, the closeness to the weekly and monthly Starc+ bands had indicated that risk on the long side was high.
  • The break below support at $174.45 last week and the break of the daily uptrend (not shown) this week set the stage for the sharp drop
  • The minor 38.2% support is in the $163.40 area with the more important 50% support at $156.70. This is very close to the weekly uptrend, line e
  • The major 38.2% support from the 2008 lows and the long-term uptrend (line f) are in the $140 area
  • As noted previously, the weekly on-balance volume (OBV) did form a negative divergence at the recent highs (see circle) and is now testing its weighted moving average. A similar divergence in late 2010 led to an eight-week correction
  • The daily OBV (not shown) formed a divergence at the highs and is well below its weighted moving average
  • There is resistance now at $172.20-$177.40
What It Means: If you look at SPY, a test of the August lows would be a 2% drop from Thursday’s close, while a drop to the 127.2% target at $106.50 would be another 5.6% decline. Of course, I expect that the tech sector will hold above its lows.

If you are still holding weak stocks, decide over the weekend how much more pain you can take and then stick to that plan.

Stops under the August lows for stocks or ETFs are risky, as marginal lows could stop you out before prices reverse. I do expect that prices will be 8%-10% higher in the next two weeks. Further weakness should be an opportunity to buy those cash-heavy, high-dividend stocks that others are dumping.

As for gold, a few weeks ago, it looked like gold could fall instead of rally if stocks dropped, and I recommended hedging long gold positions at that time.

The SPDR Gold Trust (GLD) is likely to reach the first downside target in the $163-$165 area over the next week. A drop to the $153-$155 area is possible before the correction is over, but the long-term volume analysis is still positive, so core holdings should be held.

How to Profit: For those who hedged their long gold positions, I would suggest covering half if GLD drops below $165, as there may be an opportunity to put the hedge back on at higher levels.

On Wednesday, I recommended that traders buy the ProShares Short S&P 500 ETF (SH) at $43.36 or better. Unfortunately, the low was at $43.41, just missing the buy level. The fund closed Thursday at $46.28…ouch! Cancel that order at this time.

Stock Market SPXU Has Broken Out


Pro Shares Ultra Pro S&P 500 (UPRO) is a triple leveraged fund that seeks a 300% return on the performance of the S&P for a single day. Conversely, The Pro Shares Ultra Pro Short S&P 500 (SPXU) seeks a triple leverage or 300% return on the inverse performance of the S&P 500. 

Several days ago I called for a break under 1140 on the S&P as a buy on SPXU. While my thesis on this trade remains intact I must admit that China stepping up to buy Italy’s bonds changed the timing of this trade. The euro, which had been sold off at the end of last week, has finally found some stabilization as we moved through last weeks New York trading session.

Indeed for the last week the S&P has shown tremendous resiliency and it looked like my prediction of a test of lows of 1050/ 1030 were just plain wrong. Well yesterday after the FOMC announced “Operation Twist” The market went into a free fall and I knew that this was the moment I had been forecasting and waiting for.

“Operation Twist” consisted of selling $400 billion in short-term Treasuries in exchange for the same amount of longer-term bonds, starting in October and ending in June 2012.

While the move does not mean the Fed will pump additional money into the economy, it is designed to lower yields on long-term bonds, while keeping short-term rates little changed.

The intent is to thereby push down interest rates on everything from mortgages to business loans, giving consumers and companies an additional incentive to borrow and spend money.

Well when all of this money was injected into the treasuries it had the effect of stimulating the dollar. As the dollar grows stronger the equity markets as well as gold and silver sell off and that is exactly what happened yesterday.

I opened a half position at $19.09 and by the premarket I knew it was going to be a good day.

Take a look at the chart below.


As we can see by this chart, the S&P broke the trend line and had an intraday low of 1114. SPXU ran up on this. Once the S&P puts in a low of between 1050 and 1030, I will sell them and switch to UPRO because UPRO is a triple leveraged fund that seeks a 300% return on the performance of the S&P for a single day. That means for every point the S&P goes up UPRO goes up $3.00. I expect that once the S&P bottoms at 1050 it will quickly run up and when it does I will switch from SPXU to UPRO. A further study of the chart will show that both the MACD line and the slow stochastics have turned over and are heading down. This is a very bearish chart, which is all the better for SPXU.

In conclusion, I expect the S&P to bottom at 1030 within 3 weeks. When this happens I will switch to UPRO as I ride the S&P up to the 1200level. This is going to be a very exciting month.

By George Maniere

Friday, September 23, 2011

Risk Off as markets collapse on European Fear


As Europe collapses, without Panic (this is disturbing), under the HFT Regime no volume melt down, other asset classes are joining the Implosion. Markets are moving on light volume, driven by fear, as now every pundit sees Europe on the verge of a collapse. Maybe it is time to start buying small? Note, Stoxx 50 was up 70% from bottom to top, and has now retraced some 36% from the highs, set onkly a few months ago. Majority of investors are now down big time, as the group didn’t buy the bottom…


Follow Us