Tuesday, July 16, 2013

Hinde Capital On China, Gold, AndThe Continuing Unravelling Of Our Monetary Order

by Tyler Durden
The global crisis is a financial crisis driven primarily by global trade and capital imbalances; and Hinde Capital believes the crisis is in full swing again and asset prices are in danger of falling globally. Money is less effective at catching the falling knife. Investors and policymakers do not believe this is the beginning of a major EM contagion crisis. They are lulling themselves into a false sense of security. They see the EM market tremors, and do not fear a re-run of the EM crises of old. They are right. This is not (just) going to be an EM crisis. The disproportionate reaction of central bankers and policymakers alike has merely succeeded in compounding and exacerbating the error of this highly imbalanced monetary system. Recent events in emerging countries are a manifestation of the continuing unravelling of our monetary order.
Via Hinde Capital,

Over the past four decades the global economy has largely experienced prolonged imbalances, with countries running large current account deficits in symbiotic relationships with those running large surpluses. In our recent HindeSight Investor Letter – Top of the BoPs (below) - we revisit our long held belief that the current monetary order as defined by a constellation of exchange rate arrangements between the major global currencies, and which maintained these imbalances artificially, has led to excessive global liquidity and credit creation. This in turn drove a litany of asset price bubbles.
The bursting of these asset bubbles has continued in a series these past two decades, each one’s demise leading to more disruptive policy responses which have only succeeded in igniting yet more bubbles, only for those too to fail.

Finally in 2008 we witnessed the finale of decades of credit creation, rising in what appeared to be a crescendo of credit excess and widespread asset booms. We saw this event as the death throes of an unstable monetary regime, only then to see an unprecedented global reaction by policymakers in a coordinated fashion to keep the global system alive. For a moment here today, there are those who dare to believe they have succeeded, with rising equity markets a testimony to a reviving global economy. Nothing could be further from reality.
We stand by our assessment that the disproportionate reaction of central bankers and policymakers alike has merely succeeded in compounding and exacerbating the error of this highly imbalanced monetary system. Recent events in emerging countries are a manifestation of the continuing unravelling of our monetary order.
...
In the 1980s it was a hike by the US Fed that triggered the LatAm crisis. Today, the mere whisper of tighter monetary conditions in the US, vis-a-vis a tapering of QE has led to higher bond rates globally. Note tapering is not the same as hiking interest rates.
The consequences of multiple rounds of QE have heightened global risks as it has both exacerbated ‘currency competition’ and hot capital flows into countries seeking desperately for a return both from income and capital growth. This has created major distortions in term rates, equity and bond values, driving them artificially high in price.
These distortions have created risks far greater than the fragilities of EM countries of yesterday years. The system of credit creation has produced unstable growth underpinned with collateral which is both mobile and suspect in its integrity.

Investors have nowhere to turn, emerging market countries growth is faltering in response to export disadvantages brought about by rampant G10 currency devaluations. China is finally succumbing to its side of the global imbalance excesses. First it was the deficit nations now it’s the turn of the creditor nations to falter, primarily China.

Trade flow reversals are leading to massive capital outflows out of EMs and the question remains: will the central banks of these countries sell their FX reserves, UST- bonds and euro government bonds (bunds) to finance this surge in outflows?
It is not clear that renewed global central bank liquidity provision will even stabilise a situation we see as growing dire by the day. China is the driver. All eyes on China.

...
We believe the bursting of the ‘Great Bond Bubble’ will lead to a formative and substantial rise in gold as official money, institutional and investor money seeks an asset that can protect us all from a global default and resetting of the monetary order. The time to buy gold is fast approaching, if that time is not already upon us.

See the original article >>

Hedging China's "Super-Bear" Hard Landing

by Tyler Durden

The prospect of financial sector deleveraging in China increases the risk of a hard landing - despite yesterday's goldilocks GDP print (and ugly miss in IP). Although the probability of the hard landing is still low, Morgan Stanley warns it’s not low enough to make hedging costs irrelevant: The new government's policy drive to deleverage the banking sector has become more apparent, and they think this deleveraging will likely continue to unfold in the next 6-12 months. In MS' Super-Bear scenario, they expect aggressive policy tightening to reduce 2H13 GDP growth to 5.5% YoY. In this scenario, policy-makers are also slow to respond to this deceleration, leading to more turmoil in the financial sector. Although a low probability event, this would have major implications for global markets. MS estimates that markets are pricing in a 1-in-10 chance of a Super-Bear scenario in China in the coming 12 months, more in equities, less in FX markets.

Via Morgan Stanley,

The new government's policy drive to deleverage the banking sector has become more apparent. In the three months preceding the spike in money market rates the CBRC/SAFE have announced measures to regulate interbank entrust payments, wealth- management products, leverage in bond investments, FX lending and interbank loan structures all with the aim of curtailing the widespread use of new financial channels to grow bank assets rapidly. We think this deleveraging will likely continue to unfold in the next 6-12 months.

The Cheapest China Hedges

  • FX and credit hedges tend to be more cost-effective than equity hedges, although most hedges are still marginally more expensive than at the start of the year, due to the post-May sell-off as well as higher vol levels. Most markets are now down YTD, although with considerable dispersion.
  • CNY (FX) puts have the highest reward/risk ratio, although we have some reservations about the actual effectiveness of the puts due to potential FX intervention and restrictions on capital flows. China sovereign CDS also looks attractive, although the possibility of an actual credit event looks extremely remote.
  • The most attractive equity hedge are puts on the TWSE.

What's Priced In?

and How Bad could it get?

Source: Morgan Stanley

See the original article >>

Stocks Maintain Zero Volume Hover Mode Ahead Of Bernanke Speech

by Tyler Durden

Curious what has sent the EURUSD higher by over 60 pips in the past several hours: it was driven by the biggest economic datapoint so far in the session, the German ZEW Survey of Economic Sentiment, which missed expectations of an increase to 40 wildly, instead dropping to 36.3. While the kneejerk algo reaction was to push the EURUSD lower by 20 pips, it was the BIS FX traders that offset the drop and took what is the latest indicator of European core economic weakness as a signal to buy EURUSD to the highest in 4 days, and dragging European risk higher following Merkel comments she (Germany) was doing everything to stabilize the Euro.

But fear not US: with a Q2 GDP of under 1% now all but assured, and with all economic data reporting now a global bizarro day farce, you will have a chance to take the torch from Europe in the ugliest girl category, and push the S&P to a new record intraday high today following what should be assured epic misses in the Industrial Production print (exp. +0.3%), Cap Utilization and the NAHB housing market index which is set to tumble now that any retail demand for housing was promptly killed following the recent spike in rates.

In addition to a relatively lite economic docket, we get the all systematically important
hedge fund, Goldman Sachs, reporting which is expected to announce a 21%
q/q drop in revenues, led by lower gains in Investment Lending (i.e.
prop), offset by 12% drop in operating expenses.

Of course, nothing fundamental actually matters as markets continue to be on ultra low-volume, "drift higher" autopilot until tomorrow's Ben Bernanke semi-annual muppet show  in Congress, when he is expected to refill the hopium trough once more and finally send the S&P above 1700 on central planning.

Market recap via RanSqauwk:

Positive production update by Rio Tinto which in turn boosted miners in Europe ensured that the heavy commodity weighed FTSE-100 index outperformed its peers. As such, the likes of Rio Tinto, Anglo American and ThyssenKrupp over in Europe traded with solid gains, however despite the global dominance, Glencore is seen little changed after the company said that it is to suspend iron ore mining in Australia citing poor outlook. Although stocks are trading off their worst levels, yet another release of less than impressive macroeconomic data from the Eurozone (ZEW survey) meant that stocks remained in the red. In terms of notable stock movers today, Commerzbank traded sharply higher after it was reported that Santander is said to be interested in acquiring a stake, while Telecom Italia  shares were under pressure after it put its spin-off for its fixed-line network on hold following a dispute over tariffs with local regulator. Going forward, market participants will await the release of the latest CPI report, as well as earnings from Goldman Sachs, Coca-Cola and J&J.

SocGen summarizes the key macro highlights of the day

Financial markets traded in a confident mood yesterday with both stocks and bonds both still making the most of Fed chairman Bernanke's dovish remarks last week and taking weaker China GDP in their stride. The move lower in EU periphery yields and Portugal in particular was partially a correction of the spike in yields on Friday, but there is enough uncertainty on the radar to keep yields realigning towards post ECB meeting levels. The deadline for the Portuguese government to accept a “national salvation pact” has been set for 21 July while 30 July is the date of Silvio Berlusconi's fraud trial in Italy. Berlusconi's PdL party has threatened to pull out of the coalition in protest. Meanwhile in Spain, embattled PM Rajoy is reportedly fighting for his political life after being accused of accepting ‘slush funds'. Though Rajoy's position is fragile and he continues to reject calls for his resignation, the opposition Socialist party is not calling for early elections. This may explain why Spanish 2y debt has recently performed better out of the three countries, even as the IMF warned yesterday that risks to the to the economy from the financial sector remain high. The sale of Spanish T-bills today, but more so that of longer dated bonds on Thursday will be a test of confidence in the government.

A wealth of CPI data from the eurozone, the UK and the US are due today and apart from the UK, the stats should not have a major impact on markets or monetary policy perceptions. A rise to 3.0% is the consensus for UK CPI (SG forecast 2.9%) but only an increase above this threshold would force governor Carney to write a letter to Chancellor Osborne (but its immediate publication would now be delayed and instead fall alongside the August MPC minutes). The erosion of real UK yields has been an obvious drag on the performance of GBP lately and only when inflation pressures start subsiding can GBP be expected to stage a recovery. The performance vs the EUR has been puzzling but with EUR short positions having caught up with GBP over the past week, we think profit taking could happen soon. However, the risks for GBP/USD like EUR/USD are still skewed bearishly and tomorrow if Bernanke gives the view representative of the FOMC rather than his own, sellers of GBP/USD could come out to take advantage of a deceptive bounce on higher CPI.

Consensus expects US industrial output to be up 0.3% in June vs May and capacity use is seen staying below the 20y average of 79.0%.

* * *

Finally, DB's Jim Reid recaps the past 24 hours and what to look forward to:

Markets continued their streak of gains, as a tightening of US rates helped underpin gains in credit and equities yesterday. There was also a positive earnings report from Citigroup, some relatively positive news in European politics and hopes of policy easing in China which helped boost risk sentiment. But it was the US data that set the tone yesterday, particularly the disappointing retail sales report which eased fears of near term Fed tapering. Starting with Citigroup, the bank reported better than expected Q2 earnings which helped US banking stocks post a 0.78% gain, outpacing the broader S&P500 index (+0.14%). Citigroup’s Q2 EPS was $1.34 ($1.25 ex CVA/DVA) which was solidly ahead of consensus estimates calling for $1.18. The revenue line also managed to squeeze in ahead of estimates at $20.0bn vs consensus of $19.8bn. Our US banking analyst noted a number of positives in the result including strong revenue trends from core businesses including a 68%yoy increase in equities, a well-contained cost base and a reduction in non-core legacy assets. On a less positive note, a core theme that has emerged in the US bank results to date is the pressure on net interest margins and this was also evident in Citi’s results where NIM declined by 3bp. On the balance sheet side, Citi reported that its leverage ratio averaged 4.9% for the quarter and at the end of June had exceeded the 5% minimum recently proposed by US regulators. Markets appeared to like the result with Citi’s share price 2% higher and its 5yr CDS quoted 6.5bp tighter on the day.

Back to the broader markets, the release of the US data yesterday saw 5yr and 10yr UST yields rally 8-10bp. Both closed around 5bp lower on the day. Similarly, the dollar index was headed for an intra-day high of +0.6% before it reversed course sharply post-data to close virtually unchanged on the day. In terms of the data itself, June retail sales rose a weaker-than-expected +0.4% (vs 0.8% expected) in the headline following a downward revision to May (- 0.1% to 0.5%) and a modest increase for April (+0.1% to 0.2%). DB’s US economists highlight that outside of motor vehicle sales, which rose 1.8% in the month, the retail results were even softer (unch. vs. +0.5% expected).

Overshadowed by the poor retail data, the NY Empire survey posted strong July result (9.5 vs 5.0 expected). The July NY Empire reading is a 6-month high and comes after last month’s strong print (7.84 vs 0 expected). Nevertheless, the disappointing retail sales data was enough to prompt our US economists to revise down our Q2 GDP estimate by one full percentage point to 1.3%, joining a number of other investment banks in taking down GDP forecasts over the last 24 hours. However DB caution against reading too much into the Q2 number given the upcoming benchmark revisions that the Bureau of Economic Analysis will make.

The weaker US dataflow and resulting GDP downgrades eased some fears of a near term Fed tapering (we’ll find out more this topic on Wednesday/Thursday
when Bernanke speaks). It also helped the S&P500 post its eighth consecutive gain which is its longest winning streak since January 2013. Both the S&P500 and Dow closed at fresh all-time highs. Indeed, US equities have had a very robust start to the month of July. As it stands, the S&P500 has experienced only one negative day out of 10 this month, and the one negative day that we did see resulted in a minor loss of -0.05%. The combination of better equity market sentiment and lower US rates helped major credit indices including the European iTraxx (-3bp), Crossover (-14bp) and US IG (-1bp) grind lower as they move steadily towards series tights.

In European rates, yesterday saw spread compression between core and periphery as markets as political concerns in Portugal and Spain lessened. Portugal’s 10yr yield rallied -20bp to 7.01% with the Portuguese government hoping to put in place a cross party pact to support the existing troika programme until its completion next year and Spanish PM Rajoy pledging to complete his term despite ongoing corruption allegations. Elsewhere in Europe, Fitch downgraded the EFSF to AA+ from AAA. The move came after European markets had shut but probably doesn’t come as a major surprise given Fitch’s downgrade of France late last week. Furthermore, Fitch’s rating action on the EFSF merely brings its rating to the same level as Moodys and S&P at Aa1 and AA+ respectively.

Taking a look at overnight markets, Asian equities are mixed this morning despite early gains and a positive finish to the US session. Chinese equities are leading the region’s losses (Shanghai Comp -0.7%) on reports that the Chinese government will introduce further curbs designed to limit house price rises such as property taxes. This is putting pressure on Chinese property developers whose stocks are down 1.1% this morning. On the policy side, domestic newswires are reporting that China’s State Council may release economic plans for the second half of the year tomorrow (21st Century Business Herald). India’s NIFTY index is underperforming (-1.7%) after the RBI announced measures to curb the INR’s decline including raising two key money market rates. The INR has recovered 1% versus the USD this morning.

Bucking the regional trend, Japanese equities are seeing solid gains (Nikkei +0.6%) after reopening following Monday’s public holiday. USDJPY’s rally to 99.8 over the past two days is also helping sentiment there.

Turning to the day ahead, the German ZEW survey, UK CPI and Italian trade data for the month of May are the major economic reports in Europe today. In the US, June CPI and industrial production will be the main focus. On the former, DB is anticipating a +0.3% increase in the headline and +0.2% increase in the core, but a +0.3% rise in the core is possible if there is some retracement of medical care prices which have shown record weakness over the past couple of months. The NAHB housing index is also scheduled today. In terms of earnings, Yahoo and Goldman Sachs are amongst the latest companies to report.

See the original article >>

Industrial Production In Line: Hardly Bad Enough To Send S&P Above 1700

by Tyler Durden

Those hoping that the Stalingrad & Propaganda 471 would soar above 1700 today on some abysmal Industrial Production will have to taper their hopes, as the number printed right on top of expectations, or at 0.3%, up from last month's 0.0%. This was driven by a better blend of Manufacturing (+0.3%), Mining (+0.8%), both the highest since February, and Utilities which dipped -0.1%, but far better than the prior two months' -1.6% and -2.8% declines on "cooler|warmer" weather. Parallel to the IP data the Capacity Utilization printed at 77.8, up from an upward revised 77.7 last month, and a fraction above expectations, leading to the first "beat" in the series since 2010 even though the headline number was 0.1 above the lowest print of 2013 to date. Alas, with the Old Normal average in the 80+ range, there is much room to go before the legacy manufacturing slack is absorbed. One thing is certain: QE is not helping.

The visual breakdown:

Some more on Cap Utilization:

Capacity utilization rates in June for industries grouped by stage of process were as follows: At the crude stage, utilization fell 0.1 percentage point to 86.2 percent, a rate 0.1 percentage point below its long-run average; at the primary and semifinished stages, utilization inched up 0.1 percentage point to 76.0 percent, a rate 5.0 percentage points below its long-run average; and at the finished stage, utilization rose 0.2 percentage point to 76.1 percent, a rate 1.0 percentage point lower than its long-run average.

The estimates for industrial capacity in 2013 were revised for this release. The revisions reflect updated measures of physical capacity from various government and trade sources as well as updated estimates of industry capital spending. Capacity for the industrial sector, measured from the fourth quarter of 2012 to the fourth quarter of 2013, is now expected to increase 1.8 percent, a rate that is 0.1 percentage point slower than previously estimated. Manufacturing capacity is expected to rise 1.6 percent in 2013, a pace 0.2 percentage point less than in previous estimates. Relative to the previous estimates, faster gains in the high-technology and motor vehicles industries have been more than offset by slower gains elsewhere in manufacturing. The increase in mining capacity for 2013 has been revised upward by 0.5 percentage point to 4.4 percent, while the change in capacity for utilities, at 0.9 percent, is 0.2 percentage point faster than previously estimated.

From the report, breaking down IP by Industry Group:

Manufacturing output increased 0.3 percent in June after having risen 0.2 percent in May. The index for manufacturing decreased at an annual rate of 0.2 percent in the second quarter, after having advanced 5.1 percent in the first quarter. The factory operating rate inched up to 76.1 percent in June, a rate 2.6 percentage points below its long-run average.

The output of durable goods moved up 0.5 percent in June; for the second quarter, the index increased at an annual rate of 1.5 percent after having improved 6.5 percent in the first quarter. Among its major components, the largest gains in June were for machinery, for miscellaneous manufacturing, and for motor vehicles and parts, which all posted gains of more than 1 percent. The indexes for several other categories also moved up, but those for wood products, primary metals, aerospace and miscellaneous transportation equipment, and furniture and related products all decreased. Capacity utilization for durable goods manufacturing moved up 0.2 percentage point to 76.2 percent, a rate 0.8 percentage point below its long-run average.

The production of nondurable goods was unchanged in June after having edged up 0.1 percent in May. The index fell at an annual rate of 1.5 percent in the second quarter after having advanced 4.5 percent in the first quarter. Among nondurables, the index for food, beverage, and tobacco products increased 0.8 percent and the output of textile and product mills stepped up 1.4 percent in June. These gains were offset by losses of 0.9 percent both in printing and support and in paper as well as a drop of 1.1 percent in petroleum and coal products. The other major nondurables industries posted only small changes, with the indexes for apparel and leather and for plastics and rubber products up slightly and the index for chemicals down a little. Capacity utilization for nondurables remained at 77.5 percent for the third consecutive month, a level 3.2 percentage points below its long-run average.

Production for non-NAICS manufacturing industries (publishing and logging) increased 0.7 percent in June, the first gain realized in 2013; the index fell at an annual rate of 6.4 percent last quarter, a smaller decrease than in the first quarter.

In June, the production at mines advanced 0.8 percent, double its rate of increase in May. For the second quarter, mining output rose at an annual rate of 4.9 percent after having fallen 0.7 percent in the first quarter. In June, the capacity utilization rate for mining increased 0.3 percentage point to 87.9 percent, a rate 0.6 percentage point above its long-run average. The production index for electric utilities edged up 0.1 percent, while the index for natural gas utilities fell 1.0 percent. The operating rate for utilities inched down 0.1 percentage point to 77.6 percent, a rate 8.6 percentage points below its long-run average.

See the original article >>

June 2013 CPI Inflation Continues to Accelerate

by Doug Short and Steven Hansen

The June 2013 Consumer Price Index (CPI-U) year-over-year inflation rate again rose moderately from 1.4% to 1.7% . Core inflation (CPI less food and energy) declined from 1.7% to 1.6%.

The dynamics were that energy costs were the big driver this month with minor supporting roles from food, apparel, and medical. All others were mixed.

The Producer Price Index (released last week) showed finished goods jumped from 1.7% in May to 2.5% in June 2013. It is seldom that the CPI is lower than the PPI.

Percent Change Year-over-Year – Comparing PPI Finished Goods (blue line) to PPI Crude Materials (red line)

As a generalization – inflation accelerates as the economy heats up, while inflation rate falling could be an indicator that the economy is cooling. However, inflation does not correlate well to the economy – and cannot be used as a economic indicator.

Energy by far was the major influence on this month’s CPI.

The Consumer Price Index for All Urban Consumers (CPI-U) increased 0.5 percent in June on a seasonally adjusted basis, the U.S. Bureau of Labor Statistics reported today. Over the last 12 months, the all items index increased 1.8 percent before seasonal adjustment.

The gasoline index rose sharply in June and accounted for about two thirds of the seasonally adjusted all items change. Other energy indexes were mixed, with the electricity index rising, but the indexes for natural gas and fuel oil declining. The food index increased in June as the index for food at home turned up after declining in May.

The index for all items less food and energy increased 0.2 percent in June, the same increase as in May. Advances in the indexes for shelter, medical care, and apparel accounted for most of the rise, with increases in the indexes for new vehicles and household furnishings and operations also contributing. The indexes for airline fares, used cars and trucks, and recreation all declined in June.

The all items index increased 1.8 percent over the last 12 months, an increase from last month’s 1.4 percent figure. The index for all items less food and energy has risen 1.6 percent over the last year, the smallest 12-month change since June 2011.

Historically, the CPI-U general index tends to correlate over time with the CPI-U’s food index. The current situation is putting an upward pressure on the CPI countering the downward pressure on the CPI by the Producer Price Index.

CPI-U Index compared to the Food sub-Index of CPI-U

Notice the gap in the above graphic between the CPI and Food – historically this gap has always closed when the knock-on effect from higher food prices into other CPI components moderates.

The market expected month-over-month CPI-U growth at 0.3% (versus 0.5% actual), with the core inflation expectations at 0.2% (versus 0.2% actual).

The Federal Reserve has argued that energy inflation automatically slows the economy without having to intervene with its monetary policy tools. This is the primary reason the Fed wants to exclude energy from analysis of consumer price increases (the inflation rate).

/images/z cpi1.png

In the above chart – the green boxes are elements moderating inflation, while the red boxed items are fueling inflation. And the graph below looks at the different price changes seen by the BEA in this PCE release versus the BEA’s GDP and BLS’s Consumer Price Index (CPI).

Year-over-Year Change – PCE’s Price Index (blue line) versus CPI-U (red line) versus GDP Deflator (green line)

Detailed Analysis

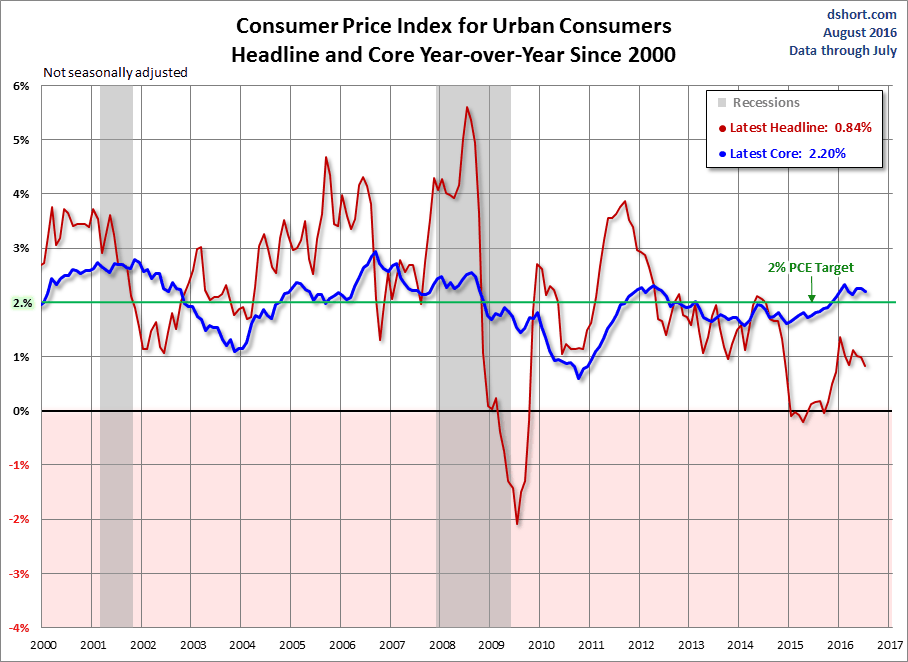
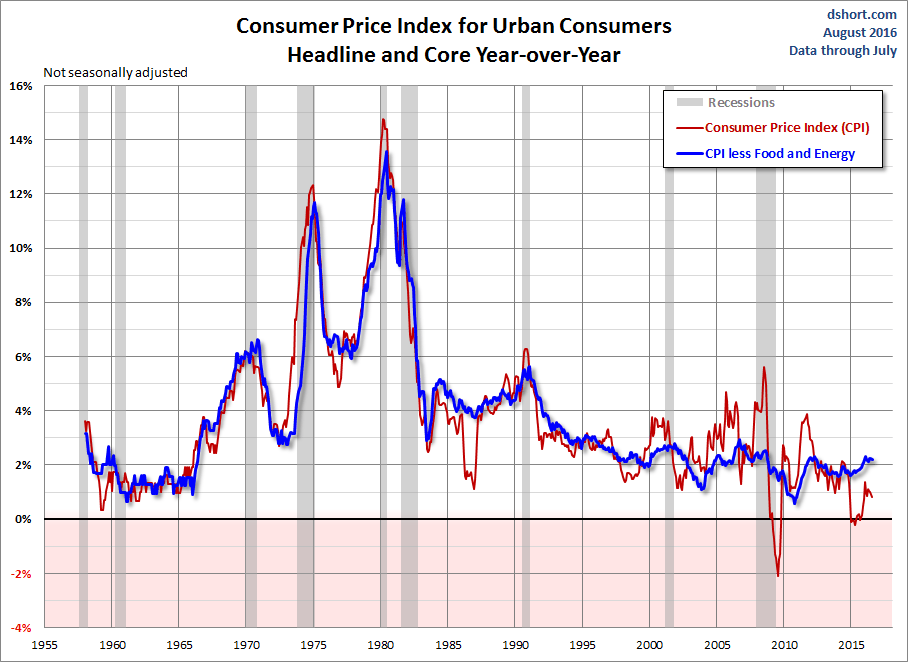
The first chart is an overlay of Headline CPI and Core CPI (the latter excludes Food and Energy) since 1957. The second chart gives a close-up of the two since 2000.

On the chart below I’ve highlighted 2 to 2.5 percent range. Two percent has generally been understood to be the Fed’s target for core inflation. However, the December 12 FOMC meeting raised the inflation ceiling to 2.5% for the next year or two while their accommodative measures (low Fed Funds Rate and quantitative easing) are in place.

Federal Reserve policy, which has historically focused on core inflation, and especially the core Personal Consumption Expenditures (PCE), will see that the latest core CPI is below the near-term target range of 2 to 2.5 percent, and the more volatile headline inflation, is well below the target range

Caveats on the Use of the Consumer Price Index

Econintersect has performed several tests on this series and finds it fairly representative of price changes (inflation). However, the headline rate is an average – and will not correspond to the price changes seen by any specific person or on a particular subject.

Although the CPI represents the costs of some mythical person. Each of us need to provide a multiplier to the BLS numbers to make this index representative of our individual situation. This mythical person envisioned spending pattern would be approximately:

The average Joe Sixpack budgets to spend his entire paycheck or retirement income – so even small changes have a large impact to a budget.

The graph above demonstrates that fuel costs, medical care, and school costs are increasing at a much faster pace than the headline CPI-U.

The Consumer Price Index for Urban Consumers (CPI-U, or more generally CPI) is the most familiar gauge of inflation in the US. The data for the non-seasonally adjusted series stretches back a century to January 1913. But the news of late is about a relative newcomer to the inflation metrics of the Bureau of Labor Statistics (BLS), the Chained CPI for Urban Consumers (C-CPI-U). The BLS has a Frequently Asked Questions page on the Chained CPI that’s been around for a while. At present the page footer says “Last Modified Date: April 6, 2005″.

The reason the Chained CPI has been a hot topic in the news is that it’s being proposed as the method for determining cost of living adjustments for Social Security. Here are some typical examples of topic in the popular press:

For a snapshot comparison of how the conventional CPI and Chained CPI stack up against each other, I’ve created a variation on the CPI chart I’ve been updating monthly for the past several years here. The chart illustrates the overall change in inflation for CPI, Core CPI, and the eight top-level components of CPI since the turn of the century (more here). I also include energy, which is a collection of subcomponents, and College Tuition and Fees, a subcomponent of one of the top eight.

The BLS has published the data for these metrics for chained CPI from December 1999. The one missing element is College Tuition and Fees, a subcomponent of Education and Communication. The chart below pairs the two versions of each component showing the total change since December 1999. We can thus have a more educated sense of how the Chained CPI and conventional CPI differ from one another.

Click to View
Click for a larger image

Here is a bottom line comparison: Since December of 1999, the average year-over-year inflation calculated monthly based on the conventional CPI has been 2.41%. For equivalent calculation for the Chained CPI it is 2.15%, a difference of 0.26%.

The calculation for the Social Security COLA, however, is based on a different CPI series, the Consumer Price Index for Urban Wage Earners and Clerical Workers, usually referred to as the CPI-W. Since December of 2000, the year-over-year average for CPI-W is fractionally higher than YoY CPI at 2.45%, which is 0.30% higher than the YoY average for Chained CPI.

Here is a snapshot that compares the cumulative effect of inflation with these three indexes:

Over time the proposed switch to the Chained CPI for Social Security COLAs will substantially lower the cost to government … and the size of payouts to recipients.

The Consumer Price Index contains hundreds of sub-indices which should be used to show price changes for a particular subject.

Because of the nuances in determining the month-over-month index values, the year-over-year or annual change in the Consumer Price Index is preferred for comparisons.

See the original article >>

Record pork supply seen as U.S. farms profit again

By Elizabeth Campbell

U.S. hog farmers are making money for the first time in a year after prices surged to a two-decade seasonal high and feed costs fell, spurring them to expand herds that will yield the most pork on record.

About 5.882 million sows were withheld for breeding by June 1, the most in four years, with a record 10.31 pigs being born per litter, U.S. Department of Agriculture data show. The cost of corn, the main feed grain, tumbled 32% in the past year. Hog futures for December (CME:HEZ13), which rose as high as 83.7 cents last month, will drop 8.2% to 75 cents a pound in Chicago by the time they settle, according to the median of nine analyst estimates compiled by Bloomberg.

Cheaper grain and higher hog prices are reversing producer losses that an Iowa State University economist estimated at $33 per animal and cut Smithfield Foods Inc. earnings by 49% last year. Hog farmers probably will earn $15 a head in the three months ending Sept. 30, according to Purdue University. The USDA predicts pork output will rise 3.1% to a record in 2014, easing pressure on global meat prices that rose the most in nine months in June and increased costs for Denny’s Corp. restaurants that added “baconalia” items to their menus.

“Profits are going to lead to expansion, and that’s going to lead to more hogs and lower hog prices,” said Ron Plain, a livestock economist at the University of Missouri in Columbia who has studied the industry for three decades. “We’re going to end up with more pigs being born in the second half of this year than anticipated. That’s going to be a drag on 2014.”

Peaking Prices

The Chicago Mercantile Exchange’s Lean-Hog Index, a measure of cash prices used to settle futures, surged 39% since the end of March to $1.0298 a pound yesterday. The Standard & Poor’s GSCI Spot Index of 24 commodities fell 1.3%, and the MSCI All-Country World Index of equities rose 3.1%. A Bank of America Corp. index shows Treasuries lost 2.4%.

While the hog herd on June 1 was little changed from a year earlier at 66.65 million head, the number of breeding sows was the highest since 2009, quarterly USDA data show. Domestic pork output will reach a record 23.4 billion pounds (10.6 million metric tons) in 2013 and increase to 24.135 billion next year, the department said July 11.

It takes about a year to produce a pig big enough to slaughter. The cost of corn plunged from an all-time high of $8.49 a bushel in August to $5.035 yesterday, with U.S. production poised to surge 29% to a record after last year’s drought. Goldman Sachs Group Inc. expects the grain to trade at $4.75 in three months.

Corn Costs

“We’re just about to the start line of expansion,” said Chris Hurt, a professor of agricultural economics at Purdue University in West Lafayette, Indiana. “Nothing like making money to keep producers interested in expansion.”

The drop in corn costs will also limit gains in hog and pork prices, curbing the incentive for boosting output, said Mark Greenwood, who oversees $1.4 billion of loans and leases to the hog business as a vice president at AgStar Financial Services Inc. in Mankato, Minnesota.

Hedge funds and other large speculators expanded bets on higher hog prices for 14 consecutive weeks by July 9 and are the most bullish since December 2011, U.S. Commodity Futures Trading Commission data show.

Demand for pork is growing in China, the biggest consumer, as middle-class incomes rise. Shuanghui International Holdings Ltd., based in Hong Kong, agreed in May to acquire Smithfield, the world’s largest producer, for $4.7 billion. U.S. output also may be limited by porcine epidemic diarrhea virus, which the U.S. has found in 16 states since April.

Herd Expansions

The rebound in grain supplies may trigger herd expansions over several years, said Purdue’s Hurt. Producers broke even in the three months ended June 30, ending losses that averaged $28 a head from the third quarter of 2012 through March 31, he said.

For farmers who didn’t hedge their production, losses probably averaged $33 an animal from August through May, said Shane Ellis, an agricultural economic specialist at Iowa State University in Carroll, Iowa. That would indicate a combined industry loss of $3 billion based on cash prices and the number of hogs sold, he said.

Next year, profit may average $10-$15 a head for most farmers who hedge their price risk, AgStar’s Greenwood said.

Smithfield Losses

Hedging curbed losses from hog production for Smithfield, which reported net income of $183.8 million in the 12 months to April 28, from $361.3 million a year earlier. The Smithfield, Virginia-based company, which earned money in its pork and packaged-meat units, said it lost about $7 a head. The hog unit had an operating loss of $119.1 million, compared with profit of $166.1 million a year earlier.

Smithfield, in a June 18 filing, predicted “lower raising costs and improved efficiencies and productivity in our hog- production segment should result in improved operating margins in the mid-single digits on a per-head basis” for the 2014 fiscal year.

U.S. consumers may pay as much as 2% more for pork this year, compared with a 3.5% increase in overall food costs, the government predicts. Global meat prices rose 2.1% in June, the biggest gain since September, and are up 4.5% in the past 12 months, United Nations data show. Global food costs gained 5.4% in the past 12 months.

Maple Bacon Sundae

Pork was one of the main contributors to commodity price inflation for Denny’s, a restaurant chain with 1,689 locations, Whit Kincaid, a senior director of investor relations for the Spartanburg, South Carolina-based chain, said on a conference call April 30. The company offered a “baconalia” menu as a spring promotion that included a Maple Bacon Sundae and Caramel Bacon Stuffed French Toast.

U.S. warehouses held a record 700.98 million pounds of pork in April, government data show. At the start of peak demand for the summer grilling season in May, supplies were the most ever for the month, according to the USDA.

Shipments from the U.S., the largest exporter, slid to 2.045 billion pounds in the five months through May 31, 13% less than a year earlier, USDA data show. China, including Hong Kong, bought 36% less as it sought to limit meat with ractopamine, a feed additive used by some U.S. farmers to add lean muscle in livestock.

The dollar’s rally to a three-year high on July 8 also has eroded the appeal of U.S. imports to overseas buyers.

Domestic demand has slowed as wholesale pork surged to $1.1133 a pound on June 26, the highest since at least October 1997, when government data begins. While prices have dropped 8.8% since, touching a four-week low of $1.0075 on July 11, they are 13% higher than a year earlier.

“I’m feeding my hogs heavier,” said Bill Tentinger, who markets about 10,000 hogs a year near Le Mars, Iowa. “The price of my inputs is still quite high, but the value of these hogs is so high. It just makes sense to put a few more hogs on and walk a few more pounds to town because of that.”

See the original article >>
Follow Us