Friday, August 19, 2011

They Call It “Stagflation”

By Jeff Harding

This is the “stagflation” we have been telling you about (graphics courtesy WSJ). It’s not a rough patch.


The Bond “Bubble”

By DoctoRx

With incomprehensibly low yields on money, the U. S. has in my view definitively followed the Japanese model. Of course there are major differences. One is that the U. S. is the global big dog, alpha male, leader of the pack, etc. Ten-year Treasurys at 2.03% as I write this are lower than at any time during the 2008 crisis. 

With the consumer price index running at 3.6% annually, this is a bubble yield, yet – it exists. A great deal of savings are looking for a home and not perceiving a lot of worthwhile profitable lending opportunities. A rush of funds out of Europe, out of the stock market, and out of most commodities save precious metals is bidding up Treasurys in price. At these levels, the thinking gets interesting.

Once one is reconciled to putting up $100 into a 10 year bond and ending up, gross, with $120 a decade later ($100 of the $120 being nothing more than getting your own money back), clearly one is just looking to get one’s principal back with a “thank you” of a yield. At this point, there is not a lot of difference between getting $115 back rather than $120. That’s a 1.5% yield. So yield might drop to sub-2% in a real crisis. 

Again, this is not a case of price stability or mild price deflation a la Japan. The U. S. has, for now, the exorbitant privilege that comes from sweeping the table in the major conflicts of the 20th Century and dominating the world in quite an astonishing way, if one thinks about the trajectory of this nation.

So this is a good news-bad news story. The U. S. attracts risk capital, even though one of its sovereign states, Illinois, is essentially in default on hundreds of millions of dollars in obligations. We hear a lot about Greece’s problems, but almost nothing about Illinois, which has a similar population to Greece, and which sends a much higher percentage of its state’s leaders to prison for corruption than does Greece.

In any case, the flip side of lower and lower government borrowing rates while price inflation perks along is the price of gold. In 32 years of following the gold market, gold responds to negative or positive real interest rates. Currently, with even the 30-year Treasury yielding less than the CPI rate, gold’s price is doing what it did in the 1970s. Gold ignores crises when real interest rates are strongly positive. Gold has left being bling behind. Not only is it the non-dilutable “currency”, the world may be closer to peak gold than to peak oil.
Upon reflection and observation of the economic data, I have some thoughts about the recent debt limit agreement. In relation to gold, the agreement is wildly inflationary. The combination of a balanced cash 

Federal budget and reasonably high interest rates through the latter Clinton years pushed down the prices of gold and oil. The current policy points in the opposite direction. My guess is that the economists and bankers were advising Congress and the White House that the economy was at stall speed. Thus my suspicion is that the deal was more or less foreordained. Following recent economic orthodoxy, “stimulus” is to be continued while money is left in circulation rather than being withdrawn from circulation. Meanwhile, each side gets to point a finger at the other, which is useful when seeking campaign contributions.

Several weeks ago, I raised the question in this blog of whether the country was already in a new recession (assuming simply for sake of discussion that the Great Recession ended in 2009). The odds are now much increased that one has begun, with one usual suspect of a cause being the massive jump in oil prices coming off their crisis lows.

Returning to interest rates and banks, then, we have come a full half circle from three decades ago. Then, disinflation was the policy chosen, and high gold and oil prices were the enemy. Relatively tight money and the tolerance of interest rates as high as needed to break the inflationary fever were the policy choices. (Note there were no tax cuts in the 1980 recession or in 1981 as that great recession got underway.)

Now we have tax cuts galore even since 2008 and rather than impossibly high interest rates, we have these ridiculously low interest rates.

Just as investors had to respect the economic cycles in the 1980-3 period while being flexible and preparing for a world of secular disinflation and a ”flight” to paper money from tangibles, so too today. The major difference could be that as in Japan, zero interest rates can be a form of flypaper or quicksand. Zombie banks and bad assets that are not expeditiously liquidated mean that capital is trapped in a sort of black hole.

Thus I interpret the Fed’s statement of ZIRP for at least two years differently from the mainstream. I look at it as a well-informed prediction that there will be a “savings glut” relative to investment opportunities for a long time. While the Fed has a highly imperfect set of opinions, it certainly knows the true state of affairs in lending institutions better than I do. I’m thus not going to fight the Fed. I’m thus taking the point of view that a sluggish level of economic activity probably lies ahead of us in the United States for some time to come. I also expect negative real interest rates to bedevil us savers and provide a tailwind of varying strength to the prices of metals and other assets that can be hoarded. In weak economic times, gold will tend to be the strongest of these; that will tend to reverse when the economic has a growth spurt.

The specific investment decisions beyond the above that flow from this view will be discussed in subsequent posts.

Morning markets: crop retreat slows in line with shares, oil

by Agrimoney.com

The declines in share markets keep on coming.
The turn of Asian shares to sit on investors' weighing machine produced more of the declines which marred their Western peers on Thursday.
There was some sign of assets disappearing down the toilet less fast than in the last session, although it might not appear so from the 6.2% slump in South Korea's Kospi index.
Tokyo stocks shed a more modest 2.5%, Shanghai stocks 1.1%, and the dollar added a less severe 0.2%. New York crude lost a less-panicky-looking 1.7% to $81.02 a barrel.
'Caught in the storm'
That, of course, was hardly good news for food commodities, as Luke Mathews at Commonwealth Bank of Australia noted, saying that "the biggest skeleton in the grains' closet is the influence of financial markets.
"The risk of a US and European recession has intensified. If global financial markets spiral out of control, agricultural commodities, no matter how tight their supplies are, will get caught in the storm," he said.
So, as might be expected, farm commodities headed downwards too although, mirroring broader markets, they were generally less enthusiastic in retreat this time – one notable exception being soybeans.
Chicago soybeans, which proved remarkably resilient in the last session, were additionally weakened by further news on selldowns by China, the top importer, of state reserves.
China plans to auction 4m tonnes of soybeans to edible oil groups such as Cofco and Wilmar's Yihai Kerry Group, for a price of about 3,500 yuan, some $550, a tonne the 21st Century Business Herald said.
(Longer-term, the auction might provide market support, it that it will leave China with, reportedly, only 1.4m tonnes of state reserves left.)
IL and IA
Even so, the oilseed's decline was hardly catastrophic for bulls, at 0.6%, leaving the November lot at $13.52 ¾ a bushel as of 07:00 GMT (08:0 UK time).
Weather in the US remains reasonably supportive.
"Soybean crop conditions and production are of concern, with key states of Illinois and Iowa unusually dry, with weekly US drought monitor expanding dry areas to cover all but the northern quarter of Illinois and northern half of Iowa," Kim Rugel at Benson Quinn Commodities said.
"Recent rains have not been able to make the leap over the river into Illinois," he said, while adding that forecasts for the weekend and next week predicted moisture, "which if realised should reduce stress of pod-filling soybeans".
And, bottom line, "grains still have good fundamentals", Mike Mawdsley at Market 1 said.
'Big unknown'
There is of course, "a big unknown as to just what do we have for a crop out there for corn and soybeans", which may gain some answers in next week's ProFarmer crop tour.
"All eyes and ears will be waiting to see and hear what they are finding," Mr Mawdsley said.
And, for corn, there is particular interest in Illinois and Iowa too, with Benson Quinn noting that "various trade houses have been questioning as to whether the US Department of Agriculture August projected yields for Illinois and Iowa will hold up of 170 and 177 bushels per acre respectively".
"They are both well above last year's levels of 157 and 165 bushels per acre."
Chicago corn limited its losses to 0.4% for December delivery, taking the lot to $7.10 ¼ a bushel.
More rain in Aus
And that helped wheat, a relatively poor performer last time, limit its decline to 0.6%, to $7.03 ¼ a bushel, for Chicago's September contract.
Minneapolis wheat eased 0.3% to 9.08 ½ a bushel for September, again gaining succour from a delayed US spring wheat harvest.
As an extra downer to wheat, reports continue to come of healthy rains in Australia, where eastern dryness had begun to raise eyebrows.
Both Luke Mathews at CBA and Australia & New Zealand Bank's Paul Deane said the rain had improved crop prospects.
"The east coast and South Australian wheat belt has now received August average rainfall with still 11 days to go," Mr Deane said.
He added: "The short-term rainfall outlook is predominantly dry for the east and west coast wheat belts over the weekend, but potential good rainfall in Western Australia on Monday."
'Fundamentals remain bullish'
In Asia, palm oil for November fell, but not too heavily, down 0.5% at 3,011 ringgit a tonne in Kuala Lumpur.
"Palm oil's fundamentals remain bullish, despite the uncertain economic outlook," Ker Chung Yang at Phillip Futures said.
Confidence in the uptick in Malaysia's production has waned, at a time of growing optimism for Chinese imports.
But rubber, lost a halo provided in the last session by data showing Japanese carmakers will build nearly 23m vehicles (worldwide) in the year to next March, close to the 2006-07 record.
Tokyo's January lot tumbled 2.7% to 352.40 yen a kilogramme.

Cotton channel breakout?

by Kimble Charting Solutions


Chinese equities – to retest lows?

by Data Diary

Perhaps it’s a function of being a resident of the deep south (hat-tip to all Tasmanians), but the view from the world’s shoelaces is currently dominated by China and it’s demand for commodities. As we noted in last week’s post, it looks suspiciously like China has loosened its monetary stance in response to the softening economic conditions. Add to that we have passed through the seasonally low PMI months, and perhaps it’d be reasonable to suggest that ‘China’ is a buy around these levels.

It’s just that the charts don’t support this view. In fact looking through the commodity complex and those stocks that are most exposed to its demeanour, there is a real sense that further weakness is on the horizon. A simple indicator to gauge this view is the Chinese equity market.
The point that is being highlighted is that if equities are to make a bottom around here, history would suggest that the recent low would at least be retested over the coming months. This makes some intuitive sense given the level of uncertainty that has arisen. Without direct government action, we can expect this uncertainty to translate into weaker longs selling into spikes in nervousness. At least this type of scenario might give the RSI a chance to recover even as the price goes lower…

Choosing the Right Hammer – Sector Review 8-14


All hammers are not alike. Any carpenter will tell you that different jobs can require the different characteristics of a different weight or size of the head. A small tacking hammer for detailed work around molding, a bigger framing hammer for building the bones of the house all the way up to a sledgehammer for massive force on outside jobs. This is the same with hammers on candlestick charts. They all signal a potential for a reversal after a downtrend but some carry more force than others. In looking at the Select Sector SPDR weekly charts there are many differences in the strength of the hammers they printed this week. Let’s take a look.

Sledgehammer

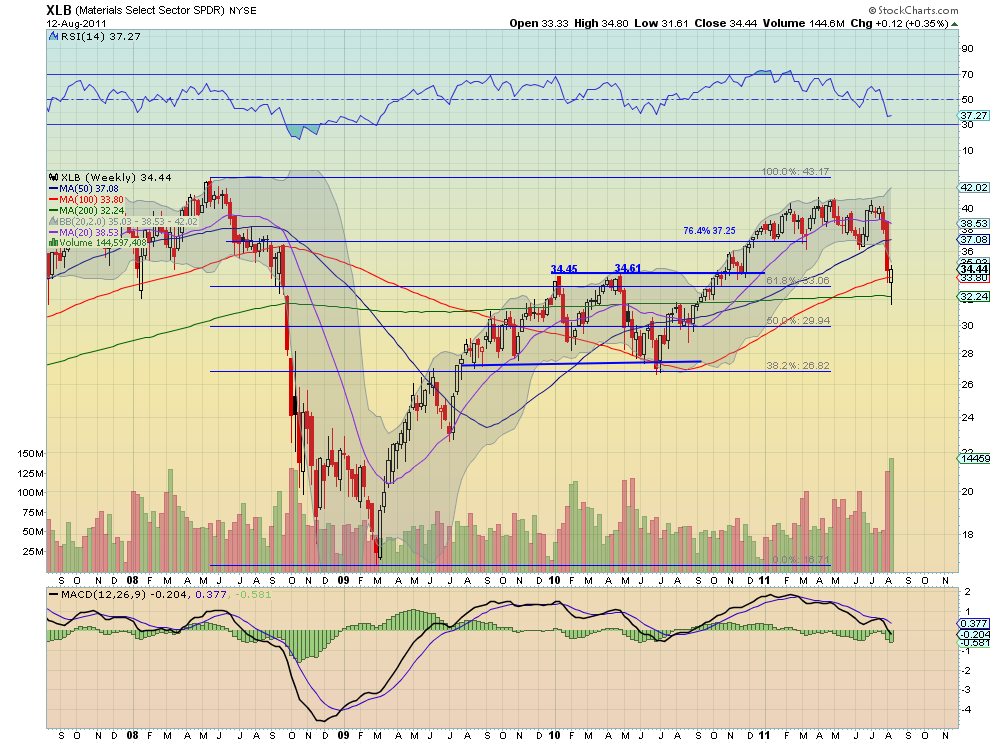
There was only one sector that printed a hammer on the week that ended higher than the previous week. This was the Materials Select Sector SPDR, $XLB. From the chart below you can see that the 100 week Simple Moving Average (SMA) provided support for the eventual move only slightly

Materials Select Sector SPDR, $XLB

higher. The Relative Strength Index (RSI) has moved sideways, ending the downward motion, but the Moving Average Convergence Divergence (MACD) indicator is still growing more negative. Like the force behind a sledgehammer blow, the move was powerful but there may still be collateral damage unseen. Watch to see if it moves back into the Bollinger bands and holds there.

Framing Hammer

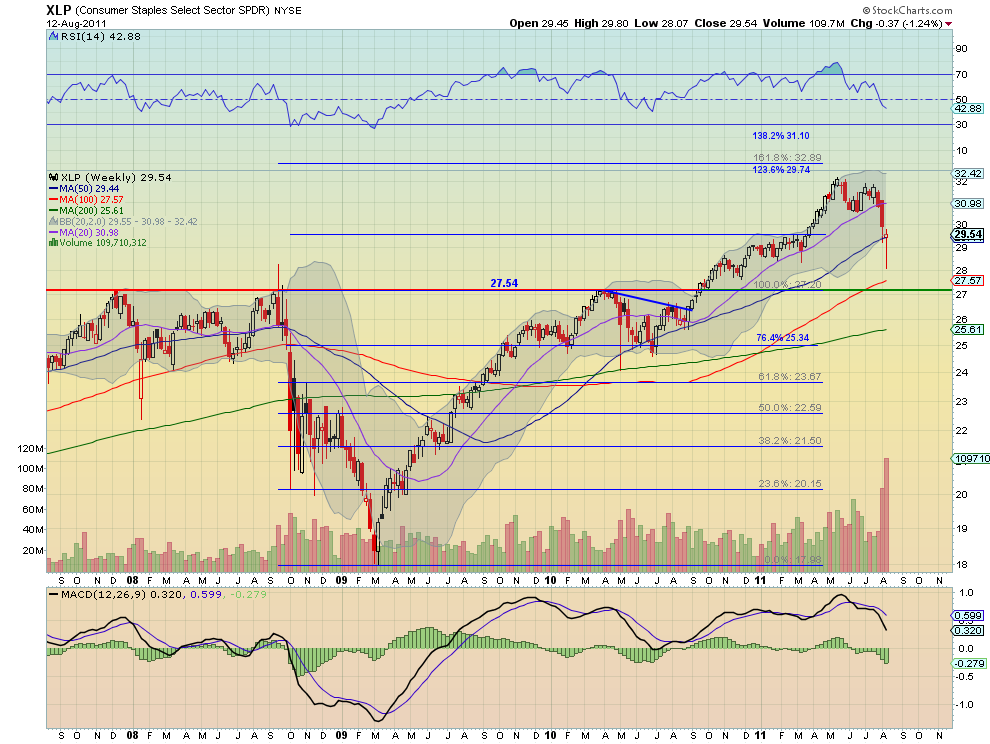
Two sectors printed hammers that showed some strength and are building a frame that may lead to further advances. These are the Consumer Staples Select Sector SPDR, $XLP and Utilities Select Sector SPDR, $XLU. From the chart the of $XLP below these two are distinguished by the fact that their hammers finished back inside their Bollinger bands and above the 50 week SMA. They have

Consumer Staples Select Sector SPDR, $XLP

RSI’s that are still trending down and MACD’s that are growing more negative in the downtrend,so there is no reason to get excited yet. But their hammers were hollow despite being red, showing that the activity for the week was bullish and their SMA’s are sloping upward. Hope.

Tacking Hammer

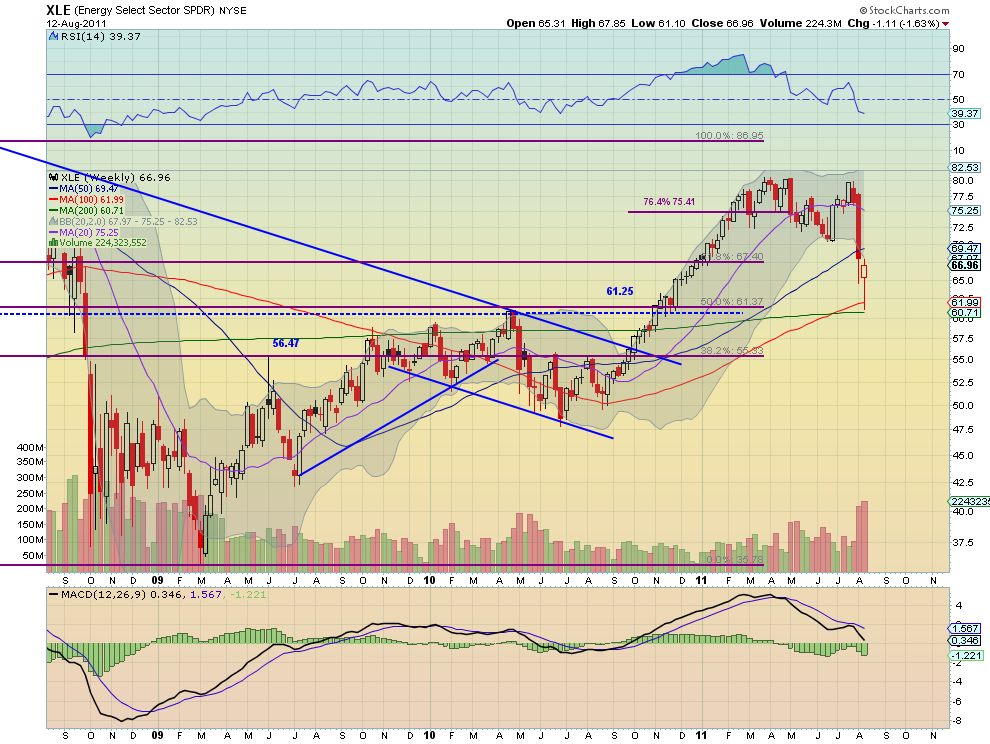
Five sectors showed very little strength in the hammers that they printed. The Energy Select Sector SPDR, $XLE, Industrials Select Sector SPDR, $XLI, Technology Select Sector SPDR, $XLK, Health Care Select Sector SPDR, $XLV and Consumer Discretionary Select Sector SPDR, $XLY make up this group. From the chart of the $XLE below, notice that these sectors finished below their 50 week

Energy Select Sector SPDR, $XLE

SMA, their RSI is still downward and their MACD is growing more negative. Additionally the 20 week SMA for each has rolled lower. The $XLI is slightly worse than the others as it is below the 100 week SMA. There is some hope though, with each in this group finishing outside of its Bollinger band, that they may jump back in or at last consolidate while the Bollinger band catches up and the hollow red candle signals bullish intra-week activity.

Toy Hammer

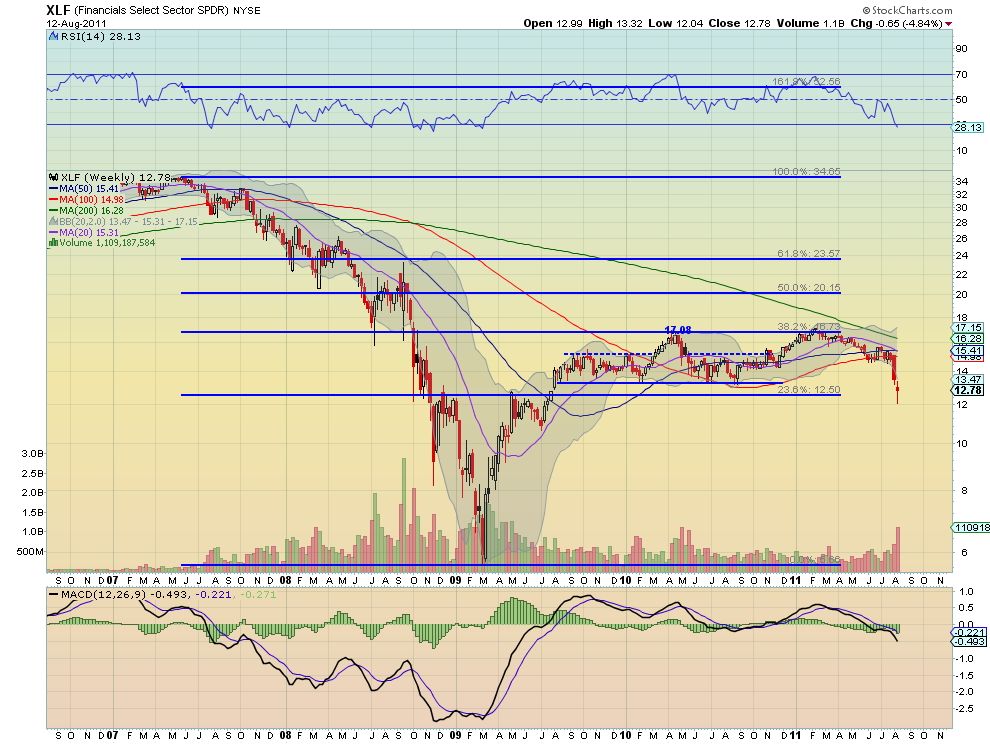
The Financials Select Sector SPDR, $XLF printed the weakest hammer of all of the sectors. Like a plastic toy hammer it did not have enough force to drive higher on the week and printed a bearish red candle. This sector continues to look the weakest with all of the SMA’s sloping lower, the RSI

Financials Select Sector SPDR, $XLF

driving lower and the MACD growing more negative. It is also outside of its Bollinger bands so it might bounce or consolidate but nothing looks good on this chart.

There were Hammer Candles printed everywhere this past week. And that is a signal to prepare for a reversal, but only if confirmed. A few sectors, $XLB, $XLP and $XLU hold more promise than others, but just because they have stronger hammers does not mean they will be confirmed. A hammer strike may miss the mark and damage the wood around the nail, and a hammer on a chart may just be a pause before more downside. Watch for confirmation before making a move unless you have the nimbleness of a day trader.

Follow Us