By Guest Author
THE OUTLOOK
Coming into 2011 we suggested there were three major themes that would play out in the course of this year. We thought the U.S. economy would slow, particularly around mid-year. Most states would have to tighten their budgets by cutting spending and jobs, and raising taxes, before their 2012 fiscal year began on July 1.
On June 30, the end of the Federal Reserve’s second round of quantitative easing would create some uncertainty since it represents a de facto tightening of monetary policy. The U.S. economy has not achieved a self sustaining level of growth in our opinion, and these headwinds were expected to weigh on growth in the second half of 2011.
Internationally there were two issues of concern. We felt the tightening of monetary policy by Brazil, China, and India would continue, and lead to a second half slowing in these high growth economies. The slowdown in these countries would likely dampen export growth from the developed countries in Europe and the U.S., which had previously been a source of strength. The recognition of the coming slowdown in the high growth economies would cause a sharp break in commodity prices, especially since China is a huge source of demand for ‘stuff’.
The second international issue was the sovereign debt crisis in Europe. Our view has been that it is ongoing and likely to intensify in 2011. We have felt it was not a question of if, but when the crisis would reach critical mass.
So far, each of these themes has developed as expected, and we see nothing on the horizon to suggest the current trends will not continue.
THE U.S.
Consumer spending represents 70% of GDP, so anything that affects consumer’s income and balance sheet is important. The earnings for the 131 million working Americans have increased by just 1.9% over the last year, which is definitely less than the increase in the cost of living. This means even most of those with a job are falling behind. There are 8.6 million workers who are working part-time, but want a full-time job. Obviously, part time work does not pay as well as a full time job, so these folks are also falling further behind. Of the 13.8 million people out of work, 42% or 5.8 million have been unemployed for more than six months. As of March, almost 5.5 million of those unemployed had exhausted their unemployment benefits, up from 1.4 million in March 2010. In coming months, hundreds of thousands of the unemployed will lose their unemployment benefits each month.
Every month we show this chart from Calculated Risk Blog.com. This chart depicts the percent of the labor force that remains unemployed and compares the current recovery to the prior 10 recoveries since 1948. Forty months after the recession began in December 2007, 5% of the labor force is undergoing a personal financial disaster. As noted in March, the combination of weak income growth, part-time employment, and the loss of millions of jobs has caused disposable income to fall by 4.7% since December 2007. This has been offset by almost $1 trillion in borrowing by the federal government to fund unemployment benefits, food stamps for more than 44 million people who are having trouble making ends meet, and other assistance programs. This support has helped many of the unemployed and underemployed keep their heads above water, and provide a lift to GDP growth. As unemployment benefits diminish for millions of unemployed workers in coming months, so will consumer spending.
In the seven quarters after the deep 1981-1982 recession ended, GDP growth averaged 6.6% per quarter. In the first seven quarters of the current recovery, GDP has grown by an average 2.8%. This recovery has been weak, and if one factors in the amount of fiscal and monetary stimulus that has been employed, it has been an exceptionally weak ‘recovery’. During the brief 2001 recession, the University of Michigan’s consumer sentiment index never dropped below 80, and then held above that level during the expansion that followed. It plunged below 80 in early 2008 as the recession took hold. In the current recovery, it has never been above 80, not even for a single month.
In the January 2009 newsletter, we suggested that a ‘less is more’ perspective would replace the ‘more is more’ spending that has characterized consumer spending since at least the early 1980’s. Even when incomes were insufficient to support all the trips to the shopping mall, Americans borrowed from their home ATM or pulled out the plastic and proclaimed “Charge It!” For a majority of consumers, those days are gone. Their home has lost at least 20% of its value, credit card companies have curbed available credit lines, incomes are stagnant, and millions are either out of work or working fewer hours than they need. For the majority of Americans, adopting the less is more perspective has not been a choice, but a necessity. But for affluent Americans, the notion of less is more is a choice. That is why a recent survey by the Harrison Group and American Express Publishing caught our attention. More affluent Americans are using coupons, waiting for items to go on sale, and are less willing to pay up for designer brands. History shows that affluent Americans are affected by changes in the stock market. They cut spending dramatically in late 2008 and early 2009 as the stock market was testing its lows, and resumed spending once the market recovery was established. Since this survey was taken in early 2011, and after the market had almost doubled from its March 2009 low, the results represent a real commentary on social change. If it persists, it will act as a drag on GDP, since affluent Americans represent a disproportionate amount of total discretionary spending.
We have felt home prices would continue to decline primarily because there is more supply than demand. In April, the National Association of Realtors reported that existing home sales fell to an annual rate of 5.05 million, a drop of .8% from March. The median sales price declined to $163,700, off 8.2%% from April 2010, according to Zillow.com. The inventory of homes for sale climbed to 3.97 million, and represents 9.2 months of supply. We expect the supply of existing homes for sale to increase during the summer.
Unfortunately, this doesn’t begin to tell the whole story. The nation’s largest banks own 872,000 homes as a result of foreclosures, according to RealtyTrac. There are another 1.4 million homes in the foreclosure process, based on an analysis by the Mortgage Bankers Association. At current sales rates, it will take banks more than three years to unload their inventory. Selling all of these homes will put downward pressure on home prices. In Q1 of 2011, RealtyTrac reports the average foreclosure sold at a 27% discount to surrounding homes. According to Zillow.com, 27% of home owners are already underwater. If prices fall further, as we expect, even more homeowners will find themselves underwater. Since the seller pays the 5% to 6% sales commission, the sales price is actually 5% to 6% less, which reduces homeowners’ cash out equity even more. As discussed previously, unless home prices defy the laws of supply and demand and begin rising, underwater homeowners are effectively removed from future demand. In addition, higher lending standards will continue to crimp demand for the foreseeable future, while baby boomers wishing to downsize will further add to supply in coming years. Trepp, a real estate research firm, estimates banks may have to absorb another $40 billion in losses, as they unload houses at a discount just to get them off their books. Of course, that assumes the regulators will actually force the banks to book the losses. Fannie Mae and Freddie Mac will dutifully book their losses, and present the bill to taxpayers (us).
The Federal Reserve will end QE2 on June 30, which does amount to a tightening of monetary policy. However, until the Fed allows its balance sheet to shrink, we believe the negative impact of the end of QE2 may be less than anticipated. We don’t expect any material change in the Fed’s accommodative monetary policy. Last week, William Dudley, President of the New York Federal Reserve, said the U.S. has a considerable way to go to meet the Fed’s mandate of full employment and price stability. He also said that raising rates too soon would have “bad consequences”. The Federal Reserve wants time to see how the markets and economy handle the end of QE2. They must also be closely watching the developments in Europe. If a dislocation develops in Europe, it will take a full nanosecond for it to reach our shores. We suspect the Federal Reserve is communicating frequently with their counterparts at the European Central Bank.
We expect the U.S. economy to plod along growing about 2%, and remain vulnerable to negative surprises.
BRAZIL, CHINA, and INDIA
In the January letter, we discussed the tightening of monetary policy in Brazil, China, and India which would raise doubts about second half growth in those countries, and cause a sharp shake out in commodities. After reviewing the rate increases initiated by the central banks in these countries in the February letter, we noted, “At some point in this year’s first half, it is going to dawn on investors that the cumulative impact of all these rate increases in the countries that have been growing the fastest will cause a second half slowdown in each of these countries.”
The Reserve Bank of Brazil’s central bank increased its Selicrate to 12.0% on April 20, making it the highest in the world. Overnight on May 2, India hiked their repo rate from 6.75% to 7.25%, a larger than expected increase. The rate increase was the ninth since March 2010. On May 12, the People’s Bank of China increased its reserve ratio for the 15th time in the last eighteen months to 21%. In early 2010, the reserve ratio was 15%. The Chinese Central Bank is attempting to curb lending by forcing banks to set aside $.21 of each $1.00 lent. In the U.S., the reserve ratio is about 10%.
Silver has been the poster child of the surge in commodity prices and for good reason. Shortly after the Federal Reserve announced its intentions to launch QE2 in November on August 10, silver soared from $18.00 an ounce to a closing high of $48.60 on Friday, April 29. On Monday, May 2, silver dropped to $42.20. Four days later silver traded down to $33.04 (July contract). Silver was not the only commodity to be hit hard. Crude oil fell from $114.83 on May 2 to $94.63 on May 6. Gold dropped to $1462.50 on May 5, from a high of $1577.40 on May 2. There is no question that a significant increase in margin requirements for these commodities played a large role in contributing to the wave of liquidation that swept through commodities in the first week of May. We think the targeted increase in margins was a stroke of genius, since it dampened speculation. The cumulative rate increases in Brazil, China, and India also diminished the notion that demand from these countries for raw materials is infinite, which has been a big part of the fundamental story supporting the run up in commodities in general.
Inflation is likely to remain a concern for each of these countries. Brazil’s Central Bank has an inflation target of 4.8%. In mid-May, consumer prices were up 6.51% from last year. This suggests the Brazilian Central Bank won’t be lowering rates soon, and may tack on one or two .25% rate increases in coming months.
In China, inflation dipped to 5.3% in April from March’s 5.4% rate, but is still above the official inflation target of 4%. Signs of slowing are beginning to emerge. Industrial output, retail sales, and money supply growth have all slowed in recent months. M2 money supply growth of 15.3% was the slowest in 29 months, and a clear indication that the increase in reserve requirements is having an impact on lending. If these trends persist through the summer, China may lower rates before the end of 2011.
India faces a more challenging environment than Brazil or China. The wholesale price index was up 8.66% in April from a year ago. India has cut fuel subsidies, which will boost energy inflation, and industrial production was up 7.3% in March from last year. Commercial credit has grown by 22% over the last year. This suggests the Reserve Bank of India may nudge rates higher in coming months.
All central banks are forced to drive monetary policy looking through the rear view mirror. This usually means they tighten, or hold policy too tight, until economic growth slows more than expected. This is possible in China as household spending as a percent of GDP has fallen to 35%, while fixed investment has climbed to 45% of GDP. This is the ideal prescription for an excess capacity problem, which could be significant. During the last two years, bank lending has amounted to 40% of China’s $5 trillion in GDP.
EUROPE
In a letter 50 years ago to President John Kennedy, economist John Galbreath wrote, “Politics is not the art of the possible. It consists in choosing between the disastrous and the unpalatable”. This certainly applies to the sovereign debt problems plaguing the European Union. The fundamental problem is that Greece, Ireland, Portugal, and Spain have too much debt, and too little economic growth to service their debt loads. The European banking system could collapse if their banks were forced to acknowledge this reality. German and French banks have $541 billion of exposure to these weak countries. If the ECB allows any restructuring of Greece’s debt, banks in Portugal and Spain will wobble. This event will spill over into Italy, and from there move on to Paris and Berlin.
We are witnessing an example of the classic paradox, “What happens when an unstoppable force meets an immovable object?” The ECB would like to think of itself as an immovable object. Unfortunately, the real world is far less malleable than the ECB needs it to be. In 2010, Greece’s economy shrank 6.6%, so its ratio of debt to GDP rose, and is expected to reach the unsustainable level of 159% of GDP in 2012. Last spring, Greece received a $158 billion bailout package from the EU and IMF. In March, the IMF estimated that Greece would be able to roll over $20 billion in debt coming due on March 20, 2012 at 5.6%. On Monday, May 23rd, Greece’s 10-year bond was yielding 17.23%. This represents the unstoppable force of a Greek debt restructuring which is unpalatable, or worse, a default that would be disastrous.
The rippling effect since the end of 2010 is plainly evident, as the yield on 10-year Italian bonds has jumped from 3.75% to 4.81%, and Spain’s 10-year yield has soared from 4.0% to 5.54%.
Greece announced on May 23rd that it would accelerate plans to sell state-owned assets over the next five years it says are worth $70 billion. This is not going to be easy. First, it assumes the credit market will exhibit a level of patience that will be sorely tested by Greek labor unions. The largest Greek union represents 1.5 million private sector workers and strongly opposes privatization of state companies of strategic significance. It says privatization will lead to higher prices for power and water, and lost jobs. We expect there will be work stoppages that will bring the Greek economy to its knees. A poll last week found that 62% of Greeks believe the austerity program, imposed by the EU and IMF as conditions for the bailout last year, were hurting the Greek economy, rather than helping. This suggests union strikers may receive broader public support, even if strikes prove inconvenient.
Greek banks are not able to borrow money in the credit market, so in March they borrowed $125 billion from the ECB. The ECB accepts Greek government debt as collateral, even though all three rating agencies rate it as junk. The ECB has threatened to stop accepting this junk, which would precipitate an immediate collapse of the Greek banking system. Since this would tip the first domino of a broader crisis, we expect the immovable object the ECB fancies itself to be, to move however reluctantly.
However, even if the ECB displays a measure of flexibility, it does not change the magnitude of the underlying problem. European banks are under-capitalized, and the sovereign debt problem is only going to get worse. The ECB and the IMF will do everything possible to postpone the day of reckoning. We doubt they will be able to hold it together until March 20, 2012 when Greece needs to roll $20 billion of its debt. And we haven’t even mentioned Spain!
STOCKS
During the last 110 years, the stock market has alternated between periods of extended advances and declines. Swinging like a pendulum, each secular bull market or bear market lasts between 15 to 25 years. The recent secular bull market lasted from 1982 until 2000, or possibly until 2007, since the broad market averages made higher highs in 2007. A conventional 15-year secular bear market from the peak in 2000 targets an end in 2015-2016, or 2022-2023 if the high in 2007 is used. Historically, economic contractions accompanied by financial crisis’ have lowered annual GDP by -1.0% for a decade or longer. In 2008, we experienced the largest global financial crisis in history, and the echoes of that event continue to reverberate in the global economy. If economic activity grows more slowly, as we have expected since the current recovery began in 2009, a decline in the S&P’s P/E ratio to below its long term average would be rational. If valuations are to approach those seen in 1942 or 1982, the stock market could easily experience another decline of 30% or more by 2015-2016.
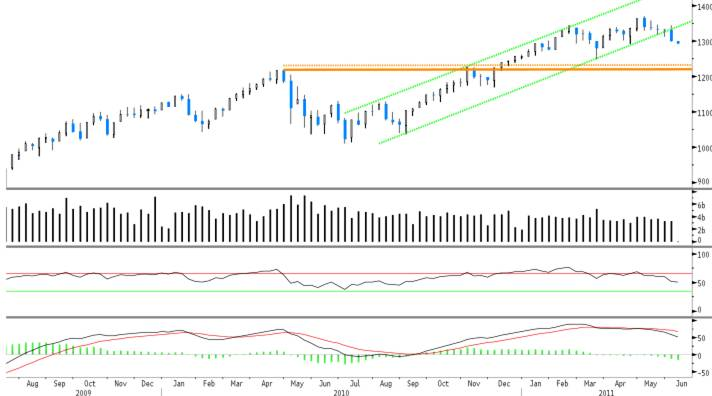
Within this context, we believe the stock market has been in a cyclical bull market since the low in March 2009. Our goal is to identify when this cyclical bull market will give way to the next leg of the secular bear market. The Major Trend Indicator is still in the bull market camp, but since it is designed to identify the major trend, it will never pick the top or bottom with precision. A quick read of the S&P 500 chart shows that since the low on July 1, 2010, every low and high has been higher. This is the classic definition of an uptrend. A decline below 1294 on the S&P will be a warning that the intermediate trend is weakening, and with a drop below 1249, a confirmation that the intermediate trend has turned down. Short term, the decline from the high on May 2 at 1370 looks choppy, and suggests the market will rally again to at least test 1370, as long as the S&P does not drop below 1249.
In last month’s letter, we thought the S&P might make a run at 1400, after breaking out above 1332. We suspected that investors would sell into this rally, since most expect the market to decline after the Fed ends QE2 on June 30 and wouldn’t wait until July 1 to see what happens. “Our guess is that the market will top before mid May and then decline into July.” The S&P topped on May 2. In early April, bullish sentiment was rampant. The Investors Intelligence survey showed 57.3% bulls and only 15.7% bears, while the American Association of Individual Investors registered 43.6% bulls and just 28.9% bears. In anticipation of the decline most expect once QE2 ends, sentiment has become far less bullish, with the AAII survey showing 14.6% more bears than bulls last week. This is constructive and supports our view that a test of 1370 is likely, before the market becomes vulnerable to a larger decline.
In a Special Update that was sent to subscribers of MACRO TIDES on March 29, we recommended the purchase of four ETFs. Here are the opening prices for the recommended ETFs on March 30, and the prices they were sold: Brazil (EWZ) $76.04, stopped May 3 at $76.18, Korea (EWY) $63.68, stopped out on May 17 at $63.95, Australia (EWA) $26.44, half sold on April 27 at $28.25 and half stopped on May 4 at $26.90, S&P Small Cap 600 (IJR) $72.61, half sold at $74.70 on April 26, and half stopped on May 24 at $71.39.
BONDS
The stock market has not rewarded equity investors over the last decade, with the S&P returning a scant average annual return of 1.4%. Many investors have become gun-shy, especially after 2008 and the failure of traditional asset allocation to protect and preserve their capital. Many baby boomers simply cannot afford to lose any more money, since the value of their 401(k)’s and homes are not worth what they expected or planned, as they get nearer to retirement. The miniscule return offered by most money market funds of .25% or less has left investors frustrated, and looking at alternatives to the stock market or a money market fund. Many investors have chosen to move some of their savings into bond funds, just to get a modest return.
The bond market also experiences secular bear and bull markets, with the last secular bull market beginning in 1981, when the 10-year Treasury yield peaked near 15%. Yields are now near a multi-generational low, so the risk of a secular bear market in bonds is higher than most investors realize. If bonds do enter a secular bear market in the next few years, bond yields will rise, and bond fund investments will lose value. Without realizing it, frightened stock market investors, if they increased their allocation to bonds, may have jumped from the frying pan into the fire.
We believe the 10-year Treasury yield will remain range bound, between 2.7% and 4.0% for months, since the economy will prove weaker than expected, and the prospect of a European debt crisis attracts safe haven money. Any weekly close above 4.0% will be very negative. With the 10-year Treasury bond yield near 3.1%, we expect it to drift up toward 3.3%.
DOLLAR
As noted last month, “Sentiment is obviously at an extreme, and suggests that when momentum does turn up, the Dollar will have a multi-week rally, maybe longer.” We think the Dollar has made an intermediate low, and recommend buying the Dollar’s ETF UUP at $21.56.
GOLD
As discussed last month, “Gold is now tagging the trend line (top blue line) that connects prior highs in May 2006, March 2008, and November 2010. We’ve been watching this trend line for some time, but didn’t think gold would run up to it so soon. Looks like a good place to lighten up. A decline below $1,450 and this trend line would confirm a top.” Gold dropped to $1462.50 on May 5, after spiking to a high of $1577.40 on May 2. We think Gold will fall short of its May 2 high, and then decline and test $1462.50, and eventually dip to $1400.00.
See the original article >>