Tuesday, May 24, 2011

Financial Sector Continues to Struggle

by Bespoke Investment Group

The overall market is relatively flat today, but the S&P 500 Financial sector is down once again, putting it down 3.50% year to date. A sector or stock is generally thought to be in a long-term uptrend when it is trading above its 200-day moving average and a long-term downtrend when it is below its 200-day moving average. As shown in the chart below, the Financial sector has just broken below its 200-day moving average today. 


See the original article >>

When the economy reaches stall speed


If an airplane is moving too slowly, the plane is about to head down. Federal Reserve economist Jeremy Nalewaik has an interesting new paper exploring whether the same is true for the U.S. economy.

Nalewaik notes first that the 4 quarters prior to recessions were usually characterized by slower real GDP growth than is typically observed in an economic expansion.


Estimated density of real GDP growth in the 4 quarters prior to an economic downturn (dashed blue) and all other quarters characterized as economic expansion (solid red). Source: Nalewaik (2011).
stall1 economy


He then estimates Markov-switching models in which there may be an intermediate phase the economy moves into before or after an economic recession. This approach allows for a variety of possible outcomes. For example, it could capture a phase of rapid GDP growth in the first few quarters of a recovery, as proposed by Sichel (1994). However, Nalewaik usually finds evidence of a “stall” phase that the economy enters before going into a full-blown recession. For example, real GDP might be expected to grow at only a +1 to +2 percent annual growth rate per quarter while in the stall phase, before falling outright at a -1 to -2 percent rate during a recession.
Unemployment in the stall phase might be expected to increase by 0.1% per quarter, before rising at 0.6% per quarter once the recession proper begins. The graph below shows the inferred probability that the economy was in the stall phase and the recession phase as inferred from unemployment dynamics.


Probability (reported as percent out of 100) that the U.S. economy was in the stall phase at any given date (solid) and in an economic recession (dashed) as inferred from unemployment rate alone. Shaded regions correspond to NBER recession dates (not used in estimation). Source: Nalewaik (2011).
stall2 economy


The figure above represents an inference based on the full sample of data as subsequently observed. It is a trickier business to construct real-time forecasts with this approach. Slow economic growth or gradually rising unemployment sometimes is a precursor for a recession, but sometimes it’s just a temporary hiccup before more robust growth resumes. Nalewaik recommends a more detailed model for forecasting that makes use of other leading indicators such as the slope of the yield curve or housing starts.

And of course the big question right now is whether the recent sluggish growth could turn out to be part of another pre-recession stall phase. The yield curve is steeply sloping up at the moment. In normal times that would be a favorable indicator, but it’s pretty hard to interpret in the current setting with the short-term interest rate artificially stuck at zero. Housing starts are likewise of limited help at the moment since residential construction has been dead for so long.

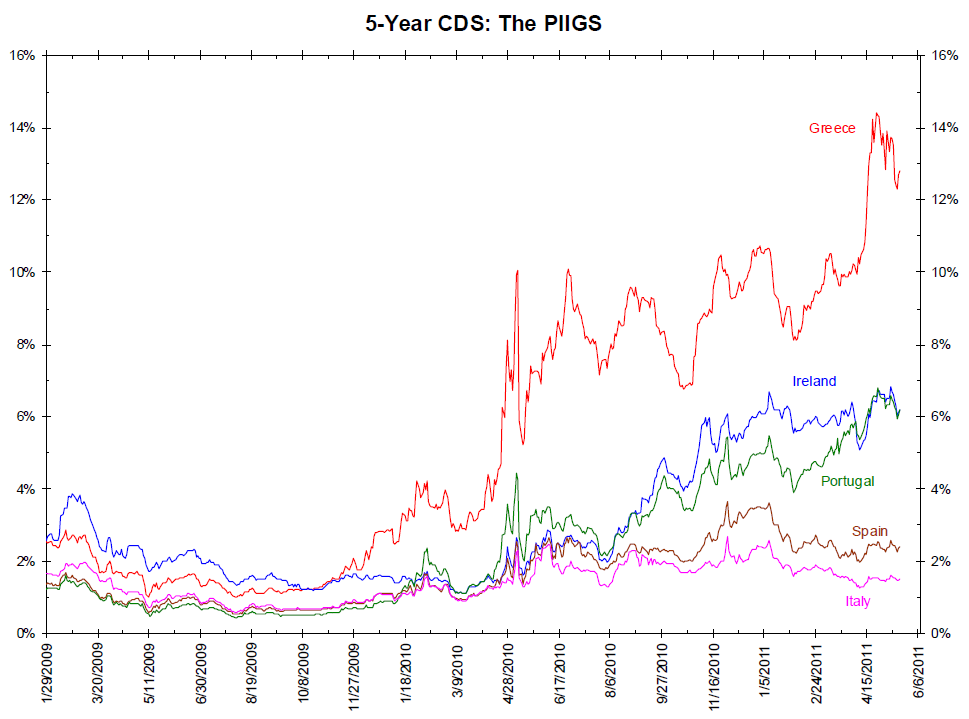
CDS: Have You Seen the Little PIIGies . . .

By Anna W

. . . crawling in the dirt, and for all the little piggies, life is getting worse ! Credit Default Swaps of the Portugal, Ireland, Italy, Greece and Spain:
>
click for larger piig chart


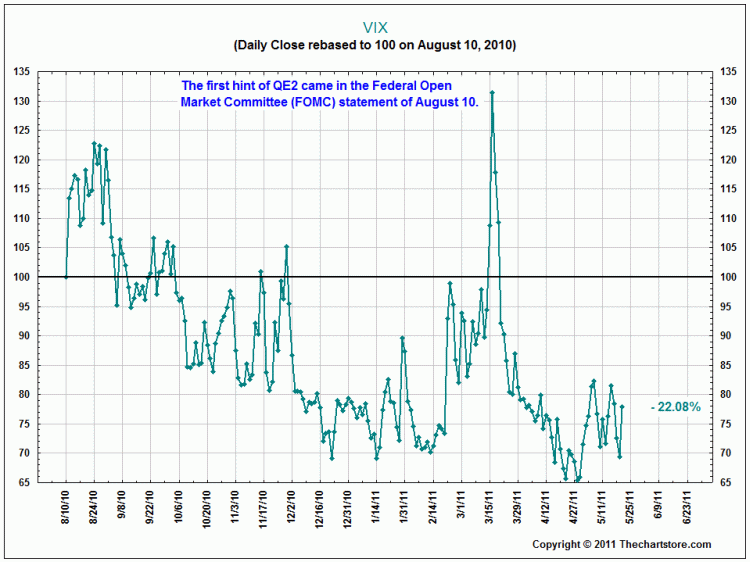
A Look at Volatility Index (VIX) Since QE2 Began

By Anna W

Since QE2, Volatility has been falling.

As the fascinating chart below from Ron Griess shows, the volatility of markets, post Flash Crash was drifiting lower until the modest sell off in March 2011 sent the VIX spiking.
>
click for larger chart


See the original article >>

Will the US Dollar Finally Break Its Long-Term Downtrend?

by Bespoke Investment Group

While the dollar has rallied nicely off of its lows over the past month, it hasn't done much to change global sentiment that the currency will continue to trend downward for the foreseeable future. But how does the currency look from a technical perspective? Below is a one-year chart of the US Dollar index. As shown, the index recently broke through the top of its short-term downtrend channel, but it still has a bit farther to go before breaking above its long-term downtrend channel. A few more days worth of gains and it will get there though.


See the original article >>

Seven factors that drive Chinese gold demand

by Commodity Online

China is on a gold drive and it has overtaken India as the world’s largest purchaser of gold at 90.9 million tons in gold bars and coins for Q1, 2011. This is up 123% from 40.7 tons last year for the same period. India meanwhile has purchased only 85.6 tons of gold this year.

There are seven factors that drive Chinese gold demand, according to the recent World Gold Council Report:

Culture: China has a golden culture and gold buying and gifting is an integral part of the same. When a child is born, it is customary on the part of Chinese people to gift the newborn with gold. On birthdays, people gift gold and New Year and weddings are opportunities to splurge on gold. Gold in China is considered to bring good luck and is touted as the colour of emperors.

Hedging: Y-O-Y increase of 11% in Q1 global gold consumption is attributed to investment demand, and gold being a preserver and enhancer of wealth is used as a hedge against inflationary wealth loss. The same is the case with China. Chinese view gold as an investment and a hedge against inflation.

Global uncertainty: Gold forms only 1.6% of China’s total wealth reserves. There is a possibility that People’s Bank of China (PBOC) would buy more gold, given the uncertainties prevailing in the planet. This includes the MENA (Middle East North Africa) unrest.

Investment diversification: With liquidity flowing into China, people fear that certain asset bubbles have formed especially in the real estate sector. The Chinese government is sparing no efforts in taming the scenario and maintaining normalcy. In this regard, a number of measures have been initiated by the government to curb excessive rise in property price. This has made other asset classes to have better investment appeal. Gold is one among them.

Advisory: With the dollar losing its sheen subsequent to the QE schemes, Chinese economists like Li Yining are calling for increased gold purchases and improvement in gold reserve figures. This is another factor driving up gold demand in China.

Institutional investment: Chinese institutional investors like China Investment Corporation (CIC) are allocating more money into gold. Capital preservation and not speculation drives the institutions, records World Gold Council.

Prosperity: The World Gold Council also says that with the reforms taking root in China, and economy getting accelerated, the disposable income with Chinese middle class is also going up. In a decade, the country may witness double the gold demand. 75 million households in China with an annual income of more than $4300 per annum would be here by 2015. The figure was 15 million in 2005. Household savings would also triple in the period between 2005 and 2015, statistics say.

Meanwhile the same report indicates demand destruction in gold jewellery in US. US purchased only 20.5 tons of gold which is a Y-O-Y drop of 10%. The high prices have reportedly kept Americans at bay.

See the original article >>

Follow Us