Tuesday, April 19, 2011

“Officialdom” Downgrades US

By Guest Author

S&P’s revision to the outlook on the United States’ sovereign credit rating to negative from stable this morning provoked a wide range of reactions. Not terribly significant in the sense that the outlooks on issuers’ credit ratings are revised up and down by the ratings agencies every day, and not terribly significant in the sense that the markets didn’t move all that much, the revision has nonetheless touched a nerve. Why?

For starters, it is the first admission by what I call “officialdom” that the means by which we extricated ourselves from the debt deflation of 2007-09 carry negative consequences. Who knows if the big swings in the market are caused by shifts in the dominant narrative or whether the narrative shifts in response to the swings in the market, but either way today’s action by S&P introduces a new narrative into the mix. This crisis isn’t over; it’s just entered into a new phase. This was never a mere cyclical recession anyway and now we have a choice: tighten our belts to preserve our preeminent financial standing in the world, or roll the dice on further policy accommodation at the risk of the a debilitating, Greece-like implosion.

That’s a far cry from the present dominant narrative which goes something like this: Short-termism of the kind displayed during last December’s “budget compromise” is irresponsible and will cost us dearly at some point, but it also symbolizes policymakers’ desire to do “whatever it takes” in the short term in order to keep this recovery going. Don’t fight these policymakers – at least, not until after the 2012 elections.

One of these narratives is bearish for financial asset prices and one of them is bullish. No prizes for guessing which is which.

Secondly, should an actual downgrade of the U.S.’s issuer rating to AA+ materialize, and should it be followed by downgrades by Moody’s and Fitch, there are all sorts of question marks about what kind of friction would result from institutional rigidities. For example, many institutions around the world have mandates to invest certain percentages of their funds in AAA securities. Presumably, downgrades by two or three of the agencies would spark a good deal of selling by those institutions.

What about Treasuries’ hypothecation value? If they’re not AAA anymore, would they be accepted as collateral in the repo market on the same terms that are offered today? Or, would extra collateral need to be posted – or would the interest rate charged need to rise? What effect would this have on liquidity, on the very “money-ness” – to borrow Doug Noland’s term – of Treasury securities? Male model Derek Zoolander once said, “Water is the essence of wetness, and wetness is the essence of beauty.” Likewise, 100% hypothecation value is the essence of risk-free, and risk-free is the essence of moneyness. In Minskian terms, a decline in the moneyness of Treasuries would make it more difficult for levered entities to “make position” which in turn would make the financial system more fragile, more susceptible to crises.

I’ll go one step further: this revision, this oh-so-minor revision, is in fact a policy tightening. Despite the fact that several additional steps would need to be taken by the ratings agencies before any of these liquidity difficulties came to pass, I believe that the shock of today’s announcement amounts to a more significant policy tightening than that which will occur in June when the Fed ends QE2. The end of QE2 is part of a carefully prepared script and therefore will have no real impact on market participants’ behavior (by design). Besides, quantitative easing produces diminishing returns (it puts cash assets on banks’ balance sheets, enhancing their ability to make position, but relaxed FAS 167 guidance has already alleviated any difficulty in making position by absolving the really bad assets from mark-to-market accounting) which means that ending QE2 will not be significant in the context of financial sector liquidity.

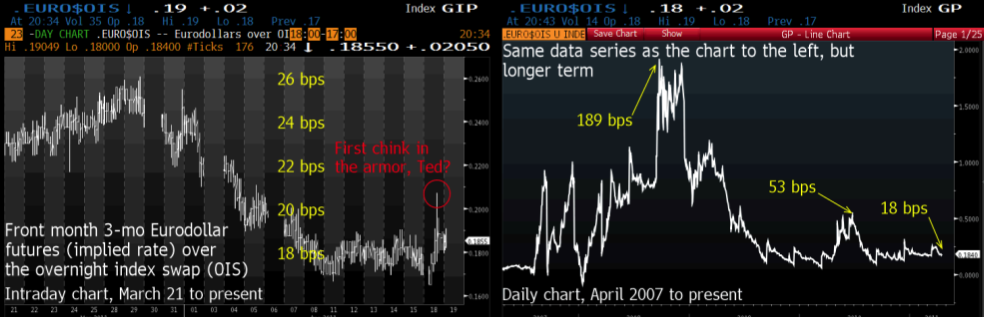
Check out the chart below which shows the implied yield difference between 3-month Eurodollar futures and the 3-month overnight index swap (a proxy for interbank lending risk) on an intraday basis going back about a month. It shows that the yield difference spiked about 3 basis points higher on the heels of S&P’s announcement this morning.
>
>
It’s not an insignificant move, that 3 basis point spike, but the chart above on the right puts it into context. If I’m right and S&P’s announcement does in fact constitute an actual policy tightening, it either hasn’t hit full bore yet or it’s simply a very slight tightening. This context is important because even the cleverest theories amount to nothing if there’s no follow-through in the markets.

However, if, after the political and financial establishment gets done telling us all to quit our worrying and that today’s action by S&P has no practical significance, traders get to thinking about the very real implications this action has for financial instability in the future (and traders are forward-looking, right?), we might be looking at a downside catalyst for risk assets including stocks.

At this point, I want to soak up any and all arguments the conclusion of which is that S&P’s revision is not significant before revising my own near-term bullish stance. It was definitely an unnerving day, though, wasn’t it? Between that and the European difficulties (the True Finns!), it’s a testament to traders’ undying optimism that the market managed to pare nearly half of its losses in the afternoon.

Y2K = QE2

By Erik Swarts

History shows us that each bubble needs a tragic muse.

The Nasdaq Bubble had both the allure and fear of a new millennium. Y2K was on one hand a software and infrastructure motivator, as well as a philosophical romance; drunk on the notion of a new era that would transform all that we understood and perceived about the world through technology.

With gold and silver today, it’s just as manic, evermore disturbingly romantic – and really just plain dark.
It’s a bubble with a raging mood disorder.

At once both manic and depressive. Currency debasement! Manipulated markets! The experiment that was the fiat monetary system is over! Raging inflation is coming!
Protect yourself!

In the end, the inflation debate is a matter of relativity and coordination. We are not the only ones intervening in the marketplace with a monetary policy stopgap approach – it is entirely a global effort. And while it does make for a juicy soundbite (that is typically 9 times out of 10 either politically motivated or borne out of ones position in the market), there’s a lot less hyperbole and a great deal more logic behind the Feds efforts than most give them credit for. Here’s the byline for the Financial Crisis for Dummies softcover:

The private sector stopped spending – the government filled the gap. 

And although it is quite true that our current fiat monetary system is inflationary over the long run, the degree of distortions that are currently being reflected in both the precious metals market, the commodities market and the currency markets – likely do not reflect a representable correlation to inflation today, but more of a serious bubble in the commodities sector. I believe this minority opinion will prevail in the not so distant future as we emerge from the crisis relatively intact, albeit bruised nonetheless.

FT/Alphaville had a very interesting piece detailing the work from the boys at Deutsche Bank – that succinctly describes what I believe has been a massive misinterpretation by the risk trade into the commodity and currency markets.
“The $2 trillion in purchases have literally gone down a black hole. Required reserves haven’t been required to increase and the Fed reserve add has literally simply been hoarded as cash. Excess reserves at the Fed have subsequently soared by the same. In short, QE has been a spectacular disappointment in its impact on bank lending, whether via whole loans or securities. It was as if the banks conducted the very sterilization of QE that many thought perhaps the Fed should do to “contain” inflation expectations.
Risky security prices have risen since QE but not Treasuries, the main instrument of QE2. Yet banks’ balance sheets have gone sideways. Effectively investors have marked asset prices higher by the Fed from an investor simply triggered a series of deposit for security switches through the investor base with banks never making an additional loan. This is consistent with a greater concern for risky asset post QE2 end, than Treasuries. The danger for investors is that they confuse the result of higher asset prices as reflecting excess liquidity rather than “irrational” exuberance given that actual liquidity (as broadly defined by the banking system) hasn’t gone up at all.
- Dominic Konstam and Alex Li, Deutsche Bank”
While I agree with their descriptions of a rather large miscausation within the risk trade, I disagree with their disappointment with bank lending. Once critical mass arrives in the economy – bank lending will resume a glide path towards normalcy. Post financial crisis, both the private and government sectors perceive critical mass through the lens of the stock market – not lending. To their detriment, economist always seem to forget the psychological perspective to the argument. It is why accurate market forecasts are a hybrid discipline of both art and science.

From Lemons to Lemonade

Personally, I would never advocate the path that the Fed and Treasury have embarked on in the last 40 years. However, to the best of his ability, Bernanke has utilized the tools at his disposal to mitigate the collateral damage to the broader financial system.

I like Ben Bernanke, I really do.

There, I said it.

Don’t hate me because I chose the unpopular position – it’s an inherent character trait.

During these contentious times, I think he is about as balanced – without ego, smart and creative as we could hope for in a central banker. The pundits will always use every opportunity to argue his ignorance towards what they perceive as practical banking methods and how they should function during ideal market conditions. They will cite example after example, such as his downplay of the subprime crisis right before the broader credit crisis erupted, as proof that he is unfit to lead the worlds largest economy. And although he surely deserves criticism towards aspects of his communications and transparencies with the market, the net result of his bold monetary approach has been a system that avoided catastrophic failure and recovered much faster than almost anyone predicted.

And while I would never willingly choose the To Big To Fail paradigm, it has facilitated the efficiency and efficacy that the Fed could respond to illiquid market conditions. Granted, the crisis was magnified by the To Big To Fail model, but the rapid recovery was also a direct result of their size and scope and considerable bandwidth within the global economy. Dealing with only a handful of mega banks with very similar infrastructures is infinitely easier to navigate and dispense stopgap capital, then thousands of separate and smaller entities with disparate business models and means of capital conveyance. No doubt about it, it’s a house of cards in the right market conditions, but it also can be utilized to neatly reflate a deflationary market environment in a crisis.

With that said, there can be some rather large side effects of operating capital within such a dynamic system – even if they are just figments of the markets imagination (see below).

The Bubble that is Silver

Since I last checked in on the state of the precious metals market (a whopping three weeks ago – and 400 posts before Silver Bubble Mania hit the blogosphere), the silver bullet train has continued its ascent higher – in what I like to refer to as its quest for its ephemeral peak.

It’s not a matter of if, it’s a matter of… yada, yada, yada – you’ve heard it all before.

It is a very crowded topic to broach these days. Definitely a bit disconcerting from a contrarian perspective, if you are positioned on the opposing side of the plate. You may ask, why would anyone ever willingly step in front of a train such as silver?

(thick BBC english accent)

Purely Ego.

I’m smarter than the market; I’m smarter than you; therefore…(insert tragic personal anecdote here). It’s typically a widow maker towards your net worth. Trust me.

We all know, as so eloquently stated years back by the godfather of our modern fiscal debate, John Maynard Keynes, “that market’s can remain irrational longer than one can remain solvent.”.

Truer words have never been spoken.

With that said, there are a number of reasons – both fundamentally, technically and psychologically speaking that silver’s historic rise is running out of motivational propellant. The crescendo of central bank fedspeak (previously described here) towards quantitative easing exit strategies and inflation concerns has reached a dissonant pitch in the market. What’s the old market axiom, “Buy the rumor, sell the news”? Well the news flow has been absolutely tidal towards inflation expectations as of late.
Internationally, the drumbeat from China has been as steady as Ringo’s right foot in Come Together. They have raised rates twice since October, and just yesterday, their central bank governor declared they would continue to raise rates, “for some time”. Meanwhile, the ECB has eschewed Bernanke’s willingness to give the markets the benefit of the doubt and have followed rhetoric with action.

Domestically, the inflation debate has intensified, and although the governing powers that be have yet to align a concerted approach towards addressing inflation expectations – the wheels are in motion and proceeding along that path.

Two days ago, it was Fed Governor Plosser declaring his concern with “choreographing” an exit strategy towards quantitative easing. Moments before, it was Federal Reserve Bank of Richmond President Jeffrey Lacker stating his concerns with the, “need to heed the lesson of the last recovery that inflation is capable of rising even if the level of economic activity has not returned to its pre-recession trend.”.
First rhetoric then action.

Technically speaking, the silver market is as exuberant as the Nasdaq was in March of 2000.
I also like to look at the monthly charts as an apples to apples comparison of these two historic bubbles. For comparison, I bracketed both the Y2K hysteria trade in the Nasdaq and the current QE2 trade in silver.

The RSI, MACD, Full Stochastics and CCI have all exhibited very similar artifacts of manic market conditions. Namely, a slope as steep as the current monthly MACD for silver is almost always immediately followed by only one phenomenon.
Exhaustion.
Not a correction or consolidation of trend.

Exhaustion.

The Nasdaq had Y2K as its tragic muse. Silver, and by extension the entire commodity sector, has QE2. It’s ending in one month. Best look for a seat before the music stops.

Just remember, Y2K=QE2

See the original article >>

Monday, April 18, 2011

Try For Free Our Galaxy Combined Portfolio Systems +23.36% In 2011

Nella sottostante tabella sono raffigurate le equity line mensili dei trading systems che compongono il nostro portfolio systems Galaxy ed il riassunto MTM dell’operatività dal Novembre 2009. Galaxy chiude con un ottimo risultato anche il mese di Marzo, dopo un equivalente risultato nel mese di Gennaio e Febbraio, portando a 23.36 % la performance del 2011. Inoltre, nel mese di Aprile sta guadagnando il 6.00 % c.a. Quello appena chiuso è il sesto risultato utile consecutivo a livello mensile dopo la breve pausa alla fine dell’estate dello scorso anno. L’equity continua a svilupparsi in maniera armonica mantenendo un’inclinazione positiva e costante grazie all’elevata diversificazione all’interno del portfolio. I risultati storici di Galaxy Portfolio System sono disponibili ai seguenti link: http://www.box.net/shared/static/nz7u0ztnbp.xls, http://box.net/shared/b9cg6kfa6s. I risultati dei singoli trading systems sono a disposizione al seguente link: http://www.box.net/shared/5vajnzc4cp.

Richiedi la demo gratuita di 30 giorni di Galaxy Combined Portfolio Systems

In the table below you can see the monthly equity line of the trading systems that make our Galaxy portfolio systems and the MTM performance summary since November 2009. Galaxy ends with a good result also the month of March, after a similar result in the month of January and February, bringing the performance to 23.36 % in 2011. Moreover, in the month of April is gaining 6.00 % c.a.. One just closed is the sixth consecutive positive months after the brief pause at the end of the summer last year. The equity continues to grow in harmony while maintaining an upward slope and steady thanks to high diversification within the portfolio. Historical results of Galaxy Combined Portfolio System are available at the following links: http://www.box.net/shared/static/nz7u0ztnbp.xls, http://box.net/shared/b9cg6kfa6s. Historical results of single trading systems are available at the following link: http://www.box.net/shared/5vajnzc4cp. 

Request a free demo of 30 days of Galaxy Combined Porolio Systems

Galaxy-Risultati-Marzo_thumb4

Equity Line Trades, Giornaliera e Mensile di Galaxy / Trades, Daily and Monthly Galazy Equity Line

Galaxy-Trades_thumb Galaxy-Time_thumb Galaxy-Mensile_thumb Logo Demo_thumb[2]

Performance MTM Mensile di Galaxy Portfolio System con un capitale iniziale di $ 200.000
Monthly MTM Performance of Galaxy Combined Portfolio System with $ 200K initial capital


Jan
Feb
Mar
Apr
May
Jun
Jul
Aug
Sep
Oct
Nov
Dec
2009


1.19 %
2.90 %
2010
(4.28 %)
24.49 %
2.99 %
1.76 %
15.62 %
4.35 %
10.60 %
(0.41 %)
(4.73 %)
1.75 %
12.80 %
1.50 %
2011
7.54 %
7.75 %
8.06 %


Material in this post does not constitute investment advice or a recommendation and do not constitute solicitation to public savings. Operate with any financial instrument is safe, even higher if working on derivatives. Be sure to operate only with capital that you can lose. Past performance of the methods described on this blog do not constitute any guarantee for future earnings. The reader should be held responsible for the risks of their investments and for making use of the information contained in the pages of this blog. Trading Weeks should not be considered in any way responsible for any financial losses suffered by the user of the information contained on this blog.

China may be poised for 'aggressive' sugar buying

by Agrimoney.com

"Aggressive" buying by China, in the face of a domestic supply squeeze, could come to the aid of sugar futures, which looked set to extend their losses on Monday after hefty losses against an expiring contract.
Futures in the sweetener lost more than 1% on both sides of the Atlantic, paring early gains, after the London futures exchange confirmed deliveries of 375,150 tonnes against the expiring May white sugar contract.
The figure, equivalent to 7,500 lots, compares with, for instance, the 126,500 delivered against the December contract.
The decline was also attributed to a reduction by Standard & Poor's, to negative from stable, on its outlook for America's credit rating, signalling a downgrade may be in the offing, and against a continuing backdrop of optimism over production from Thailand, the second-ranked sugar exporter.
Thai production was on Monday estimated at a record 9.0m tonnes, leaving sufficient capacity for exports at an all-time high of some 6.2m tonnes.
"The Thai crush continues to go from strength-to-strength," Luke Mathews at Commonwealth Bank of Australia said.
'Pent-up demand'
However, the fall in sugar prices on futures markets, and in the cash market in Brazil, the top exporting country, has not been echoed in China, the second-ranked consuming country, which has suffered successive seasons of disappointing output.
Prices in some provinces have now topped 50 cents a pound, despite efforts by authorities to cool the market by releasing supplies from state reserves, most recently in February, when more than 150,000 tonnes were sold, at an average price of 7,423 yuan a tonne, equivalent to about 51 cents a pound.
"Market conditions look to be evolving where China is likely to buy sugar aggressively from major importers over the next six months," Australia & New Zealand Bank said, terming China's sugar supply "clearly an issue".
"With China in strong need to replenish domestic supplies and ease the risk of further inflationary pressure from higher domestic sugar prices, China's pent-up demand for sugar imports is strong."
Critical gap
The extent of the buying "could be as high as 1.8m tonnes over three-to-four months, providing some support to global sugar prices through this period", ANZ added.
The comments follow a forecast from Societe Generale that China's sugar imports, which rose to 1.5m tonnes in 2009-10, could "soon increase dramatically", reaching 3m tonnes a year.
The bank noted that a discount of 20 cents a pound of New York futures prices compared with Chinese futures prices triggered buying in the second half of 2010.
'Risk premium'
Separately, Rabobank lowered to 26.0 cents a pound, from 29.0 cents a pound, its forecast for New York sugar prices in the April-to-June quarter.
While highlighting improved hopes for crops in Brazil and Thailand, the bank said that price falls would be "tempered" by weather worries for the northern hemisphere beet harvest.
"A risk premium is likely to remain in the market at least until the beet harvest this fall, as the sugar market still remains just one major weather stock away from a significant deficit," Rabobank said.
Sugar for May stood 2.1% lower at 24.07 cents a pound in New York at 15:00 GMT, with London's August white sugar contract, fresh in the spot position, stood down 1.7% at $622.00 a tonne, the weakest for a near-term lot for six months.

See the original article >>

Crops more popular than energy among investors

by Agrimoney.com

Agricultural commodities have proved significantly more popular than energy among buyers of exchange-traded products, despite the high-profile threats to oil supplies and Japan's nuclear reactor crisis.
Exchange-traded commodities and funds saw inflows of more than $600m in March, the fifth successive monthly increase, analysis by Societe Generale showed.
However, investors pared exposure to exchange-traded energy products by more than $500m, despite the month bringing continued tensions in the Middle East and North Africa, which bought New York oil prices to a two-year high during the month.
March also witnessed the Japanese earthquake and tsunami which, in leaving the Fukushima nuclear plant leaking radiation, provoked expectations of an improvement in demand for gas as a power source, lifting natural gas futures too.
Rebalancing act
On agricultural commodity futures markets, meanwhile, many investors reduced exposure last month, with grains saved from notable losses by a March 31 report which revealed US stocks significantly lower than investors had expected.
New York sugar prices fell more than 15% over the month.
Societe Generale attributed the "surprise" switch away from energy prices to "profit-taking or portfolio rebalancing... either to lock in some profits after a quarter of excellent performance and/or bring energy closer to target allocation".
Despite the sell-down, investors in exchange-traded products, which aim to offer an inexpensive, easy and liquid way of investing in assets such as commodities, held $12.5bn in energy, more than their $9.4bn exposure to crops.
Kansas wheat shunned
On futures markets, a gain in investor interest in agricultural commodities after the March 31 US inventories reversed in the week to April 12, regulatory data released late on Friday showed.
Managed funds, a proxy for speculators, cut their net long exposure – that is long positions over above short holdings – in the main US-traded agricultural commodities by 21,932 lots below 950,000 lots over the week, Rabobank calculated.
Net long interest in Kansas wheat suffered a notable decline, down by 1,500 lots to less than 50,000 contracts, as rain forecasts lifted hopes for the rain-deprived US hard red winter wheat crop.
Soybean interest dropped to its second lowest point since June, thanks to "weak Chinese demand [for the oilseed] coupled with stabilising crop conditions in South America", Rabobank said.
Corn beats the trend
However, managed funds lifted net-long exposure to Chicago corn, helping the grain to a record price over the week.
"It was the case of another week, another 30,000 contracts added to speculative net length," Australia & New Zealand Bank said.
"Since [late March], speculative net long positioning in corn has rebounded from 226,000 contracts to 297,000 contracts."

Sector Performance In Response to S&P Outlook Downgrade

by Bespoke Investment Group

Given the history of the ratings agencies, it's pretty sad that the market is still forced to react to anything they say. At any rate, below we highlight the impact that today's US outlook downgrade by S&P is having on sectors at an hour into the trading day. As shown, the Energy sector is getting hit the hardest with a decline of 2.40%, followed by Industrials (-1.96%), Materials (-1.96%), Technology (-1.84%), and Consumer Discretionary (-1.64%). The defensives are unsurprisingly holding up the best. The Utilities sector is only down 0.48%, while Consumer Staples is down 0.70%. The S&P 500 as a whole is down 1.58% on the day at the moment. Let's hope this looks better by the end of the day given the reason for the decline.


See the original article >>

Follow Us