Sunday, September 14, 2014

America's Poor Have Never Been Deeper In Debt

by Tyler Durden

Ever since the Lehman bankruptcy, one of the main reasons given by the perpetual apologists about why i) the so-called "recovery" has been the worst in US history and ii) the Fed has been "forced" to conduct 6 years of wealth transferring policies, boosting the stock market to all time highs and creating a record wealth split in US society between the super rich and everyone else (one that surpasses even that seen during the roaring 20s) is that the US consumer, scarred by the economic crash, has been rushing to deleverage and dump as much debt as possible.

There are two problems with that story:

  • First, as we first pointed out in 2012, US households are not deleveraging, they are defaulting, a huge difference which goes to motive and intent, and shows that instead of actively paying down debt households are instead loading up on as much debt as they can, which at some point they simply stop servicing (for a detailed analysis of this disturbing trend, read our series on the student loan bubble).
  • Second, when it comes to the poorest quartile of US society, some 14 million people, it is dead wrong. In fact, as the Fed's triennial Survey of Consumer Finances, released last week showed, America's poorest have never been more in debt!

As usual, the full story is one of nuances. As Bloomberg reports, as a result of the first point - mass defaults - US household debt has indeed declined on an average basis. Indeed, average debt burden for all families stood at about 105% of pretax income in 2013, down from about 125% in 2010 and the lowest level since the 2001 survey.

Of course, since economists are unable to grasp the difference between default and deleveraging, one look at the chart above gives them reason for hope. As Bloomberg summarizes:

The improved finances, along with more recent signs that consumers are feeling comfortable about borrowing again, has given some economists cause for optimism: The more progress households make in getting out from under their debts, the logic goes, the greater the chances that renewed spending will boost growth.

In reality, the "improved finances", namely those tens of trillions in financial assets that have been artificially reflated courtesy of the Fed's monetary policies, have benefited the tiniest sliver of US society - about 1% or less depending on whose calculations one uses. Everyone else, the bulk of US society, was forced to simply stop paying down their credit card and thus "delever."

But for a good perspective of what the part of society that is at the opposite end of the 1%, namely those 14 million or so Americans who comprise the poorest quartile of households, look no further than the chart below, which shows just what Americans are really doing up until that point where default does equal "deleveraging", even if it means loss of access to all credit for a period of several years:

From Bloomberg: "The poorest quartile of families is the only group that owes more than it owns. Thanks to declines in the value of assets, the group's average leverage ratio -- debt as a percent of assets -- increased to 137.5 percent in 2013, the highest on record since the survey started in 1989."

And there you have it - not only is America not actively delveraging, on the contrary, it is loading up on as much debt as it possibly can (or banks will allow it judging by the decline in mortgage-type debt, driven mostly by supply constraints and qualification factors) until the band snaps and in a perverse circle of illogic, releveraging becomes default becomes deleveraging.

Bloomberg has some ideas here, including commenting on the one observations we have been making since 2011: the relentless rise in installment debt, i.e., student and car loans:

There are various possible explanations for the poorest families' financial predicament. Incomes have declined, making debt burdens look worse. Some previously wealthier people probably migrated into the group as the value of their homes fell below what they owed on mortgages. More ominous is a steady increase in installment debt, a category that includes both student and auto loans -- areas that have recently seen a lot of questionable lending to lower-income borrowers.

Bloomberg's conclusion:

Whatever the drivers, the data suggest that the 2008 crisis and subsequent economic malaise have left a troubling legacy: A group of the poorest families, numbering roughly 14 million, whose precarious finances make them vulnerable to shocks and limit their ability to contribute to future growth. That's hardly a strong foundation for a healthy recovery.

But mass "deleveraging" is good, they said. It means tons of pent up releveraging and recovery, they said...

While the lying is understandable - after all confidence must be rebuilt at all costs - what is worse is that the Fed believes it can withdraw from QEasing because it is convinced that US society as a whole is able to take on more debt, when in reality a record number of Americans are locked out of the debt market (due to recent or imminent defaults) for years. As a result the Fed's entire logic for pulling out of the market is based on an epically flawed assumption. Which is why, as we explained back in late 2013, we give the Fed a few months of POMO-ess shock and awe for the S&P500 mixed with fears of what a rate hike will do to the market, pardon economy, before the Untaper and the reZIRP fully enter the financial lexicon.

Finally, while we have shown this chart in the past, here it is again. It really does explain everything.

See the original article >>

Will the Fed Change Course?

by oldprof

(09/14/14) After a number of meetings where the FOMC announcement merely confirmed widespread expectations, this week’s result may be different. I expect everyone to be wondering, Will the Fed change course?

Prior Theme Recap

In my last WTWA I nervously suggested that there would be a surprising focus on individual stocks rather than macro factors. This proved to be a good call, and I even had the right reasons: Apple announcements, Alibaba, and a dearth of economic news. The competing story was the surprising dollar strength at the end of the week.

Feel free to join in my exercise in thinking about the upcoming theme. We would all like to know the direction of the market in advance. Good luck with that! Second best is planning what to look for and how to react. That is the purpose of considering possible themes for the week ahead.

Calling All (Young) Writers

The Financial Times and McKinsey and Company have joined to offer the Bracken Bower Prize for the best proposal for a book on the challenges and opportunities for growth. A prize of £15,000 will be given for the best book proposal. It is also a good way to attract a publisher for your idea. Entries close on September 30th. More information is available here.

This Week’s Theme

The scheduled highlight of this week (despite some competition from Scotland) is the FOMC policy announcement. This is one of the meetings where the Fed updates individual and consensus projections and provides additional transparency with a press conference from the Fed Chair.

The result of the modern transparency efforts is often additional confusion!

Here is what you need to know in advance:

  • The forward guidance language is likely to change. Even the doves on the Fed want to communicate more data dependence rather than a calendar-based forecast. Leading Fed expert Tim Duy explains why this change would be helpful:

    The trick is to change the language without suggesting the timing of the first rate hike is necessarily moving forward.  The benefit of the next meeting is that it includes updated projections and a press conference.  Stable policy expectations in those projections would create a nice opportunity to change the language.  Moreover, Yellen would be able to to further explain any changes at that time.  This also helps set the stage for the end of asset purchases in October.  A shift in the guidance next week has a lot to offer.

  • Experts at major firms vary widely in their expectations. Calculated Risk has a good summary.
  • Alan Greenspan spoke to insurance company executives, explaining nine negative points about the economy. He emphasized that none could be easily fixed. Focusing on the topic where he is most expert, here was his take on the upcoming turn in Fed policy:

    We have to taper at some point, and things will only turn around once we see commercial and industrial loans tease that money out of the federal system and paid out to the commercial markets. This is a necessary condition for inflation. It is not happening yet. But it will. And when it does, Greenspan says, it will surprise us with how quickly it moves. Be prepared.

Will the Fed change course? What will be the market reaction?

As usual, I have a few thoughts to help with that question. First, let us do our regular update of the last week’s news and data. Readers, especially those new to this series, will benefit from reading the background information.

Last Week’s Data

Each week I break down events into good and bad. Often there is “ugly” and on rare occasion something really good. My working definition of “good” has two components:

  1. The news is market-friendly. Our personal policy preferences are not relevant for this test. And especially – no politics.
  2. It is better than expectations.

The Good

There was a lot of very good news, supporting the general thesis of economic strength.

  • Q2 GDP growth is getting revised higher. It is “massive” according to this article (Goldman’s estimate is now 4.7%) and it is spilling over to Q3 estimates.
  • Deficit reduction in the US. The combination of very slow growth in spending and a brisk increase in revenues has reduced the deficit. Scott Grannis calls the 3% gap “very manageable. His analysis includes this helpful chart:

Receipts and Outlays

  • Michigan sentiment beat expectations. Doug Short always has a fine analysis of the confidence data and his chart would be a great example for a college class or textbook on data analysis. He shows the data series, the average level, the relationship with GDP and the clear ties to recessions — all in one attractive chart.

dshort michigan

  • Retail sales met current expectations and beat estimates if you consider revisions. The market, especially fixed income, saw this as economic strength, so that is how I am scoring it. Retail was weak in Q1 and the Q2 rebound was generally disappointing. Last week’s report was a welcome sign of strength. Doug Short’s analysis explains the significant and frequent revisions. Steven Hansen at GEI sees the data as mixed. Bespoke has an interesting angle, with an emphasis on gasoline prices. When fuel prices were spiking, some observers noted that this artificially inflated retail sales with consumption that was actually negative for the economy. Now that we are seeing fuel price decreases it is important to remember that this is a drag on retail sales. Nick Timiraos at the WSJ sees lower gas prices translating quickly into other spending.

Gas Prices 091214

The Bad

There was also some negative news, some of which is difficult to translate into a market effect.

  • Ukraine conflict turns worse. As I write this, the apparent progress toward a cease fire (noted last week) has ended. Another Russian convoy is entering Ukraine without permission. Shots have been exchanged. Also, the Treasury is expanding sanctions.
  • China’s imports have stalled according to the analysis from Dr. Ed Yardeni. Imports are an important indicator of economic strength, so the data are worth following. Dr. Ed is suspicious of the report, however, partly because the data come out so promptly — much faster than other countries. We would all like to know about the Chinese economy, but it remains challenging to follow. For what it is worth, here is the Yardeni chart:

yardeni china imports

  • Labor force participation might not be able to increase much according to recent research by Fed economists. I covered the significance of this issue in a recent WTWA post featuring employment. If there is little potential for increase in LFP, then we are closer to increased wage costs than Fed Chair Yellen expects. Max Ehrenfreund of The Washington Post has a good story and this chart:

labor-force-chart

  • Scottish secession worries. The chance of a “yes” vote on Scottish independence seemed remote a week ago, but the polls have changed dramatically. Here is the betting line via The FT – negative as of Thursday, but very fluid. Here are the implications for investors.
  • Dollar strength is a negative for some stocks. Mohamed El-Erian explains the underlying dynamics, with a nod to the Scottish jitters. The relationship between the dollar and stocks seems to involve dramatic “regime” changes. There are periods of risk off/risk on where the dollar has an inverse correlation with stock prices. The long-term relationship shows stronger stocks aligned with a stronger dollar. Brian Gilmartin does a first-rate job of translating this trend into impacts on specific stocks. Check out his analysis. Here is the key quote:

    A strong dollar benefits importers and penalizes exporters, all other elements being equal. I wish I could access the data, but I would guess that, after 2008, and the growth of BRIC’s and such in the last decade, of total US GDP, the US is a larger “net exporter” than say in the late 1990’s when the Asian Tigers collapsed, so prolonged strength in the dollar could have a net-net negative impact on SP 500 earnings over time, if the strength in the dollar is persistent.

The Ugly

Our “ugly” list for the last few weeks remains unfortunately accurate. We had headline news from all conflicts with plenty of violence and death competing for our attention. The Ebola crisis, cited a few weeks ago, continues to worsen. We may have to accept these as the “standing ugly list” so that we can consider new issues. These are all very ugly, but I want this category to be open to new entrants. If I missed something this week, please raise it in the comments!

The Silver Bullet

I occasionally give the Silver Bullet award to someone who takes up an unpopular or thankless cause, doing the real work to demonstrate the facts.  Think of The Lone Ranger. No award this week. Nominations are welcome.

Quant Corner

Whether a trader or an investor, you need to understand risk. I monitor many quantitative reports and highlight the best methods in this weekly update. For more information on each source, check here.

Recent Expert Commentary on Recession Odds and Market Trends

Doug Short: An update of the regular ECRI analysis with a good history, commentary, detailed analysis and charts. If you are still listening to the ECRI (three years after their recession call), you should be reading this carefully. Doug includes the most recent ECRI discussion concerning continuing economic weakness in Japan. Doug covers the possible implications for the US.

Bob Dieli does a monthly update (subscription required) after the employment report and also a monthly overview analysis. He follows many concurrent indicators to supplement our featured “C Score.”

RecessionAlert: A variety of strong quantitative indicators for both economic and market analysis. Dwaine’s “liquidity crunch” signal played out as projected. This week he highlights his HILO Breadth index which he has designed to pinpoint bottoms and to warn of protracted corrections. Current readings imply an opportunity that usually shows up only once a year. Check out the full post for a description and charts.

Georg Vrba: Updates his unemployment rate recession indicator, confirming that there is no recession signal. Georg’s BCI index also shows no recession in sight. Georg continues to develop new tools for market analysis and timing. Some investors will be interested in his recommendations for dynamic asset allocation of Vanguard funds.

The Week Ahead

After last week’s avalanche of news, we have a more normal week for economic data and events.

The “A List” includes the following:

  • FOMC announcement (W). Taper continues, but what signal for the future of rate hikes?
  • Housing starts and building permits (Th). Any change in the sluggish housing market would be welcome.
  • Initial jobless claims (Th). The best concurrent news on employment trends.
  • Leading indicators (F). Widely followed indicator of economic prospects.

The “B List” includes the following:

  • Industrial production (M). Confirmation for the strong ISM surveys?
  • CPI (W). At some point the threat of inflation will be relevant, but it will take a few worrisome reports.
  • PPI (T). See CPI.

I am not very interested in the Philly Fed, although some follow it as the first release of data from the new month. I am even less interested in the Empire index.

The referendum on Scotland’s independence could be a wild card.

Breaking news from Ukraine and Iraq has become a part of the investment landscape. These stories are having an effect, but are nearly impossible to handicap on a short-term basis.

How to Use the Weekly Data Updates

In the WTWA series I try to share what I am thinking as I prepare for the coming week. I write each post as if I were speaking directly to one of my clients. Each client is different, so I have five different programs ranging from very conservative bond ladders to very aggressive trading programs. It is not a “one size fits all” approach.

To get the maximum benefit from my updates you need to have a self-assessment of your objectives. Are you most interested in preserving wealth? Or like most of us, do you still need to create wealth? How much risk is right for your temperament and circumstances?

My weekly insights often suggest a different course of action depending upon your objectives and time frames. They also accurately describe what I am doing in the programs I manage.

Insight for Traders

Felix remains bullish. Uncertainty is now more modest and is moving lower. Our Felix trading accounts remain fully invested. Broad market ETFs are also positive.

You can sign up for Felix’s weekly ratings updates via email to etf at newarc dot com.

Insight for Investors

I review the themes here each week and refresh when needed. For investors, as we would expect, the key ideas may stay on the list longer than the updates for traders. The current “actionable investment advice” is summarized here. In addition, be sure to read this week’s final thought.

We continue to use market volatility to pick up stocks on our shopping list. We do this because we also sell positions when they reach our (constantly updated) price targets. Being a long-term investor is not the same as “buy and hold.”

Here is our collection of great advice for this week:

Confusing politics with investing is an expensive mistake. The discussion from Tim Mullaney at MarketWatch is well worth reading for the examples. He emphasizes the mistakes from one political perspective, but he tries to make the right generalization:

The point is: Don’t listen to people who tout investments based on their politics. It’s a sure sign they lack the dispassion needed to evaluate securities and make you money.

If you or I were advisors for a political campaign we would always attack the party in power, including all of the policies. This was just as true when the GOP held the Presidency. It is fine to have strong opinions and to use those in voting and in your private discussions. Meanwhile, wouldn’t you prefer to profit no matter who is in power? That is why I recommend being politically agnostic.

Morgan Housel has a great list of things where investors should “know the difference.” Here is a good example:

You should know the difference between average and normal. You should never think “average” is what should be happening right now. The S&P 500 has gone up an average of about 9% a year over the last century. But since 1900, stocks have gone up or down more than 20% in almost twice as many years as they have gained between 5% and 10%. Nine percent is average, but chaos is normal. Same goes for valuations. They’re more likely to be swinging between some state of insanity that no one can justify than hovering near an historic average.

OK – I can’t resist providing a second oneJ

You should know the difference between a contrarian and a cynic. A contrarian knows the masses get it wrong sometimes. A cynic thinks he’s smarter than the masses all the time. 

John Woerth at the Vanguard Blog shares a list of mistakes – and also some good moves. Here is one example:

Chasing yield. One of my first fixed income investments was Vanguard GNMA Fund. I was attracted to the high absolute and relative yield and didn’t fully appreciate the principal risk that accompanied the investment. I wasn’t expecting, nor was I accustomed to seeing, the fluctuations in the net asset value of what I naively considered to be a conservative government bond fund. Experience, they say, can be a cruel teacher.

Mistake: Greed and ignorance.

Lesson: Don’t chase yield or past performance. Do your homework and have realistic expectations for the reward and risk potential of any investment that you’re considering.

Tren Griffin at 25iq has A Dozen Things I’ve Learned from Josh Brown – all good. Here is one example:

“The next time you hear someone say we’re overdue for a correction, ask them for a copy of the schedule. Unfortunately, markets are biological rather than mechanical in nature and, as such, precision in timing is nowhere to be found.” A market is more like a cat than a machine. This is what Josh is referring to when he says markets are “biological.” In more technical terms, a market is a “complex adaptive system” and for that reason trying to make short term predictions about the future is folly.  If you want to be an “active” investor I suggest a value investing approach: the occurrence of certain types of events over the long term (change in a stock price) within your circle of competence can occasionally be predicted in a way that gives you odds that are substantially better than even – but that happens rarely. When it does happen, bet big. The rest of the time, don’t bet. Accept this fact of life sooner rather than later, and you will be wealthier and happier.

Instead of worrying about market valuation, look for cheap stocks, writes Patrick O’Shaughnessy. (This was one of my themes at the SF Money Show. I know, I know. I am overdue in trying to turn this presentation into blog posts). He uses Apple’s stock as an example, with this chart:

static.squarespace.com

Some are not seeking opportunity because they are worried about possible market declines. If that is your situation, you have plenty of company. This is one of the problems where we can help. It is possible to get reasonable returns while controlling risk. You can get our report package with a simple email request to main at newarc dot com. Also check out our recent recommendations in our new investor resource page — a starting point for the long-term investor.  (Comments and suggestions welcome.  I am trying to be helpful and I love and use feedback).

Final Thought

This week brought some pushing back against the “Fed haters.” Maybe it was the extra time to muse that I highlighted in last week’s WTWA!

Here are two examples:

  1. Cordell Eddings notes that potential bond investors missed a $1 trillion return.
  2. Joe Weisenthal wrote provocatively that it might be the “final humiliation” of the Fed haters. This earned him a CNBC debate with Peter Schiff where they employed the instant scoring feature. You can watch it yourself and cast your own vote. Weisenthal wrote as follows:

    Over the last several years, anti-Fed “policy bears” have been warning about how the extraordinary steps taken to juice the economy would end in disastrous.

    Some predicted surging interest rates. Some people predicted runaway inflation. And a lot of folks said that the Fed was murdering the dollar.

    Well, none of that has happened. And not only that, the dollar is one of the strongest currencies in the world.

The CNBC debate, where Schiff scored a narrow victory, tells us more about the audience than the merits of the arguments. There are two distinct time frames for consideration.

  • In the short-term, trader time frame there will be a jump in interest rates, including the long end of the curve, with any hint of an accelerated change in Fed policy. The long end, while not directly controlled by the Fed, does react to expectations and the term structure of rates. Related impacts include a stronger dollar and weaker stocks. Mark Gilbert notes that traders tend to over-react.
  • In the long term, the Fed policy change is a data-dependent reflection of a stronger economy (assuming that it is not driven by inflation fears). Modestly rising rates are not a threat for stocks as long as the economy is strengthening.

This means that traders must be nimble, prepared to shift with perceptions. Investors who understand the background may get an opportunity to buy another dip. If it reflects recent history, the dip may be shallow.

See the original article >>

How Much $1 Used To Get You


See the original article >>

Saturday, September 13, 2014

«The first thing I look for is the exit sign»

by Christoph Gisiger

  • «Things could theoretically turn into what I call a «Lehman moment».»

    «Things could theoretically turn into what I call a «Lehman moment».» (Bild: Richard Drew/AP/Keystone)

Wall Street veteran Art Cashin does not fully trust the record levels at the stock market and draws worrisome parallels between the geopolitical tensions over Ukraine and the Cuban missile crisis.

From the assassination of President Kennedy via the stock market crash of 1987 and the Fall of the Berlin Wall through to the burst of the dotcom bubble, the terror attacks of 9/11 and the collapse of Lehman Brothers: Art Cashin has experienced all the major world events of the last half century at the floor of the New York Stock Exchange. Currently, the highly respected Wall Street veteran keeps a close eye on the geopolitical tensions in the Middle East and on the situation in Ukraine which reminds him of the Cuban missiles crisis. «The markets are edgy and nervous», says the Director of Floor Operations for UBS (UBSN 16.46 0.43%) Financial Services while constantly checking the quotation board. Like many traders here, he is somewhat skeptical of the huge stock market rally that started in March 2009. «I think it is a question of the extraordinarily low interest rates», he explains.

Mr. Cashin, September is historically the most difficult month of the year for equities. What is your take on September 2014 so far?
It is strange that September still lingers as a particularly weak month. It goes back to when America was more of an agrarian society and we depended on what would happen with the crop cycles. If a cooking factory for example had to buy wheat from the farmers it would send a check out drawn on an account at a city bank and the country bank would then cash it and put the money in the farmer’s account. Before the Federal Reserve was created, there was a wide spread between the time that money was asked for and when it was replaced. For centuries, this caused bank panics around this time of the year, most notably the panic of 1907. You would think that now that we are no longer an agrarian society, those changes would ease up on the financial pressures. But the market has kind of an echo.

So what are traders talking about at the present time here at the New York Stock Exchange?
We are concerned about two questions. First, how will the Fed do in keeping money reasonably easy without causing inflation? Second, where do we stand with the current geopolitical challenges? For now, these challenges seem to be short term concerns. But should we begin to see a financial contagion and pressure building on banks in Europe, perhaps out of the Ukraine situation, things could theoretically turn into what I call a «Lehman moment». That is when markets come under pressure but seem to be under control, and then things change suddenly.

How do you handle these concerns in your daily business as stock market operator?
Having done this over half a century now, the market tends to have recurring cycles of some type or other. For example, at the beginning of the Cuban missile crisis no one thought that it would turn into a major event. Yet, as time went on and neither side relented, it began to look like we might be on the verge of a nuclear war. That had great reverberations in the financial markets. Then, finally the Russian convoy that was going to resupply the Cuban missiles turned and headed back. Immediately, the stock market began to rally on that sense of relief and that rally continued for months. So you can have these theoretical events – whether they are geopolitical or not – and you get two sweeping changes: First, you can get further and further pressure on prices. And then suddenly, when it releases, you can get almost a rocket shot to the upside.

What are the signals you are looking for to stay on top in such a market?
Over the years, we on the floor have taken to look at what we call the risk monitors. For instance, the yield on the 10-year Treasury note is usually an indicator for the flight to safety. People are looking to get over to the United States protected by the two large oceans. You also look at the gold market where people invest who are concerned that things are changing radically and who think they need some currency protection. And then, particularly in situations like this, you look at things like oil because that is inextricably involved with Russia and with the Middle East and what is going on with the Islamic terror organization ISIS.

And what are the risks monitors signaling?
Right now, it almost looks like peace is breaking out. The price of oil is sharply lower, both Texas West Intermediate and Brent. That indicates a lot less stress there. Although traders can be believers in conspiracies too. There is some wonder if perhaps Saudi Arabia and the United States are encouraging downward pressure on oil prices which would in turn put pressure on Russia and limit the availability to finance what they are doing. So there may be either market forces or government forces behind this.

And how stable is the situation on the stock market? Equities have stalled somewhat lately. Nevertheless, at the End of August the S&P 500 closed over 2000 for the first time and so far equities have performed quite well this year again.
I think it is a question of the extraordinarily low level of interest rates. There are very few places that investors can go to and get some return. So some people are using historic yard sticks and they are saying: «If rates are this low and the economy is this okay then the value of stocks should go higher.» But some of us question that since rates are artificially low.

So what is your take on those super low rates?
I think it means that there are still deflationary pressures out there and that the central banks all around the world are fighting off that deflation risk by keeping rates low. Rates are incredibly low in Europe, they are incredibly low in Japan, they are incredibly low in England and in the United States. That drives people to look at some other avenue to get a return and they have been driven into the stock market.

With the looming end of the QE3 program, the stock market soon will have to pass an important test. But surprisingly, in contrast to the end of QE1 and QE2 investors do not seem to be so nervous this time.
But we are seeing a rather similar reaction in the bond market. Perversely, when they ended the earlier QEs, treasury yields went down instead of going up. So we are seeing a little of that. I think the reaction of the stock market has to do with something that is referred to as the Greenspan put, and later as the Bernanke put. Investors believe that the Fed is concerned about its own independence and therefore it cannot let anything drastic happen. Our government has not been able to do anything on a fiscal basis. So the Fed has gone out and developed tons and tons of access free reserves. If that fails the central bankers know that it will be quite convenient for all the politicians to point the finger at the Fed. Hence, not only is the Fed interested in maintaining the economy but also in its own independence.

During your career on Wall Street, you have seen the coming and going of several Fed chiefs. How would you grade Janet Yellen so far?
I think it is a little too early to tell because she has not been fully able to implement her policies. We have not been done with the taper and she has not clearly defined what yardsticks or mileposts she is using. She is a scholarly woman and has done a great deal of studying, like Mr. Bernanke. Also, I have a new person to look at in the Fed and that would be Stanley Fischer. He brings a lot of experience in as vice chairman. As we begin to look at his speeches and comments, we will see that he is going to have an enormous influence and we may be begin to see him helping Ms. Yellen. He is not going to confront her but helping her to, perhaps, understand why things have to change a little.

With the end of QE3 and the return to a somewhat more traditional monetary policy, investors will likely put their focus more on the fundamentals like revenues, profit margins and earnings. In what shape is Corporate America?
That is one of the great debates here. It really breaks down to on what do you view the stock market is based on. On one side, there are the skeptics. They look at macroeconomics like the GDP numbers, the unemployment rate and a variety of other things. Those people tend to have been skeptical all the way through this rally. On the other side, there are the believers in the stock market and the recovery. They have seen the earnings go up and have been spot on so far. But there is a couple of asterisks that you have to put in. Thanks to the low interest rates, companies are finding that they can improve their balance sheets and they are buying back their own shares. So even when you are earning a little less money, if there are fewer shares around, than the price earnings ratio looks pretty good. That is why the critics of the stock market say that it is all part of financial engineering. Nevertheless, the supporters will respond: «Well, here is the earnings and we are at seventeen times earnings and that is very good for us.»

On what side of this debate are the traders here on the floor at?
The view of the traders is a slight degree of skepticism. As I say, having done this over fifty years, traders are always making sure they know the way out. When I go into a room, the first thing I look for is the exit sign. So when things turn bad I know which way to go.

Also, some skeptics argue that you cannot trust this really since it is based on unusually low trading volumes. Especially at the end of August we have seen some of the lowest volume days over the past seven years.
Over the years, I was always thought that volume equals validity. Just as you would not want to elect a president with only ten or twelve people voting. You want to see a broad consensus. Likewise, you would like to see a broad consensus on what is going on at the stock market. But these days, some of that lack of volume is structural. We have new products like Exchange Traded Funds. So you can with one purchase buy the five hundred stocks in the S&P 500 instead of the five hundred transactions that would have taken place in the past. That contributes to a lower volume, too.

How did the trading business change over the last few years in general?
We are going through a transition into automated electronic trading and we are still adapting to that. The new owners of the New York Stock Exchange, the Intercontinental Exchange, said that they would like to revamp what is going on, change some of the rules and perhaps produce a little more visible activity. I for one miss some of the old trading, especially the simple things. When there was a big crowd, noise would tell me things. When the noise level picked up I would know the activity is picking up. And if you are doing it as long as I am, you could almost tell by the pitch of the noise whether they were buyers or sellers: The buyers sound a little more like a Russian chorus. The sellers, on the other hand – I guess because they were nervous – would have a higher pitch when they shout «Sell! Sell! Sell!»

Today, the silent machines of high frequency traders do most of the trading. How do you cope with those superfast computers and highly sophisticated algorithms?
They may be faster but they are not necessarily smarter. Sometimes an old dog can still learn variations of new tricks and get things done. They might get the first step out of the building but you have to think on behalf of your clients what other impact will that have. If they are doing something in General Motors (GM 33.27 -1.01%), what does it mean to Ford (F 8.9 -4.81%) or someone else? So in this business, your clients expect you to be able to relate something that is happening in a particular stock with something in the rest of the market.

In May of 2010, the Flash Crash made the world suddenly aware of what can happen when robots are in charge in the trading arenas. How vulnerable is the US stock market today to a similar threat?
I am, of course, prejudiced. I prefer the trading system that we have had through the years. Here on the floor, not one stock traded at a penny during the Flash Crash. That was only in the electronic markets. And that was because here were humans who looked at each other and said: «That does not make any sense. There is no news out, there is no event. Let’s slow down and see where things are going.» As a consequence, the prices here on the floor tended not to be distorted in a manner that they were in other places. So as far as market structure is concerned, I think it is very helpful to have humans around. I prefer that somebody is watching the market as trades are being executed – just as I would not want to fly in an airplane with no pilot.

See the original article >>

Something white


FANny aperitif locandina

Bella iniziativa dell’ormai nota associazione dei giovani produttori franciacortini, i FAN FranciacortAppassioNati, in programma domenica 14 settembre in quella località che in molti dimenticano far parte della zona di produzione, oltre ad essere un bellissimo posto, Iseo.

Ritorna il format già collaudato Born to Be FAN con una bella novità per i giovani: sette locali, tre percorsi con colori diversi per le strade del centro di Iseo e ancora buffet e musica live, il tutto all’insegna del Franciacorta! Il programma inizia “in centro ad Iseo, in Piazza Garibaldi, dove dalle 17.30 sarà possibile acquistare le tessere da 15 euro che daranno diritto ad un calice per ciascuna delle quattro zone.

I percorsi della prima parte di degustazione sono tre (zona verde, gialla e blu) ed includono sei locali del centro di Iseo: zona Verde con Punto Zero e Bull Cafè, Zona Gialla con BarLume e Garibaldi e Zona Blu con Sucré e Opera. Dalle 21 invece si apre la Zona White presso Cascina Doss, a pochi passi dal centro del paese, dove si avrà diritto all’ultimo calice di degustazione insieme ad un buffet con piatto caldo e musica live”. Punto Zero, Bull, Lume, Garibaldi, Sucré, Opera e Cascina Doss sono locali serali con una clientela giovane e dinamica, dove la tendenza ricade in prevalenza sul consumo del cocktail.

Tuttavia ciò che accumuna i giovani titolari di questi bar è la volontà di spingere il consumo di un prodotto come il Franciacorta che tutti e sette ben conoscono ed apprezzano. La scelta di riservare il loro locale per una domenica sera alla promozione del Franciacorta nasce da questa loro passione che li lega quindi all’associazione dei giovani produttori franciacortini, i FAN FranciacortAppassioNati appunto. “Something white” è il tema della serata, quindi non dimenticare di indossare un accessorio bianco… perché il Franciacorta non macchia!”.

Il gruppo di FranciacortAppassioNati ringrazia in particolare Arber di Cascina Doss “che con una sana vena di pazzia (che del resto connota anche tutto il resto del gruppo dei FAN!) aiuta i ragazzi dell’associazione fin dall’inizio ed in questo evento ha messo idee, tempo e voglia di comunicare un prodotto che i giovani del territorio devono avere l’orgoglio e l’onore di capire e bere, viva il Franciacorta!”.

Per informazioni:
e-mail fan.franciacorta@gmail.com oppure Arber 347-8060219, Anita 335-5638610
O ancora sulla pagina Facebook dei FAN FranciacortAppassionati
https://www.facebook.com/#!/FanFranciacortAppassioNati

Goldman sees demand hitting commodity prices

by Houses and Holes

If you want a clue as to why the Australian dollar is suddenly weak, here’s one from Goldies:

fnhrt

Recent broad sell-off reflects increasing demand concerns
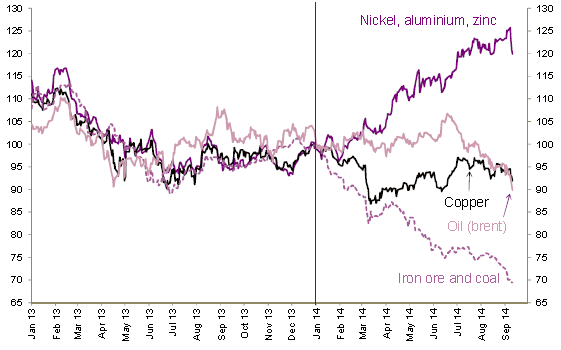
Commodities have sold off across the complex over the past week, following a number of macroeconomic and “micro” commodity-specific events. In the main, it appears that demand concerns were the primary driver, with weakerthan- expected Chinese import and inflation data, comments by the Chinese premier that structural reforms rather than credit expansion would be relied upon to underpin growth, together with European growth concerns, all contributing. While a stronger US dollar and higher US yields have contributed to the decline in precious metals prices, the extent to which this has affected the other commodities is more ambiguous given that, in part, it reflects an improving outlook for US growth.

Supply differentiation has driven significant dispersion ytd
In most cases, the recent move lower represented the continuation of trends that began earlier in the year – with oil (brent, -c.12% ytd), copper (- 8%), iron ore (-39%), thermal coal (-21%), corn (-21%) and soybeans (-20%) falling sharply, primarily owing to bearish supply dynamics. More specifically, in oil, Libyan and non-OPEC output has been improving (although risks around Libyan output remain high). By stark contrast, for aluminium (+21%), zinc (+11%), nickel (+33%) and palladium (+22%), the recent sell-off represented the largest price correction of the year to date, following a period of strong outperformance, in turn generally a result of more bullish supply dynamics.

See the original article >>

Follow Us