Saturday, September 13, 2014

As Venezuela economy worsens, fears of default

By HANNAH DREIER

CARACAS, Venezuela (AP) - President Nicolas Maduro is reassuring foreign creditors that Venezuela's government will make good on a $4.5 billion foreign debt payment due next month.

But economists are uttering the D-word for the first time, noting the inflation-ravaged economy is stumbling with basic goods in short supply and the currency eroding in value.

Maduro has repeatedly said default is not an option. On Wednesday, he reiterated his administration's commitment to pay "down to the last dollar."

The subject gained traction in recent days, and even got its own Twitter hashtag, after an article by former Venezuelan planning minister Ricardo Hausmann and Harvard economist Miguel Angel Santos argued that a managed default could help Maduro resuscitate the economy and help his people.

"The fact that his administration has chosen to default on 30 million Venezuelans, rather than on Wall Street, is not a sign of its moral rectitude. It is a signal of its moral bankruptcy," they wrote.

The article was followed by a swing in the trading of Venezuela's debt. On Thursday, investors appeared to take comfort in Maduro's words and prices for its bonds rebounded. Venezuelan bonds pay out more to investors than the debt of any other developing country.

Government opponents have stopped short of endorsing the notion of a default.

Venezuela's 15-year-old socialist administration has always paid its bondholders, though it hasn't been as consistent about repatriating corporate profits. This year has seen an exodus of airlines that complain they haven't been allowed to turn their local earnings into dollars.

Alejandro Grisanti of Barclays this week dismissed the notion of a default, noting that Venezuela could easily find the money it needs to pay off foreign creditors by halting the oil subsidies it distributes to allies around the region. The county boasts the world's largest proven oil reserves, providing a constant flow of income for the government.

Last week, Maduro authorized the consolidation of off-budget funds into a single transparent reserve. Analysts were skeptical that the fund would actually reflect the government's finances, though, especially after it was revealed to have a balance of $750 million, a number dramatically lower than expected.

Analysts agree that more painful adjustments, including a currency devaluation, are needed to right the economy, default or no. But no one expects to see those changes soon.

See the original article >>

Chinese Growth Slows Most Since Lehman; Capex Worst Since 2001; Electric Output Tumbles To Negative

by Tyler Durden

While China may have mastered the art of goalseeking GDP, always coming within 0.1% of the consensus estimate, usually to the upside, even if the bogey has seen dramatic declines in the past few years, dropping from double digit annualized growth to just 7.5% currently and the projections hockey stick long gone...

... it may need to expand its goalseek template to include the other far more important measure of Chinese economic activity, such as Industrial production, retail sales, fixed investment, and even more importantly - such key output indicators as Cement, Steel and Electricity, because based on numbers released overnight, the Q2 Chinese recovery is now history (as the credit impulse of the most recent PBOC generosity has faded, something we have discussed in the past), and the economy has ground to the biggest crawl it has experienced since the Lehman crash.

What's worse, and what we predicted would happen when we observed the collapse in Chinese commodity prices ten days ago, capex, i.e. fixed investment, grew at the slowest pace  in the 21st century: the number of 16.5% was the lowest since 2001, and suggests that the commodity deflation problem is only going to get worse from here.

As JPM summarized earlier today, pretty much every economic data release was a disaster, missing consensus significantly, and suggesting GDP is now trending at an unprecedented sub-7%.

"Today China released major indicators of economic activity for August. Industrial production growth slowed to 6.9%oya (consensus: 8.8%), slowest pace since the global financial crisis period of late 2008/early 2009, suggesting that the economy has lost  momentum again following the 2Q recovery. On the domestic front, both fixed investment and retail sales came in weaker than expected. Fixed investment growth decelerated notably to 16.5%oya ytd in August (J.P. Morgan: 16.8%, consensus: 16.9%), the slowest pace of growth since 2001, while retail sales increased 11.9%oya (J.P. Morgan: 12.4%; consensus: 12.1%). Recall that August merchandise exports (released on Monday) still showed solid growth pace at 9.4%oya, while imports disappointed, falling 2.4% y/y".

It wasn't just the economic indicators: there was pronounced weakness in the biggest Chinese asset, far more important to the local economy than stocks: the housing market:  Home sale area fell 13.4% Y/Y in August, compared to the fall at 17.9% Y/Y in July. In value term, home sale fell 13.7% Y/Y in August, compared to the fall at 17.9% Y/Y in July. In other words, those predicting the bursting of the Chinese housing bubble better be paying attention as it is currently taking place.

Which also means that with organic cash flow plunging, real estate developers had to resort to the capital markets increasingly more, and raised 7.9 trillion yuan year-to-date by August (up 2.7% ytd), compared to 6.9 trillion yuan year-to-date by July (up 3.2% ytd). Basically, this means that in order to delay the hard landing, China is now pushing its banks into the all-in moment as everyone is mobilized to stop the one event that could result in a global depression: recall - Chinese banks have over $25 trillion in assets, the bulk of which is backed by housing.

Finally, and perhaps most disturbing, was that alongside a slowdown in cement and steel production, Chinese electrical output saw its first Y/Y decline since Lehman, dropping by a "shocking bad" 2.2% (in Bloomberg's words) by far the best economic indicator of what is going on in the middle kingdom.

Putting it all together, here is JPM: "Overall, the August activity points at some downside risks going ahead. Note that trade surplus is strong in recent months, but this is mainly because weaker-than-expected import growth, which is related to the story of weak domestic demand. The weakness in domestic demand is not only reflected in real estate activity, but also in manufacturing and other sectors. To some degree this is good news, as slowdown in manufacturing and real estate investment is a critical part of economic re-balancing. Nonetheless, it remains unclear what other sectors could arise and provide alternative source of growth in the near term."

Or, as Bloomberg's Tom Orlik shows, based on these real-time economic indicators, China's GDP has tumbled to a shocking 6.3% from 7.4%, and far below the 7.5% GDP target set by the premier.

And since it is unclear what can drive growth, JPM is happy to provide one solution: more easing of course. Then again, even JPM confirms that this will be an hard uphill climb: "Despite the weak data in August, there is no sign that the Chinese government will ease macro policies in the near term. In a speech earlier this week, Premier Li reiterated that China’s growth is within a reasonable range, and the government will rely more on structural reform, rather than stimulus, to support economic growth."

But recall that China has used big words before, such as last summer when it swore it would engage in a 1 trillion deleveraging, only to quickly forget all about it when its banking system nearly collapsed after overnight repo rates soared to 25%.

So what are the options? Here, again, is JPM:

What measures could be introduced to stabilize the growth momentum?

First, the central bank has adopted unconventional measures to ease the monetary policy since 2Q. These include a target for relatively low market interest rates (e.g. repo rates and SHIBOR); targeted credit easing, such as the PSL, re-lending, targeted RRR and target rate cut; tighter rules on shadow banking activity and improve the credit support to the real sector (via compositional shift from shadow banking to bank loans in total social financing). It is likely that the PBOC will expand the PSL operation in the coming months to support targeted sectors (e.g. environment, water conservation, small business).

Second, given the limitations in fiscal policy to support investment in 2H14, the government may introduce measures to encourage the participation of private investment. Such measures include removing government control, opening market access, or the public-private-partnership (PPP) model.

In addition, we expect housing policies will be further eased to slow down the adjustment process in the housing market. Many local governments have removed or eased the home restriction policies in recent months, and since July mortgage support for first-home buyers has improved (e.g. lower mortgage rates and improved mortgage availability). In recent weeks some real estate developers were allowed to raise funds from the bond and equity market. A next possible policy option could be the easing in loan-to-value restrictions for second-home buyers, which now is subject to a maximum LTV of 40%.

More importantly, this administration has announced some supply-side policy measures. It remains to be seen whether these measures will be implemented in practice. The areas that are worthy of special attention include: (1) administrative reform, i.e. removal of government control and private access to sectors used to be controlled by the state sector; (2) reduction of the tax and fee burden for the corporate sector; (3) reduction of funding cost for business borrowers especially for small business.

In other words, we are now in a world in which the biggest economy, Europe, is about to enter a triple-dip recession, and the third largest standalone economy, China, is undergoing an economic standstill, and all hopes and prayers are that China will join the ECB in activating monetary easing once again. But yes, the Fed will not only conclude QE but will supposedly begin rising rates in just over two quarters.

Good luck with that.

See the original article >>

Junk bond fund repeating 1999 & 2007′s pattern?

by Chris Kimble

pimcohighyieldfundrepeatingmessagesept13

CLICK ON CHART TO ENLARGE

The Pimco High Yield fund (PHDAX) for a period of time around from 1997 to 1999 & 2005 to 2007 found it difficult to move higher, creating a series of level highs. At the same time it created a series of higher lows. Once old support was tested as resistance and it failed to move higher, large declines in junk bonds and the stock market took place.

Over the past couple of years, the fund may have created a pattern that looks similar to 1999 & 2007, as it seem to have trouble getting above the highs hit in 2007.

highyieldspreadbreakingoutsept13

CLICK ON CHART TO ENLARGE

The above chart of the B of A/Merrill Lynch high yield adjusted spread highlights that when sharp rallies took place in 2000 & 2007, stocks turned soft.

It might pay to keep a close eye on the Pimco high yield fund and the adjusted spread in the next few weeks, to see if any important messages come from the junk bond complex.

See the original article >>

SPY Trends and Influencers September 13, 2014

by Greg Harmon
Last week’s review of the macro market indicators suggested, as the kids were back to school and the adults filed back into work from vacations that the equity markets were looking strong but with short term consolidation likely. Elsewhere looked for Gold ($GLD) to continue lower but not stray much from 1300 while Crude Oil ($USO) consolidated in its downtrend. The US Dollar Index ($UUP) looked strong and higher while US Treasuries ($TLT) were biased lower in the uptrend. The Shanghai Composite ($SSEC) was also strong and biased higher along with Emerging Markets ($EEM). Volatility ($VIX) looked to remain subdued keeping the bias higher for the equity index ETF’s $SPY, $IWM and $QQQ. Their charts showed signs of consolidation in the short run with the SPY and QQQ a bit strong on the longer timescale.
The week played out with Gold running lower while Crude Oil tested support lower. The US Dollar consolidated its move higher while Treasuries made new 1 month lows. The Shanghai Composite consolidated its move before probing higher while Emerging Markets moved lower. Volatility ticked up but remained under control. The Equity Index ETF’s basically moved sideways all week, with the SPY pulling back Monday first, and the IWM and QQQ barely changed. What does this mean for the coming week? Lets look at some charts.
As always you can see details of individual charts and more on my StockTwits feed and on chartly.)
SPY Daily, $SPY
  spy d

SPY Weekly, $SPY
spy w
The SPY moved lower Tuesday and then consolidated in a tight range for the rest of the week around the 20 day SMA. There are indications on the daily chart that the move down may continue. The RSI is making a lower low as it heads down and the MACD is crossed down and falling, both supporting more downside. The Bollinger bands are starting to tighten and that bodes for a move soon. The weekly chart shows a strong trend higher interrupted by a small down week. It is near the rising trend support and has a RSI rolling lower with a MACD joining it, so a touch at that support may come soon. There is support lower at 199 and 198.30 followed by 196.50 and 195. Resistance higher comes at 200 and 201.40 with a Fibonacci extension at 202.78 and a Measured Move to 210. Consolidation with a Chance of Pullback in the Uptrend.
Heading into September Options Expiration Week the equity markets look tired and ready for a pullback. Elsewhere look for Gold to continue lower while Crude Oil does the same. The US Dollar Index is strong and looks to continue higher while US Treasuries are biased lower. The Shanghai Composite is also strong and biased higher with Emerging Markets looking to continue their pullback. Volatility looks to remain subdued keeping the bias higher for the equity index ETF’s SPY, IWM and QQQ. Their charts show more consolidation in the zone for the IWM and a possibility of consolidation or even a pullback for both the SPY and QQQ. Use this information as you prepare for the coming week and trad’em well.
See the original article >>

Weekend update

by tony caldaro

REVIEW

After closing within three points of the all time high last week, the market went into a choppy pullback mode this week. For the week the SPX/DOW were -1.0%, the NDX/NAZ were -0.4%, and the DJ World index was -1.4%. On the economic front, reports came in mostly to the positive. On the uptick: consumer credit, retail sales, wholesale/business inventories, import prices, consumer sentiment, and the budget deficit improved. On the downtick: export prices, the WLEI and weekly jobless claims increased. Next week is FOMC week, and we get reports on Industrial production and Housing.

LONG TERM: bull market

Here we are 66 months into this bull market and we are still trying to identify the top of Primary III, in a five primary wave bull market. The western central banks have been propping up liquidity since the bull market began. The FED with QE’s 1, 2, 3 and Operation Twist. The ECB with LTRO’s 1 and 2, and now ABS. During this period the SPX has tripled, and is more than 25% above its 2007 all time high. Germany’s DAX has nearly tripled as well, and is more than 23% above its all time high. With the ECB just starting ABS another liquidity injection is thrown into the count.

Thus far we have counted Primary waves I and II completing in 2011. Primary III could have topped in 2013, but extended into 2014. The current uptrend has the potential to end Primary III, as we can count five Intermediate waves up from the Major wave 4 low in February at SPX 1738. However, there are two problems with this count, one in the DOW and the other in the NDX/NAZ. We detailed these problems in the last weekend update, and the one two weeks before that. Currently we think the probabilities of Primary III ending with this uptrend, or extending into next year, are equal.

SPXweekly

The key levels to watch are first SPX 1905. If the market revisits this level Primary III probably ended at SPX 2011. Second SPX 2011. If the market rises above this level the uptrend is probably extending. Third SPX 1991. Should the uptrend extend it has to rise high enough to avoid overlapping the high of the previous uptrend. Since we are in pullback mode now, SPX 1905 and 2011 are the current levels to watch.

MEDIUM TERM: uptrend

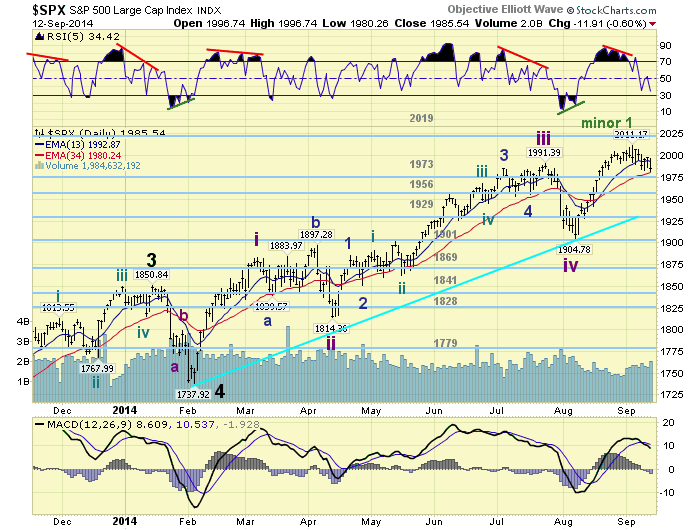
From the early August low of SPX 1905 we have counted five waves up into 2011 a week ago. Since this was a five wave pattern and the market made new all time highs it could have completed the uptrend, and with it Primary III. The expected pullback to medium term support at the 1973 or 1956 pivots just occurred on friday. As the SPX hit the upper range of the 1973 pivot. At friday’s low the market was sufficiently oversold if this uptrend is going to extend. But we think there maybe one more wave down.

SPXdaily

If the uptrend does extend the five wave sequence up to SPX 2011 would be counted as Minor wave 1 of the Intermediate wave v uptrend. And SPX 1980, or lower, would be Minor wave 2. Minor wave 3 would then be getting underway. The rally to follow would take the market to the OEW 2070 pivot, or even higher, to complete Minor waves 3, 4 and 5. Currently the market remains in between the SPX 2011 uptrend high and the 1980 recent low. We can not confirm a Minor wave 3 rally until the market starts making new highs. Medium term support remains at the 1973 and 1956 pivots, with resistance at the 2019 and 2070 pivots.

SHORT TERM

The five waves up during this uptrend were as follows. Waves 1 and 2 SPX 1945 and 1928. Wave 3 subdivided into five waves: SPX 1964-1942-1995-1985-2005. Wave 4 declined to SPX 1991, and wave 5 completed in a diagonal triangle: 2006-1995-2009-1998-2011. After that high we had a choppy pullback to SPX 1980. We have counted a simple wave ‘a’ at SPX 1990, wave ‘b’ at 2008, then a wave ‘c’ 1991-2000-1983-1997-1986-1998-1980.

SPXhourly

If we count 1991-2000-1983 as wave a of ‘c’, 1997-1986-1998 as wave b of ‘c’, and 1980 as the beginning of another three wave sequence for wave c of ‘c’. We should see a small rally early next week, then another decline to lower lows. Since wave ‘a’ was 21 points (2011-1990), a wave ‘c’ of 34 points should bottom at SPX 1974. Also since wave ‘a’ of c was 25 points, another decline of 25 points from SPX 1998 suggests 1973. So the OEW 1973 pivot appears to be the Fibonacci fit on both the larger and smaller waves of this pullback. Short term support is at the 1973 and 1956 pivots, with resistance at SPX 2011 and the 2019 pivot. Short term momentum ended the week just under neutral.

See the original article >>

The Week Ahead: Profiting From a Weak Euro

by Tom Aspray

It was a nervous week for the markets as September’s history of weak stock performance kept some on the sidelines. The other main concern for the market (as overseas tensions subsided) was whether the FOMC may change its policy this week.

In last week’s analysis Is the Junk Dump a Warning?, I noted the heavy selling in some of the high yield or junk bond ETFs ahead of the FOMC meeting.  If we do see a change in the wording of the FOMC announcement, as some are expecting, it could trigger a sharp-but I believe brief-market decline.

In a way, it would be a positive as it would remove one more concern from the investor’s wall of worry. A decline would also serve to reduce the high level of bullish sentiment as-amongst the Wall Street firms-the bearish strategist camp was reduced further last week.

Click to Enlarge

The volatility has returned to the currency markets with a vengeance as forex traders have been suffering with the low volatility. The Japanese yen fell to a six-year low last week as their bond yields dropped into negative territory. Overseas yields are now much more attractive, especially with the potential of higher US rates in the next year.

The chart shows that the yen broke major support, line b, on December 12, 2012.  Since then, it has lost 22% of its value. The breakout (line 1) came one week before the NK225 broke through its downtrend, line a. The NK225 is up over 71% since the bottom formation was completed. I continue to think that the yen will get even weaker, which will be good for Japanese stocks.

The comments from Mario Draghi last month that the Eurozone should drop its austerity-based recovery plan was followed-up by an asset repurchase plan. Some countries, like Germany and France, are not in favor of this change in policy. He also suggested that the governments should guarantee some of the riskier assets.

The pressure of the low inflation and low growth needs drastic action, in my opinion, to avert a deflationary spiral. As I pointed out in October of 2012, Austerity Didn’t Work in ’37…What About Now?, the brief switch in 1937 to austerity by FDR almost pushed the country back into a depression.

Click to Enlarge

The action by the ECB has had a big impact on the euro as it has dropped almost 14% from the March highs. The euro has been forming lower highs since the spring (line b) and then violated its uptrend, line c, in the middle of July.

As I noted last week, sentiment on the euro is overly bearish so a rebound is likely before it moves even lower. For those interested in the forex markets, I will be doing a Webinar on September 23 discussing FX trading techniques (If you are interested, sign up here).

European stocks have been lagging this year, including Vanguard FTSE Europe (VGK), which is one of my dollar cost averaging picks I discussed last week. In addition to the 66% in developed European stocks, it also has 33% in the United Kingdom. The Scottish vote on independence has hurt the pound recently.

The chart of VGK shows that it has come back to support from the 2011 highs, line a, which is holding so far. I think the weaker euro will have a positive impact on their exports and their economies. I expect more widespread growth in the Eurozone by next spring.

Some of their economies are already recovering nicely as the beaten down Irish economy has staged a dramatic turnaround as they will repay part of their IMF loan early. Their composite purchasing mangers index recently hit the highest level since 2000.

Click to Enlarge

Though the economic calendar was light last week, the falling gasoline prices should translate to stronger consumer spending in the next few months. The chart shows the sharp drop in the gasoline futures since early in the year. A drop much below $2.50 (line a) would signal that prices can move even lower.
Lower gas prices may have helped push the University of Michigan’s Consumer Sentiment higher as the mid-month reading came in at 84.6, up from the August reading of 82.5. The jump in expectations, a component of the index, says Econoday “does point to long-term confidence in the jobs and income outlooks.”

Retail Sales were also out on Friday and-at 0.6%-it was not disappointing. One of the highlights was the 0.6% increase in food service and entertainment, indicating a higher level of discretionary spending.

The economic schedule is much heavier this week with the Empire Sate Manufacturing Survey and Industrial Production on Monday. The FOMC meeting begins Tuesday and the latest reading on the Producer Price Index is also released. Consumer Prices are out on Wednesday followed by the FOMC announcement and press conference in the afternoon.

Some new numbers on the housing market are out on Thursday as the Housing Starts data is released along with the Philadelphia Fed Survey. On Friday, we have the Leading Indicators as well as the quadruple expiration of futures and options.

What to Watch

The stock market was hit with heavier selling on Friday as the declining stocks led the advancing by a 5-to-1 margin. The selling was the heaviest in the Dow Utilities, which were down 1.5%. All the major averages did close the week lower.

The A/D analysis, including the S&P 1500 I featured Friday (see chart), did confirm the early September highs. This is consistent with an orderly pullback not a test of the August lows.

The monthly OBV analysis for the Spyder Trust (SPY) and the PowerShares QQQ Trust (QQQ) did make new highs in August and the weekly has also confirmed the recent highs. This is in contrast to the daily OBV analysis which has been diverging from prices.

The number of bullish investors, according to AAII, did decline last week to 40.38% from 44.67% the previous week. The bearish percentage at 26.6% is still quite low.

Click to Enlarge

The number of stocks above their 50-day MAs has dropped sharply from the early September highs. In blue, there is the % of Nasdaq 100 stocks, which has dropped from 59% at the end of August to just above the 40% level.

In green, we have the same plot of all US stocks, which was 75.5% on September 5 and is now at 61.6%. This suggests that we can see a further correction this week as we head into the all-important FOMC meeting.

The NYSE Composite (NYA) hit a high of 11,108 on September 4 after breaking its short-term downtrend, line a. It looks ready to close Friday just above the monthly pivot at 10,886 with the 50% support level at 10,816.

Click to Enlarge

The monthly projected pivot support is at 10,717 with the longer-term uptrend, line b, at 10,650. This is approximately 2.3% below Friday’s close.

The daily NYSE Advance/Decline has made higher highs, line c, before it dropped below its WMA. It is already close to support from the late July high.
The McClellan Oscillator looks ready to close around -165, which is at moderately oversold levels. It dropped to -278 at the August lows.

The flattening 20-day EMA is now at 10,962 with further resistance in the 11,000 area.

S&P 500
The Spyder Trust (SPY) looks ready to close the week on its lows. The week of September 5, SPY formed a doji so a final print on the SPY below $199.42 will trigger a low close doji sell signal.

The monthly pivot and the daily starc- band are in the $197.56 area. There is further support in the $195.50-$196 area. The weekly starc- band is at $191.17 with longer-term uptrend, line b, just a bit lower. The support from the early 2014 high is at $188.

Click to Enlarge

The weekly on-balance volume (OBV) did make new highs two weeks ago but has not turned lower. It is still well above its rising WMA and support at line c. The daily OBV has been below its WMA for most of September.

The S&P 500 A/D (not shown) looks ready to close the week below its flattening WMA.

Dow Industrials
The SPDR Dow Industrials (DIA), after a new high in early September, has closed below its 20-day EMA at $169.37. The 20-week EMA is at $167.57, which is just above the 50% Fibonacci support level at $167.12. The quarterly pivot is at $164.98.

The Dow Industrials A/D line (not shown) did confirm the recent highs but may close just below its WMA on Friday.

The weekly relative performance has been below its WMA since it broke down in the summer of 2013 (see arrow). This was an indication that it was starting to lag the S&P 500.

The weekly OBV did make a new high this week with support at its WMA and then the recent lows, line h. The daily OBV did not make a new high with prices.

Nasdaq 100
The PowerShares QQQ Trust (QQQ) continues to hold up the best with the 20-day EMA now at $99. The daily starc- band is at $98.31.

The monthly pivot is at $97.86 with the monthly projected pivot support at the $95.81 area.

Click to Enlarge

The September high for QQQ is at $100.46 with the daily starc+ band at $101.24 and the weekly is just slightly higher.

The technical studies still look the best on the QQQ. The weekly relative performance closed at a new high last week as it broke through resistance, line c, in late July.
The Nasdaq 100 A/D line, after making a new high, has traded in a narrow range but looks likely to close above its WMA. A drop below the late August lows would be more negative.

Russell 2000
The iShares Russell 2000 Index (IWM) is trying to close barely above its 20-week EMA and the quarterly pivot at $114.61. A close below the $113 level would be more negative. There is still major support, line d, in the $107 area.

The weekly RS line is now testing its steep downtrend, line e, but is still below its WMA.

The weekly OBV has turned down and is very close to dropping below its WMA. The daily OBV is holding above its still rising WMA.

There is initial resistance now at $117-$118 with more important in the $119-$120 area.

See the original article >>

Follow Us