Thursday, April 3, 2014

Beyond the Emerging Middle Class

by Tassos Stassopoulos
For many years, the rise of the middle class in emerging markets has captivated the imagination of investors. We think this is an illusion. It’s the working classes who will be the real engines of consumer growth in developing countries.
Consumer dynamics in emerging markets are often misunderstood. Yes, it’s true that the rise of the middle classes is a defining characteristic of a vibrant, developing economy. But to capture a country’s increasing spending power, it’s a mistake to focus solely on the middle classes. That’s because the fastest growth will be driven by the masses of lower income workers as they improve their lot to join the middle class.
Poorer Consumers Are Upbeat
This is a natural process. In our travels across emerging markets, we found that poorer people were generally more hopeful about new opportunities and keen to seek better education in order to pull their families out of poverty.
Take Bala, a 32-year-old farmer from a small village in Maharashtra State, India. His income has increased by 15%–20% over each of the past five years, owing to more efficient utilization of his time. Simply by having a mobile phone, Bala has been able to find work on other people’s farms or in construction in the village. Eventually, he hopes to save enough to buy a cow and sell the milk. And he’s educating his kids to help them find employment in a service industry, which would provide a more stable source of income and boost their standard of living dramatically.
India has perhaps 280 million people who are benefiting in different ways from improved connectivity, according to estimates based on the rapid expansion of rural cellphone penetration in the last five years. As they move out of poverty, their contribution to GDP will grow dramatically leading to a massive shift in the emerging consumer.
New Challenges for the Middle Class
Younger people from lower income groups are creating new challenges for the established middle class. For example, Marcia, a 36-year-old school administrator from Sao Paolo, recently told us that people like her find it much harder to get a job today than just a few years ago. As competition has increased from younger candidates—who often come from poorer homes—employers want more. “Companies are more demanding,” Marcia told us. “They expect a degree and are looking for people to speak English and Spanish.”
Similar sentiments were echoed across 12 countries that we visited over the last two years, meeting consumers in their homes to understand their hopes, dreams and aspirations. We ask consumers to describe their lives five years ago and today. Forty-something, middle income professionals frequently expressed concern about the employment market. And poorer people were typically much more upbeat about their prospects for growth. The optimism tends to reflect the scale of improvement in their lives in recent years—which has often been more pronounced for lower income households.
Survey data support our findings. According to Euromonitor, from 1992 to 2012, the lowest third of income groups across the top 12 emerging markets enjoyed the largest wage increases (Display). This trend is expected to continue through 2020.
Companies Must Cater to Lower Income Groups
For investors, the message is clear: focus on companies that know how to sell to lower income households—because they will be the big beneficiaries of accelerated growth over time.
In the past, there weren’t many investment options to capture this type of growth. The working classes were more likely to buy goods from local markets or informal outlets. So bigger, publicly traded companies targeted the middle classes, by aiming to sell them developed-world products at developed-world prices.
Times are changing. Today, reaching lower income consumers—who have demanding tastes for quality goods at a fair price—is the key to success. In our view, domestic or multinational companies that figure out how to do this will be the biggest beneficiaries of consumer growth across income groups in emerging markets.
See the original article >>

Look at the Stock Market 4-year Presidential Cycle

By: Clif_Droke

For all the bullish 2014 expectations among Wall Street analysts, few if any consider the impact of the long-term cycles. After all, it’s in late 2014 when several major long-term yearly cycles are scheduled to bottom in unison, from the widely followed 4-year cycle to the well-known 10-year cycle and on to the even bigger 40-year and 60-year cycles. Each of these cycles tends to stamp its unique presence on the stock market when they bottom individually. How much more then can we expect to feel their presence when they’re bottoming contiguously?

Putting aside the bigger implication of the long-term inflation/deflation cycle of 60 years, let’s examine just the 10-year cycle. This is one of the components of the long-term “super” cycle. As long-time readers of this report will recall, the last time the 10-year cycle bottomed was in 2004. This cycle always bottoms in the “four” year of each decade.
When it’s bottoming by itself the 4-year cycle doesn’t always create bear market conditions, but it does tend to increase stock market volatility – especially as the bottom draws closer (late September/early October). You’ll recall that 2004 was essentially a lateral or sideways trading range for the stock market with stocks making no net progress that year. While the year 2014 is still young, it’s worth noting that already the S&P 500 Index (SPX) has made no net progress to date while the Dow 30 Index is below its 2013 high. It’s too early of course to establish any intermediate-term patterns, but the makings of a trading range are already evident.
Even if you’re not a proponent of Kress cycle theory, consider that we’re in the second year of the 4-year presidential cycle. The second year following a U.S. presidential election year is almost always marked by increased market volatility. Not uncommonly the second year of a 4-year presidential cycle witnesses a bear market. Let’s examine the “second year curse” of the past few presidential cycles for some examples:
· The second year of President Regan’s first term in 1982 witnessed a volatile market environment with the S&P declining through the first half of the year; it marked the bottom of the 1970s/early ‘80s bear market. The second year of Regan’s second term in 1986 saw the S&P rally in the first half of the year; in the second six-month period of ’86 the stock market went nowhere and was range-bound until stocks took off again in 1987….
· The second year of President Bush’s term in 1990 was a bear market and witnessed the worst part of the S&L crisis; most of the damage was done in the July-October period when both the 4-year and 12-year cycles were bottoming.…

· The second year of President Clinton’s term in 1994 saw a mini-bear market. The S&P was down for the year after a number of extreme gyrations as the 4-year and 10-year cycles bottomed. The second year of Clinton’s second term occurred during the final “blow-off” phase of the ‘90s bull market, yet it witnessed the shortest bear market on record: a 20% Dow decline over two months in the summer of ’98 as the so-called Asian Contagion and the LTCM meltdown roiled global markets….
· The second year of President GW Bush’s first term witnessed a major bear market; the second year of his second term witnessed at least one major bout of volatility in the spring and early summer of the year 2006….
· The second year of President Obama’s first term saw the infamous “flash crash.” One can only guess what the second year of his second term will bring later this year.
The above overview of the presidential cycle reveals some common denominators. The first one is that years in which the 4-year cycle bottomed along with a bigger cycles, such as the 10-year or 12-year cycle, saw unusual periods of market volatility and selling pressure, particularly in the second half of the year. The second is that volatility tended to increase during the second year of a president’s second term. Both of these factors apply to 2014.
Based on our survey of the last 30+ years we can conclude that the second year of the sitting president’s term is typically a year when bad things happen. Why this should be is self-evident; a presidential administration has a vested interest in implementing policies designed at “juicing” the economy in the first year of the term in order to consolidate political support. The second year of the 4-year term is when most tax and regulatory increases are implemented. It’s assumed by presidents that they will be able to again juice the economy in the third and fourth years, and that voters will likely forget the bad times of the second year by the time the next election rolls around. Incidentally, the second year of a president’s term always coincides with the down phase of the 4-year Kress cycle.
The reason for taking pains to review the 4-year presidential cycle in tonight’s report is because there are strong reasons for believing it will come into play at some point this year. Maybe not in the next couple of months, but certainly by the summer we should see signs of increasing market volatility and accelerating selling pressure, especially as we head closer to the final bottom of the 60-year deflationary cycle this fall. If China and/or other emerging market countries are experiencing turmoil (as I expect) it will likely only serve to exacerbate the volatility.
Already we’ve seen a brief preview of what the next global market crisis could look like. The problems have originated in China and Russia with other countries (e.g. Brazil, Chile, Turkey) playing supporting roles. This is very similar to what happened in 1998 with the financial crisis that rolled across the globe beginning with Asia and extending to South America, Russia and finally hitting the U.S. like a tsunami. Few market analysts in 1998 (a super boom year) believed the “Asian contagion” would infect U.S. markets, but they were dead wrong. It happened very quickly in ’98 with most of the damage occurring in July through September – the final “hard down” phase of the 4-year and 8-year cycles.
Again, this summer the 4-year, 8-year, 10-year, 12-year, etc. cycles through the 60-year cycle will also be cascading into their final bottoms around late September/early October. It would be surprising indeed if the financial market somehow emerged unscathed by this crescendo, especially given the fragile state of the global economy.

Kress Cycles

Cycle analysis is essential to successful long-term financial planning. While stock selection begins with fundamental analysis and technical analysis is crucial for short-term market timing, cycles provide the context for the market’s intermediate- and longer-term trends.
While cycles are important, having the right set of cycles is absolutely critical to an investor’s success. They can make all the difference between a winning year and a losing one. One of the best cycle methods for capturing stock market turning points is the set of weekly and yearly rhythms known as the Kress cycles. This series of weekly cycles has been used with excellent long-term results for over 20 years after having been perfected by the late Samuel J. Kress.
In my latest book “Kress Cycles,” the third and final installment in the series, I explain the weekly cycles which are paramount to understanding Kress cycle methodology. Never before have the weekly cycles been revealed which Mr. Kress himself used to great effect in trading the SPX and OEX. If you have ever wanted to learn the Kress cycles in their entirety, now is your chance. The book is now available for sale at:
http://www.clifdroke.com/books/kresscycles.html
Order today to receive your autographed copy along with a free booklet on the best strategies for momentum trading. Also receive a FREE 1-month trial subscription to the Momentum Strategies Report newsletter.

See the original article >>

Gold Timers Are Net Short – Not Bearish Enough?

by Pater Tenebrarum

Mark Hulbert on Gold Sentiment

Mark Hulbert publishes sentiment data on stocks and gold, which aggregate the recommendations of market newsletter writers. The level of gold sentiment index HGNSI indicates the percentage of one's portfolio the respective newsletter writers recommend their readers should allocate to either long or short positions in the market concerned. Keep in mind that these are averages, and that we are talking about people who are in the business of selling  newsletters.

They are catering to customers who are often not necessarily interested in good recommendations, but want to see their own biases confirmed. Of course, there are many newsletters that have an excellent track record, published by advisors who are genuinely interested in offering good analysis. All we are saying is: a slight long bias is probably detectable on average.

In his latest column, Mark Hulbert argues that the current average recommendation of the gold timers – namely that people should be net short gold with 10% of their assets – is not yet indicating high enough pessimism. He writes:

“To be sure, the average gold timer is more bearish today than he was this past weekend. But he still is not as pessimistic about gold’s prospects as he was on the occasion of past tradeable bottoms.

My preferred gold sentiment indicator is the Hulbert Gold Newsletter Sentiment Index (HGNSI), which reflects the average recommended gold market exposure level among a subset of short-term gold market timers tracked by the Hulbert Financial Digest. This average currently stands at minus 10%, which means that the average gold timer is now recommending that his clients allocate 10% of their gold-oriented portfolios to going short.

That is a step in the right direction, from a contrarian point of view. When I wrote my column this past weekend, in contrast, the HGNSI stood at 16.7%. But, as you can see from the chart, the HGNSI is still not as low as it was at the bottom of gold’s other corrections over the last couple of years. At the end of last November, for example, prior to a rally that would add nearly $200 to the price of gold, this sentiment average stood at minus 36.7%.

And last June, prior to a gold rally that was even more powerful, the HGNSI got as low as minus 56.7%. To be sure, gold did mount a several-hundred-dollar rally in late 2012 off a sentiment base that wasn’t as bearish as these two instances from last year. Then the HGNSI never got lower than minus 15.7%, only modestly lower than where it stands today.”

Here is the chart that was posted along with the analysis:

HGNSI

The HGNSI over the course of gold's cyclical bear market - click to enlarge.

What it All Means

We happen to recall an instance in March of 2003, when gold had just begun to rise again after having gone through a corrective phase. At the time, the HGNSI stood at + 65% (average recommendation: 65% long) and Mark Hulbert warned in no uncertain terms of how dangerously overconfident the newsletter writers were. Over the next 9 months, the gold sector rallied by more than 100% (gold itself didn't do as well, but it rallied as well of course). When the sector finally suffered a fairly noteworthy correction in late 2003/early 2004,  the gold timers lost a lot of their previous enthusiasm. Mark Hulbert concluded it was a good time to buy, but it turned out it actually wasn't. A grinding bear market that lasted 18 months ensued (Gold went mostly sideways in a broad range, but gold stocks really took it on the chin).

Now pay attention to the sentences we have highlighted in the excerpt above. It is absolutely true that the two most recent lows were made with much more negative HGNSI readings – in fact, readings that haven't been seen since the late 1990s. It is just as true that in 2012, when gold still looked technically strong, a much lower negative reading was followed by a very big rally. So why is there such a big dispersion in what these readings signify? Are they really any better than a coin flip?

We would suggest that the meaning of these readings simply depends on whether gold is in a bull or a bear market. In bear markets, steeper negative readings are required to give a buy signal. In a bull market, even a high positive reading can mean it's not a bad time to be long.

What we should be interested in at this juncture is this: whether or not gold is in the process of transitioning back into a bull market. If it is, then the HGNSI readings required to indicate short term lows will move to progressively higher levels.

Just consider the last two lows of June 2013 and December 2013. They were at almost exactly the same price level, but the HGNSI was at very different levels. This actually represented a bullish divergence. It showed that the conviction of bears was receding as the same low was approached the second time. The same thing happens in bull markets, only the other way around. The peaks occur with slightly less bullish sentiment than is seen at the immediately preceding interim highs.

In other words, whether the current average '10% net short' recommendation is a contrarian buy signal or not does not depend, as Mr. Hulbert claims, on what the HGNSI readings at the most recent significant lows were. It depends solely on whether gold is about to enter a cyclical bull market or not. If the bear market is still intact, then we may eventually well see much lower readings (along with lower prices). We personally believe the transition phase has begun, but we could of course be proved wrong. However, if we are not wrong about this, then higher HGNSI readings will henceforth be recorded at interim lows.

See the original article >>

Memo To Deutsche Bank Chief Stock Tout Joe LaVorgna: Inventory Spurts Are Not Signs Of A Keynesian Boom

by Jeffrey P. Snider

Courtesy of James Pethokoukis of the AEI, today we learn that Joe LaVorgna, Chief Economist at Deutsche Bank, noticed, “Over the past year, the US economy has demonstrated a significant acceleration.” The reason for such cheeriness is the “private economy.” In other words, if you take out the “fiscal drag” of purported austerity, the indication of GDP is very encouraging. Summing up this optimism, Pethokoukis adds, “Actually, the increase in fiscal drag in 2013 was accompanied by faster private GDP growth. You can probably thank for the Fed for that.”

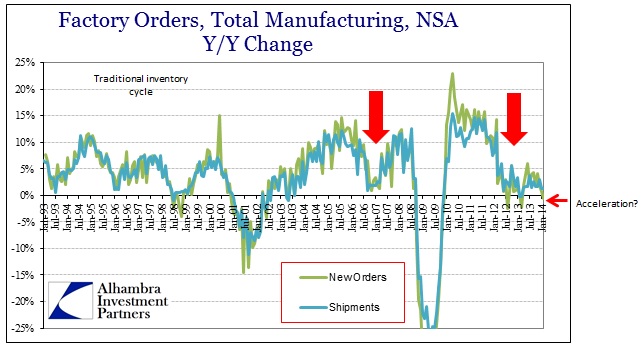
I’m not sure acceleration is the word I would use to describe anything about the US economy right now, be it housing, consumer spending or the goods economy. If the economy is moving in the “right” direction, it should be easily observable in a broad range of accounts, including today’s release of factory orders.

ABOOK Apr 2014 Factory Orders Total

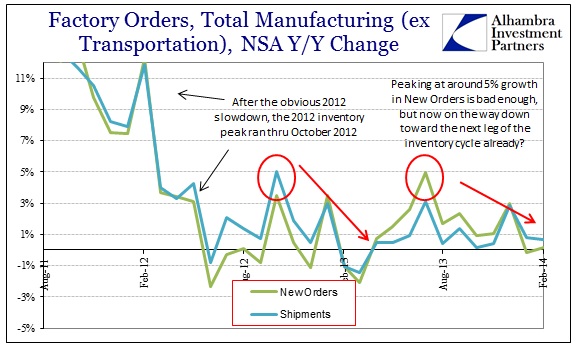
The factory orders estimates for February were among the worst of this “cycle”, matching closely the lows seen late in 2012 and early 2013. In other words, more of the inventory mini-cycle.

ABOOK Apr 2014 Factory Orders Inventory Cycle

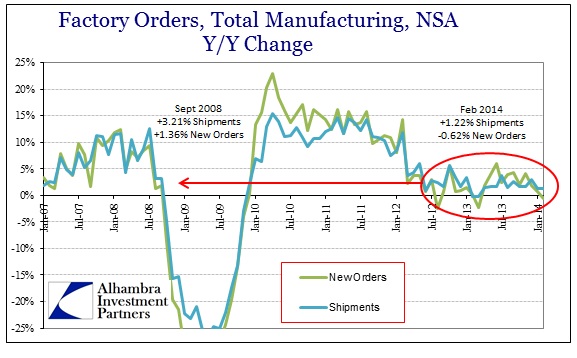
Setting aside second derivatives for a moment, there is something particularly striking about what we have seen now for almost two years. The growth rate again exudes this kind of confused stasis, with almost no growth at all, to significantly underperform the first phase of the Great Recession.

ABOOK Apr 2014 Factory Orders Total 2008 Comp

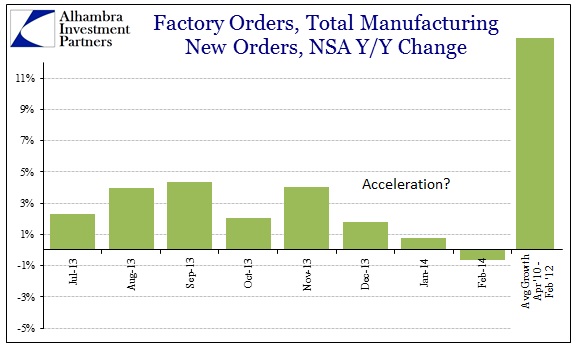
The recent trend in factory orders also belies any notion of acceleration, contradicting the apparent predictive capacity of non-fiscal GDP. Even if factory orders showed a positive growth rate and second derivative in February, it would hardly be something that would indicate sustainable growth. We have not seen anything above 5% in almost two years, compared to the average rate from April 2010 through February 2012 of 13.1%. It’s not even close.

ABOOK Apr 2014 Factory Orders Recent

What LaVorgna and Pethokoukis are attempting amounts to a sleight of hand. By first looking at GDP by halves instead of quarters they can preserve the ordinal changes that look like acceleration. However, if you view GDP in the more normal quarterly fashion, the last two quarters and current estimates for Q1 2014, the trend looks noticeably similar to the data shown above: 4.1%, 2.6%, 1.8%; i.e., deceleration.

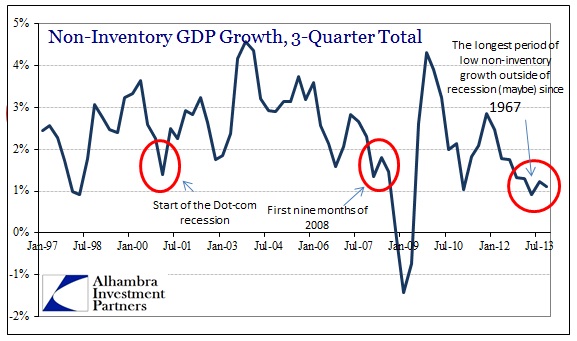
That conforms to what we know of the inventory cycle as it has appeared throughout the economic accounts. We can include GDP itself, given that almost half of the 4.1% rate in Q3 was due to record inventory levels (that continued into Q4). So where they seek to view GDP ex-gov’t, I can counter with GDP ex-inventory.

ABOOK Feb 2014 ISM GDP Non Inventory Growth

That is a far more consistent position in accordance with a broad array of data that shows exactly this constant deceleration, interrupted only slightly by an inventory mini-cycle most associated with the pattern of 2008.

For his part, however, Joe LaVorgna, like almost every orthodox economist, has at least been consistent in his thesis regarding acceleration. In this morning’s relatively irrelevant ADP report, his expectation of +275k far exceeded the actual +191k. In early January, he actually increased his expectation for the December payroll report (Establishment Survey).

Joe LaVorgna, chief U.S. economist of Deutsche Bank, who did not participate in USA TODAY’s survey, said he has boosted his December estimate to 250,000 additional jobs from 200,000.

More critically, while a single month of job gains is difficult to forecast, LaVorgna is among economists who think the labor market will shift into a higher gear this year, with monthly employment gains averaging about 225,000 vs. about 190,000 in 2013.

That month came in at +84k.

In August 2012, LaVorgna was again optimistic:

Joe LaVorgna, chief economist at Deutsche Bank, welcomed the Fed’s inaction. “The training wheels need to come off the bike and the economy needs to be left alone,” he said.

The very next month that optimism apparently dissipated in the warm embrace of QE3.

“There’s strong hints that they’ll do Treasurys next,” Joe LaVorgna, chief economist at Deutsche Bank Advisors, said in a phone interview from London. “They’re pulling out all the stops to try to get this economy to gain some traction and, most important, to get unemployment down.”

One month the economy “needs to be left alone” without “training wheels”; the next there is serious concern about “traction.”

This extends back a long way, including the following:

Deutsche Bank’s Lavorgna also turned more pessimistic after the consumer-spending numbers were announced yesterday, saying the economy looks set to suffer a 0.5 percent decline in the third quarter. He had previously expected a 0.7 percent gain.

That was September 30, 2008. It took Lehman, AIG and Wachovia to slightly erode Mr. LaVorgna’s optimism enough to actually forecast just a small decline in GDP.

I don’t mean to be overly harsh on one individual, only to point out what is common among the orthodox set. An economy that is actually accelerating will show it conclusively across numerous and disparate economic accounts and estimates. And it will be fully insulated from snow and winter. A real recovery will not be bothered or interrupted because of a Polar Vortex, though it does offer very convenient cover to what is an obvious and durable downslope. You can probably thank the Fed for that.

See the original article >>

ECB leaves rates on hold despite inflation worries

By JUERGEN BAETZ

President of the European Central Bank Mario Draghi attends a press conference after a Eurogroup meeting in Athens, Tuesday, April 1, 2014. Finance ministers from the eurozone and the wider European Union are gathering in Athens amid tight security, with Greece hoping for a gesture of support for the release of long-delayed funds from the country's multi-billion-euro bailout. (AP Photo/Kostas Tsironis)

President of the European Central Bank Mario Draghi attends a press conference after a Eurogroup meeting in Athens, Tuesday, April

The European Central Bank left its main interest rate unchanged Thursday despite evidence that the economy of the 18-country eurozone is weak, with inflation continuing to fall and unemployment stuck near a record high.

The ECB's decision to leave the rate at a record-low 0.25 percent is certain to prompt questions about whether it might soon resort to less conventional measures to boost the economy, such as a new round of cheap loans to banks or large-scale purchases of financial assets, as the U.S. Federal Reserve has done.

President Mario Draghi is set to discuss the ECB governing council's policy decision later Thursday, and investors will be watching for any hints of future action.

Data released on Monday showed the annual inflation rate across the eurozone dropped to 0.5 percent in March — down from 0.7 percent in February. The decline — the third in as many months — underlined concerns that consumer prices could start to fall outright, starting a so-called deflation.

That risks creating a situation in which consumers and businesses put off purchases in hopes of better deals down the line and companies cut prices to entice buyers. Such a downward spiral chokes off economic growth and can be difficult to get out of — Japan was stuck in deflation for two decades.

The ECB has said the eurozone is experiencing a "protracted period of low inflation" but dismisses fears of an outright deflation.

Unemployment, meanwhile, remains stuck near a record-high of around 12 percent following years of economic and financial upheaval. In the countries hardest-hit by the crisis like Greece and Spain, more than one in four people are still jobless.

Besides having a social cost, high unemployment also weighs on consumption and the wider economy. The EU predicts the eurozone will grow 1.1 percent this year. While that would be the bloc's best performance since 2011, it would still pale in comparison to the U.S. economy, which is expected to grow around 3 percent.

This week's new dip in inflation came at a time when the euro has been buoyant in foreign exchange markets. But a higher currency can push inflation further down in two ways: It can make imports cheaper and weigh on economic activity by making exports more expensive on international markets.

The prospect of a looming deflation, meanwhile, is especially worrisome for those eurozone nations already unable to support growth because of their overly high debt burden. That's because when prices fall, it becomes harder to service debts, which are fixed in nominal terms.

Among the possibilities the ECB might be considering in the near future, analysts say, might be large-scale purchases of financial assets such as government bonds with newly created money, as the U.S. Federal Reserve has done.

That would increase the amount of money in the economy and aim to lower market interest rates and stoke inflation. But such a move faces legal, political and technical obstacles.

Besides offering a new round of cheap loans to banks, the ECB could also trim its deposit rate below zero, effectively penalizing banks for holding money at the ECB instead of lending it out in the economy.

See the original article >>

Yellen on US Economy

by Pivotfarm

Surprise, surprise! Federal Reserve Chair Janet Yellen stated on Monday 31st March that the Federal Reserve shall have to continue bolstering the US economy while it remains stuck in the rut of economic slump. Just as well she made the statement yesterday and not today, as everybody would have taken it for an April Fool’s Day prank…or she would have ended up with egg on her face.

Yellen stated (at the 2014 National Interagency Community Reinvestment Conference, March 31st) that the conditions for the labor market were tougher today than at any other time in any other recession. Of course, she would say that in exoneration of responsibility of the role of the Federal Reserve and the US government and their apparent lack to get the US economy moving despite spending immeasurable amounts to bolster the banks and inflate the stock markets. She spoke of the “extraordinary commitment” of the Fed. But, me thinks the lady has not understood. We don’t need commitment, we need action and results.

She spoke of the economy being far from where it should be right now and that the expectations of the Federal Reserve were failing to come to fruition. She said: “The past six years have been difficult for many Americans, but the hardships faced by some have shattered lives and families. Too many people know firsthand how devastating it is to lose a job at which you had succeeded and be unable to find another; to run through your savings and even lose your home.” But, again, it’s not compassion that we need, it’s action and results, once again. 
We have neither of those two and so all the compassion and understanding however (in)sincere it may be is of no good whatsoever.

But, it does have everything to do with spin-doctoring. The Federal Reserve has now moved into a new era of communication and the compassionate understanding Yellen is now story-telling her life away in the hope that the image changes for the Fed and the people get some spin on them and change opinion.

The Fed has rolled off some $3 trillion in easy money. Interest rates are nearly non-existent and have been for five years. She even said that “recovery still feels like a recession to many Americans, and it also looks that way in some economic statistics.” Feels like? It’s far more than just a feeling.

There are 7 million people working part-time according to her figures in the US and that would like to have a full-time job. Labor-force participation is down from pre-2008 levels of 66% to today’s level of 63%.

Ben Bernanke was economically condescending. Janet Yellen is now on her road-trip around the US visiting schools and talking about people she uses as endearing examples of the weighty burden of the economic crisis to show just how much she cares for the people down below: “For Dorine Poole, Jermaine Brownlee and Vicki Lira, and for millions of others dislocated by the Great Recession who continue to struggle, the cause of the slow recovery is enormously important.”

I wonder who will be shouting out “April Fool!” today when they look at the sorry state of affairs that the Federal Reserve is in and has got the people into! Is Janet Yellen the April Fool? It certainly looks as if Ben Bernanke stitched her up ‘good and proper’ by handing her the hot potato of the resolution of theQuantitative-Easing problem. There’s no chance of doing anything except making the people laugh, Janet. You’re not going to get yourself out of what Ben got you into. Anybody could have seen that. Still, you must have seen it coming. Keep the printing presses rolling, especially now that the European Union’s ECB is starting to fire up its own printing presses as they fall into deflationary pressure and stop spending. Or, maybe all of this was just a sad joke that the Federal Reserve wanted to play on the world today. Not funny!

See the original article >>

Follow Us