Wednesday, March 26, 2014

PEDV Will Cause Significant Shortfall, Other Meats to Fill the Gap

by The Cattle Site

US - Rabobank has published a new report on the impact of the Porcine Epidemic Diarrhea Virus (PEDv) on the North American herd, forecasting significant impacts on production and slaughter through 2015, and identifying the opportunity for US poultry to step into the market gap.In the report, published by the bank’s Food & Agribusiness Research (FAR) and Advisory team, Rabobank says that PEDv thus far has impacted about 60 percent of the U.S. breeding herd, 28 per cent of the Mexican herd, and is beginning to develop in Canada. If PEDv spreads in Canada and Mexico at the pace seen in the US, Rabobank says that North American hog slaughter could decline by nearly 18.5 million hogs over 2014 and 2015, or 12.5 per cent relative to 2013 levels. Overall US pork production is anticipated to decline six to seven per cent in 2014, the most in more than 30 years. “In the US, we see the outbreak of PEDv causing a significant shortfall in the availability of market hogs in 2014 – to the tune of 12.5 million hogs or 11 per cent of annual slaughter,” explained Rabobank Analyst William Sawyer. “Given the ever-rising number of PEDv cases reported, coupled with a six-month average lifecycle, the months of August through October are likely to be the tightest for processors, where slaughter could decline by 15 – 25 per cent against 2013 levels. If the virus continues at its current rate, the shortfall to US slaughter in 2014 could be as much as 15 million hogs.” The specific origin of PEDv in the US has not been definitively identified but comparison of strains of PEDv in the US have indicated a close relationship with strains in China. What is clear is that once the virus enters a region, it can spread quite easily and rapidly throughout an entire population. The most common avenue is on livestock and farm equipment that come into contact with hogs positive with PEDv or their feces. In regard to productivity, 2014 will be a story of “the haves and have-nots” where hog producers who experienced mild cases of PEDv, or none at all, could realize margins of more than $60 per head, the highest calendar year average seen in Rabobank’s 40-year record. Conversely, hog producers who have had difficulty eradicating the virus could suffer significant losses as the pain of the high fixed costs of modern hog production compounds prolonged periods of weak productivity. Packers for the year to date have been in a “haves” position as the fear of possible stockouts have pushed pork cutout prices up much faster than hog prices. The gross margin for packers reached $63 per head, up from $37 this time last year. Profitability is likely to wane in the spring and summer, as prices continue to climb, testing pork demand, and hog shortages force packers to idle plants. The real winner in the PEDv situation, however, will be the US poultry industry. US beef production is forecast to decline by nearly six per cent in 2014 and, coupled with Rabobank’s estimate of six to seven per cent less pork production, this implies an exceptional opportunity for the US chicken industry as the protein of last resort. US chicken production would have to rise by eight to nine per cent to offset the shortfall from beef and pork, but a limited breeder flock and continued high demand for fertilized eggs from Mexico will keep supply growth restrained. As a result, Rabobank expect chicken prices and margins to climb this spring and summer, yielding a very favorable year for the US chicken industry.

See the original article >>

The Calm Before The USDA Storm on Monday

By: Paul Georgy

Volume continues to be light as we approach the big report at the end of the month. If you look back at the last 5 years, the one thing we can say is that we will see volatility on Monday.  New crop corn has seen an average of 20 ½ cents in either direction whereas beans have been plus or minus 36 ½ cents. Old crop contracts have seen much more in the way of movement. Informa came out with projections yesterday and really didn’t get the market to react much. Corn projections were at 93.029 and beans at 81.204. The average trade guess is 93.014 for corn and 81.162 for beans. Allendale’s farmer based survey has bean acres over 83 million and just over 92 million for corn.

We continue to hear talks of Chinese crushers reselling cargoes of Brazilian beans to the US for April-July shipments and could be as many as 8-10 cargoes. Oil World has projected South American beans at 151.45 MMT vs. previous estimate of 150.6 MMT.

Hogs finished limit down yesterday as weak long positions were taking profits. PED findings fell for the second week and it seems like we have seen the worst for now. The Hog and Pigs report on Friday will be very important to see if we can get bullish numbers to keep the trend up. There is a big fund position that has pushed into the hogs and could cause a sharp reaction lower if they decide to come out. Cutout values were down .25 cents to 131.39.

Cattle closed unchanged yesterday with box beef up .13 cents for choice and down 1.48 for select. There was some light trade in Kansas at 150. Cattle are finding support this morning but will we see cash trade higher this week and break the 150.50 record high that we have hit 3 times before?

See the original article >>

Nothing Screams Bubble Like PIK Bonds, Cov Lite, Levered Recaps & Soaring Small Caps: Insiders Having Final Feed

by Jeffrey P. Snider

In February 2013, more than a year ago, Jeremy Stein, Federal Reserve Board Member, openly expressed concern over behavior in certain sectors of the financial markets. He categorized this as “reaching for yield”, but there was more than a whiff of caution in his exposition of leveraged loans and junk debt. “The annualized rates of PIK bond issuance and of covenant-lite loan issuance in the fourth quarter of 2012 were comparable to highs from 2007. The past year also saw a new record in the use of loan proceeds for dividend recapitalizations, which represents a case in which bondholders move further to the back of the line while stockholders–often private equity firms–cash out.” That was just 2012.

At the December 2013 FOMC meeting, “several participants commented on the rise in forward price-to-earnings ratios for some small-cap stocks, the increased level of equity repurchases, or the rise in margin credit.” What was left out of the minutes (and may have been included in the broader discussion, but I doubt it) was the behavior of all these “risky” asset classes in relation to what had transpired everywhere else. The price and volatility pyramid had by then totally inverted, as these segments had attained a sort of invulnerability not shared elsewhere, particularly UST & MBS.

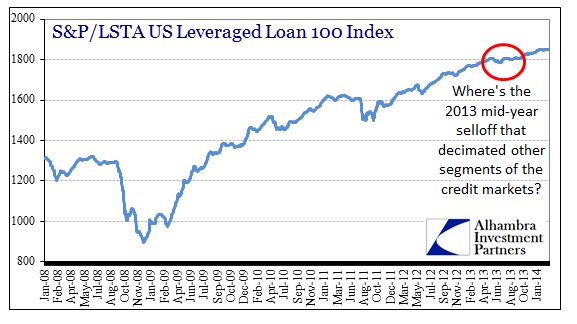
I have commented before on the behavior of leveraged loan pricing, this cycle’s version of subprime. Leveraged loans are syndicated loans to “low quality” corporate borrowers, the bank loan equivalent of a junk bond. That covenants are being removed almost as fast as these loans can be written is another piece of that asset price-risk inversion. In fact, nothing screams bubble more particularly than when the riskiest asset classes are fully and totally insulated from everything else – a cone of rationalization that serves to cleave any fundamental pressure from consideration of value and context.

ABOOK Mar 2014 Credit Markets Lev Loans

Where leveraged loan pricing was continually “reaching for yield”, you can’t make the same generalization about small cap stocks – yet the pricing pattern is consistent in both.

ABOOK Mar 2014 Valuations Small Cap

That would seem to suggest that perceptions of risk are common in those classes, particularly with regard to the systemic reset of interest rates and dollar funding in the middle of 2013 that had no larger imprint in either. Again, the inversion here between expectations for risky assets and those elsewhere is more than conspicuous. “Everyone” wants to be in on leveraged loans and small cap stocks, but at the same time is more than cautious about UST and MBS?

As if that weren’t suspicious on its own, any review of valuations would only add to the cause. Bloomberg yesterday noted the valuation comparison of certain small cap indices to the dot-com mania.

As prices surged and earnings increased at a slower rate than analysts anticipated, smaller companies have become more expensive than they’ve been 86 percent of the time since 1995, according to data compiled by Bloomberg. The Russell 2000 is trading for 49 times reported earnings, compared with a multiple of 39 in March 2000.

First note that the leading sentence above indicates the primary problem, namely that prices are surging but earnings are not. That is the only way to reach such extremes in valuations, particularly in the very unflattering comparison with what is universally acknowledged as a bubble period. Taken together, all this means is that there is not a “reach for yield” inasmuch as a total disregard of risk as it is classically understood; a “reach for risk.” In the context of monetary “control”, that is as intended – but only to a degree.

When the riskiest pieces are in such demand that there is no perturbation in price history then how does that not obtain the definition of a bubble market? In the past two bubbles, dot-coms and housing, this was known widely as “mania”, or more precisely an overriding fear of missing out. That inversion of investment concerns is what describes the price behavior I detail here – where fear of missing out is greater than any considerations of loss. That is a full measure (or two) beyond what the Fed had intended, simply to push investors into risk assets after the 2008 panic. That “push” is no longer applicable, as it has been replaced by a self-fulfilling rush.

Admitting as much in these discrete asset segments perhaps does not make it generally applicable. In that same Bloomberg article, the author makes it plain that there may be a divergence between small cap and overall equities. Immediately following the passage I cited above is this qualifier:

The S&P 500 has a price-earnings ratio of 17.2, close to its average since 1937, data compiled by Bloomberg and S&P show.

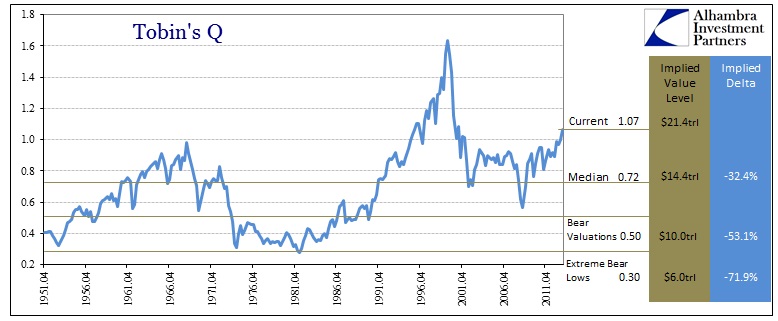
The only way that number is true is if they use pro forma earnings per share rather than reported earnings. Applying actual earnings, the PE on the S&P 500 is greater than 19, well above the median of 14.5 (using Shiller data stretching back to 1871). But as we have noted previously, the various and sundry methods of valuing stocks in historical context show exactly this kind of overextension. In historical terms, we see a broader market that is very much in comparison with only the dot-coms.

Shiller CAPE ImpliedTobin ImpliedStocks to GDP Implied

Just to revert back to median conditions would require a decline in prices comparable to some of the worst “bear market” movements (or a dramatic surge in earnings which, given the economic context, is increasingly less likely; particularly since we have already experienced such a surge in the years after 2009).

In totality, the only way to end up in such a state is these combinations of factors. That now risk is totally inverted is the height of rationalizations taking hold inside “rational” expectations. I completely understand the urge to fight against this analysis, as the alternative of bliss is far more comforting and reassuring, thus the overall appeal of rationalizing how $1 trillion in leveraged loans and junk bonds per year aren’t really dangerous, how small cap stocks are “supposed” to be valued as such, larger companies should be valued on what companies think they earned and might earn in the future rather than what actually happened, and that with all the “stimulus” there can’t possibly be a reversal. Yet that illusion of control applies to both sides – if monetary policy has indeed overdone the upside, why is there any reasonable expectation for control in reverse? History of leverage, particularly built toward policy, is not kind in that regard, as in the immutable dynamics of all social creation.

The price behavior above screams mania, as when small cap stocks and leveraged loan prices move in narrow-channeled and uninterrupted ascent. Unless someone has repealed not just the basis of basic finance, but the laws governing complex systems, this will end as all previous iterations have. What we can surmise is that the growing sense of rationalizations and the stretching of them to fit increasingly extreme conditions are but echoes of past “exuberance” and warnings to be heeded.

See the original article >>

Does Our System Select for Incompetent Sociopaths?

by Charles Hugh Smith

What is the shelf life of a system that rewards confidence-gaming sociopaths rather than competence?

Let's connect the dots of natural selection and the pathology of power.
In his 2012 book The Wisdom of Psychopaths: What Saints, Spies, and Serial Killers Can Teach Us About Success, author Kevin Dutton described how the attributes of sociopathology are in a sense value-neutral: the sociopathological attributes that characterize a dangerous criminal may also characterize a cool, high-performing neurosurgeon.
As Dutton explains in his essay What Psychopaths Teach Us about How to Succeed(Scientific American):

Psychopaths are fearless, confident, charismatic, ruthless and focused. Yet, contrary to popular belief, they are not necessarily violent. Far from its being an open-and-shut case--you're either a psychopath or you're not--there are, instead, inner and outer zones of the disorder: a bit like the fare zones on a subway map. There is a spectrum of psychopathy along which each of us has our place, with only a small minority of A-listers resident in the “inner city.”
While there is obviously a place for high-functioning sociopaths in professions which reward those characteristics, what about sociopaths who substitute deviousness and deception for competence? For some context, let's turn to the Pathology Of Power by Norman Cousins, published in 1988.
Cousins was particularly concerned with the National Security State, a.k.a. the military-industrial complex, which at that point in U.S. history was engaged in a Cold War with the Soviet Empire. Cousins described the pathology of power thusly:
"Connected to the tendency of power to corrupt are yet other tendencies that emerge from the pages of the historians:
1. The tendency of power to drive intelligence underground;
2. The tendency of power to become a theology, admitting no other gods before it;
3. The tendency of power to distort and damage the traditions and institutions it was designed to protect;
4. The tendency of power to create a language of its own, making other forms of communication incoherent and irrelevant;
5. The tendency of power to set the stage for its own use.

In broader terms, we might add: the tendency of power to manifest hubris, arrogance, bullying, deception and the substitution of rule by Elites for rule of law.

Natural selection isn't only operative in Nature; it is equally operative in human organizations, economies and societies. People respond to whatever set of incentives and disincentives are present. If deceiving and conning others is heavily incentivized, while integrity and honesty are punished, people will gravitate to running cons and embezzlement schemes.
What behaviors does our Status Quo reward? Misrepresentation, obfuscation, legalized looting, embezzlement, fraud, a variety of cons, gaming the system, deviousness, lying and cleverly designed deceptions.
Let's connect the pathology of power and the behaviors selected by our Status Quo. What we end up with is a system that selects for a specific category of sociopaths: those whose only competence is in running cons.
No wonder we have a leadership that is selected not for competence but for deviousness. What's incentivized in our system is spinning half-truths and propaganda with a straight face and running cons that entrench the pathology of power.
What is the shelf life of a system that rewards confidence-gaming sociopaths rather than competence? Unless we change the incentives and disincentives, the system is doomed.

See the original article >>

World Bank warns of risks for Russia's economy

By NATALIYA VASILYEVA

MOSCOW (AP) — The World Bank warned Wednesday that Russia's economy could contract this year if the country is hit with more serious sanctions following its annexation of Crimea.

The organization said in its annual report that it expects the Russian economy to grow 1.1 percent this year if the fall-out from the Crimean crisis is short-lived, but warned of a 1.8 percent fall if Russia is hit with more serious sanctions than those already specified.

So far, the sanctions have been fairly limited and haven't touched on Russia's vital economic interests. The United States and the European Union have imposed travel bans and asset freezes on two dozen Russians who are believed to be close to Putin.

The World Bank said Russia's economic problems are not just to do with the recent events in Ukraine. Last year, Russia grew 1.3 percent, its lowest growth in the past 13 years barring the downturn-hit 2009.

The bank blamed the lack of structural reforms for the downturn. In the past, it said the economy's structural deficiencies were "masked by a growth model based on large investment projects ... fueled by sizeable oil revenues."

The developments in Crimea, it added, "compounded the lingering confidence problem into a confidence crisis and more clearly exposed the economy weakness of this growth model."

Investors have certainly grown jittery of late — recent figures suggest that Russia suffered roughly $70 billion of capital outflow in the first three months of the year, which is more than in all of 2013. Russian monetary officials, however, insisted that they would not be introducing capital controls to stem the flight.

See the original article >>

Not Going Up ≠ Falling

by Greg Harmon

People talk about the stock market as if it is subject to the Laws of Physics. Specifically what goes up must come down. That is just wrong. In fact the S&P 500 has provided a Compounded Annual Growth Rate (CAGR) of over 10% since 1970. What goes up does not have to go down. So why do pundits, reporters and traders think that because the market is not going higher every day that it must fall? Maybe the problem is we have all become so accustom to the world of instant gratification that our investment timeframes are now too short. If you are making your trading decisions solely on a 5 minute chart you will likely need to change your mind several times per day. I doubt that will keep you happy in the long run, but it will keep your broker happy.

You see it in the Dow Theory discussion, where a new high in the Transports must be confirmed by a new high in the Industrials to continue the uptrend. The key words there are ‘continue the uptrend.’ And from the current price action it would ‘continue’ from a consolidation. There is no ‘down’ involved there. Not yet anyway. In fact the market is trading well above the 200 day Simple Moving Average (SMA) and is even above the 50 day SMA. These are generally bullish signals.

spy d

You see it in discussions of PE ratios that are ‘too high’ or future earnings expectations that are ‘unsustainable’. When did those ever matter to the price of stocks and the level of the market. Yes you can tell me that PE ratios capped before prior falls but be prepared to all provide how long they continued to rise and how long they were deemed to be too high. The chart of PE ratios below seems to show that the current level is not even in the prior danger zone, much less anywhere near the two prior peaks.

pe ratios

The market will tell you when it is going lower. Look for a lower low. Not sideways movement. Not non-confirmation of a continuation higher (what does that even mean?). Not PE ratios that are rising. Until then you do not have to buy stocks (but I will selectively) but you certainly should not be selling them. Adjust your stops, like you should in any market, keep vigilant, but most of all remember Not Going Up ≠ Falling.

See the original article >>

Follow Us