Sunday, March 23, 2014

China’s Minsky Moment?

By: John_Mauldin

In speeches and presentations since the end of last year, I have been saying that I think the biggest macro problem in the world today is China. China has run up a huge debt, and the payments are coming due. They seem to be proactive, but will it be enough? How much risk do they pose for the global system?

This week as I travel to Cafayate I have asked my young associate Worth Wray to write up his research and our conversations on China. Worth has lived in China; and with his (and my) access to people with their fingers on the pulse of China, he has come up with some valuable insights. The hard part for him was to keep it in a single letter. China is a such a huge topic that writing about it can easily yield a tome.

I am lucky to have enticed Worth to come to work with me. He is extraordinarily talented and insightful as an economist, has the boundless energy of youth (which means he seemingly doesn’t sleep), and spent the last five years deep in one of the best training grounds that a young analyst could have. He brings his own extensive Rolodex to our organization. In the not too distant future, we plan to start writing a joint letter on portfolio design and construction, translating the macro insights we have into real-world portfolios that can inform your own investing. Lots of I’s to dot and T’s to cross, but we are making progress.

I am delighted to be able to bring a talent like Worth to your attention. So let’s let him talk China to us and see where it takes us. [Note: as I do the final edits here in Cafayate, I see that Worth did an outstanding job of bringing the data together and making the story understandable. You want to take the time to read this!]

A Front-Row Seat

By Worth Wray

Before I teamed up with John last July, I worked as the portfolio strategist for an $18 billion money manager in Houston, TX that, among its other businesses, co-managed (with an elite team of investors from the university endowment world) one of the largest registered funds of funds in the United States.

For a bright-eyed kid from South Louisiana, it was a life-changing experience. I had a front-row seat for every investment decision in a multi-billion-dollar portfolio for almost five years; and along with my colleagues and mentors in Texas, North Carolina, New York, Shanghai, and Singapore, I had the chance to meet and interact with a long list of the most sought-after hedge fund, private equity, and venture capital teams. I often found myself in the same room with honest-to-god legends like Kyle Bass, John Paulson, JC Flowers, and Ken Griffin … and I forged lasting some friendships with their portfolio managers and analysts.

As you can imagine, the information flow was addictive. I spent thousands of hours poring over manager letters from six continents, doing my best to connect the global macro dots ahead of the markets and coming up with question after question for everyone who would return my calls. That experience plugged me in to an enduring network of truly independent thinkers, forced me to see the world from an entirely different perspective, and put me in an ideal position to figure out what it takes to navigate the unprecedented (not to say strange) investment challenges posed by a “Code Red” world.

Sometimes, combing through a mountain of manager letters felt like reading the newspaper years in advance. I remember watching with amazement as a free-thinking global macro investor named Mark Hart made a fortune for his investors by shorting US subprime mortgages and then shifted his focus to what he argued would be the next shoe to drop – a series of sovereign defaults across the Eurozone.

Mark explained how the launch of a common currency had allowed historically riskier borrowers like Portugal, Ireland, Italy, Spain, and France to issue sovereign debt for the same borrowing cost as Germany did… without any kind of fiscal union to justify the common rates. The resulting debt splurge led to a big increase in fiscal debts, drove an unwarranted rise in unit labor costs across the southern Eurozone, and essentially activated a ticking time bomb at the very foundations of the euro system. It seemed obvious that rates would eventually diverge to reflect the relative credit risks of the borrowers, but the market didn’t seem to care until it got very bad news from Athens. We all know what happened next.

Just as Mark and his team at Corriente Advisors had predicted, spreads blew out in Greece, then in Ireland, then in Portugal, then in Spain… and it now appears that Italy and France are veering toward a similar fate. When the euro crisis finally broke out, my colleagues and I were waiting for it, because Mark had already walked us through his playbook for a multi-act global debt drama.

Instead of blowing up in spectacular fashion, the Eurozone crisis has taken far longer to resolve than a lot of investors and economists expected (Mark, John, and myself included); but the euro’s survival thus far has been largely the result of extensive Realpolitik and an increasingly hollow narrative from Mario Draghi and the ECB laying claim to the wherewithal to “do whatever it takes” to preserve the single-currency system. Meanwhile, as Corriente understood, the likelihood of major defaults across the Eurozone rises every day that the ECB does the bare minimum to resist France’s and Italy’s slide toward deflation. It’s not over until the fat lady sings.

The point I am trying to make is that Mark saw the fundamental imbalances behind the global financial crisis in time to launch a dedicated fund in 2006, and he saw the root causes of the ongoing European debt crisis in time to launch a dedicated fund in 2007… precisely because he thinks of the global economy as one interconnected system peppered with a series of unstable and still unresolved debt bubbles. Mark is one of the most forward-thinking investors I have ever met and one of the best in recent decades at spotting the big imbalances that spell T-R-O-U-B-L-E.

I can’t tell you if he will be right about the next phase of the global debt drama. Predicting the actions and reactions of elected and unelected officials is next to impossible in a Code Red world, but some people have an eye for fundamental imbalances. And since Mark has been largely right in identifying the major debt bubbles that have plagued the world since 2007, John and I can’t comfortably ignore his warning.

As Carmen Reinhart and Kenneth Rogoff argued in their still-authoritative history of financial boom and bust over the past eight hundred years, “When an accident is waiting to happen, it eventually does. When countries become too deeply indebted, they are headed for trouble. When debt-fueled asset price explosions seem too good to be true, they probably are.”

The Bubble That Is China

Following his prescient calls on the subprime debacle and the European debt crisis, Mark identified in 2010 another source of instability that he warned could shake the global economy. And it took me by surprise. He warned that China was in the “late stages of an enormous credit bubble,” and he projected that the economic fallout when that bubble burst could be “as extraordinary as China’s economic outperformance over the last decade.”

To my knowledge, Mark Hart and his team at Corriente were the first of many global macro managers to anticipate a hard landing in the People’s Republic of China. Mark argued that the Middle Kingdom would land very hard indeed, popping speculative bubbles in the property and stock markets, sending foreign capital flying out the door, and triggering a rapid collapse in the renminbi … and even if the Chinese government could manage its economy away from a deflationary bust, they would be forced to devalue the renminbi to do so. In other words, Mark saw a much lower renminbi under almost every outcome.

It was a mind-blowing concept to me that the main driver of global growth (at the time) could not only implode but even drag the rest of the world down with it.

I can’t share the original Corriente China presentation with you for legal reasons, but here are a few public notes published by the Telegraph’s Louise Armistead after she attended one of Mark’s presentations in November 2010. These may look like obvious observations today, the sort you can find plastered all across the internet, but very few people were actually paying attention four years ago. And the data has only gotten worse since 2010 as rampant credit growth and insidious shadow lending have continued to fuel greater and greater capital misallocation.

In the presentation, which amounts to a devastating attack on the prevailing belief that China is an engine for growth, the financier argues that ‘inappropriately low interest rates and an artificially suppressed exchange rate’ have created dangerous bubbles in sectors including:

Raw materials: Corriente says China has consumed just 65pc of the cement it has produced in the past five years, after exports. The country is currently outputting more steel than the next seven largest producers combined – it now has 200m tons of excess capacity, more that the EU and Japan's total production so far this year.

Property construction: Corriente reckons there is currently an excess of 3.3bn square meters of floor space in the country – yet 200m square metres of new space is being constructed each year.

Property prices: The average price-to-rent ratio of China's eight key cities is 39.4 times – this figure was 22.8 times in America just before its housing crisis. Corriente argues: “Lacking alternative investment options, Chinese corporates, households and government entities have invested excess liquidity in the property markets, driving home prices to unsustainable levels.” The result is that the property is out of reach for the majority of ordinary Chinese.

Banking: As with the credit crisis in the West, the banks’ exposure to the infrastructure credit bubbles isn’t obvious because the debt is held in Local Investment Companies – shell entities which borrow from Chinese banks and invest in fixed assets. Mr Hart reckons that ‘bad loans will equal 98pc of total bank equity if LIC-owned, non-cashflow-producing assets are recognised as non-performing.’

The result is that, rather than being the ‘key engine for global growth’, China is an ‘enormous tail-risk’.

(Louise Armistead, The Telegraph,Hedge fund manager Mark Hart bets on China as the next ‘enormous credit bubble’ to burst.” Nov. 29, 2010)

The markets may damn well prove Mark right, along with a host of other managers who either jumped on his bandwagon or reached the same conclusions independently; but it seemed downright crazy in 2010 to think that the main driver of global growth could abruptly become its biggest threat within a few short years.

On a personal note, I obsessed over China’s culture, economy, and political system for years in college and then witnessed the country’s transformation firsthand during my time at Shanghai’s Fudan University in the summer of 2007. Then and later, I marveled at China’s strength relative to the developed world and the seemingly invincible central government’s ability to keep the economy chugging along with credit growth and fixed investment while it hoped for the return of its developed-world customers then mired in the Great Recession.

It wasn’t what I wanted to hear … but I had to accept that Mark could be right. He had clearly identified a major imbalance which has continued to worsen over the last few years, and now we are just waiting for the next shoe to drop.

Four years later, Chinese production is slowing in the shadow of a massive credit bubble and in the face of aggressive reforms.

Disappointing investment returns are revealing broad-based capital misallocation; property prices are cooling (relative to other countries); and commodity stockpiles are mounting.

With China’s new policy of allowing defaults (historically, China’s default rate has been 0%), there is a real risk that follow-on events could spin out of control, raising nonperforming loan ratios and sparking a panic as bank capital is significantly eroded.

In the meantime, the renminbi is trading down, most likely due to an intentional effort by the People’s Bank of China to aid in the slow unwinding of leveraged trade finance.

Now the signs of a Chinese slowdown (and thus a global one, as the world is geared to 8% Chinese growth) are clear, and people around the world are meeting uncertainty with emotion. With that in mind, let’s dig into the data that really matters and try to get to the heart of China’s dilemma.

China’s Minsky Moment?

“China is like an elephant riding a bicycle. If it slows down, it could fall off, and then the earth might quake.” – James Kynge, China Shakes the World

After 30 years of sustained economic growth topping 8% and a successful bank cleanup in 2000, the People’s Republic was well on its way to blowing through the “middle income trap” and transitioning to a more advanced consumption-based economy. But then in 2008 the banking crisis in the United States abruptly ushered in a painful era of balance sheet repair across the developed world and delivered a demand shock to emerging markets. Rather than allow the Chinese economy to fall into recession at such an inconvenient time, the Party leadership sprang into action to stimulate demand with its largest fiscal deficit in more than 60 years and to mobilize bank lending with historically low interest rates and enormous liquidity injections.

As you can see in the charts above, China’s total debt-to-GDP (including estimates for shadow banks) grew by roughly 20% per year, from just under 150% in 2008 to nearly than 210% at the end of 2012 … and continued rising in 2013. Even more ominous, corporate debt has soared from 92% in 2008 to 150% today against the expectation that China’s government would always backstop defaults. That makes Chinese corporates the most highly levered in the world and more than twice as levered as US corporates, just as  corporate defaults are happening for the very first time in more than 60 years.

By another measure, China has accounted for more than $15 trillion of the $30 trillion in worldwide credit growth over the last five years, bringing Chinese bank assets to roughly $24 trillion (2.5x Chinese GDP) and prompting London Telegraph columnist Ambrose Evans-Pritchard to tweet John and me a short message: “China riding tail of $24 trillion credit tiger. Tiger will eat Maoists.” And to that, I would respond that I hope the tiger doesn’t find its way to France. (You can follow John and Worth on Twitter at @JohnFMauldin and @WorthWray.)

Looking further into the debt problem, China is steadily incurring more and more credit for less and less growth – suggesting that the newer debt is less productive because it is being put to unproductive uses – as you can see in Chart 2 above. That explains why many analysts believe China’s official reported nonperforming loan ratio of 1% is more like 11% – or more than 20% of GDP.

See the original article >>

The Euro Is Not Overvalued Nor Is Any Other Currency

By: MISES

Frank Hollenbeck writes: A common argument for dumping the Euro is that it is overvalued, and that the ECB (European Central Bank) is unwilling to correct this so-called “problem.” This overvaluation is regularly cited as being over 10 percent against the dollar. The Swiss central bank surrendered control of its money supply by fixing its currency at 1.2 against the Euro essentially on the notion that its currency was “overvalued.” Advocates of a Euro breakup consider that a country with its own currency can then follow an independent monetary policy ensuring a competitive exchange rate. Never mind that neither the USA nor Great Britain have improved by following aggressive monetary policies that have depreciated their currencies. Such policies have also forced other countries, such as Brazil, to retaliate.

A general acceptance of the principles of the flexible (exchange rate) standard must therefore result in a race between the nations to outbid one another. At the end of this competition is the complete destruction of all nations’ monetary systems.
The idea that a currency can be overvalued or undervalued comes from the theoretical concept of purchasing power parity (PPP): the idea that the exchange rate should reflect the ability to purchase the same basket of goods in either currency.
For example, suppose gold is selling for $1,000 in New York and 1,000 euros in Paris, and the exchange rate is 1.3 dollars to the euro. The adherent of PPP theory would note that this situation would soon end due to the reality of arbitrage. For example, you could buy an ounce of gold in New York, bring it to Paris and sell it for 1,000 euros, then convert your euros into dollars and make a $300 profit. Arbitrage is like finding a $100 on the sidewalk. It can happen, but not often or for very long. The price of gold would rise in New York, fall in Paris, or the exchange rate would adjust. Since gold is priced in dollars worldwide and the market for foreign exchange is large, the price in Paris would normally drop to 800 euros. The exchange rate of 1.3 reflects the ratio of the price of gold in New York divided by the price of gold in Paris.
According to many economists who subscribe to the theory of purchasing power parity, if the above scenario is true for gold, the same can be true of all other goods. So, according to PPP theory, the exchange rate, between dollars and euros for example, is the ratio of all prices in the USA against prices in Europe. This is where the exchange rate should be: i.e., based on the “fundamentals.” Any deviation is seen as an overvaluation or undervaluation of the currency.
There are some major problems with this assertion. Although arbitrage can be used for gold, it cannot be used for all goods. You cannot arbitrage a hamburger or a haircut between countries. Purchasing power parity cannot be applied to non-traded goods. Yet, it also cannot be used for many traded goods. The price of a steak you eat in a Manhattan hotel overlooking the city will not be the same price, adjusted by the exchange rate, as the steak eaten at a stop-and-go restaurant on a major highway near Paris. If you consider the consumption of a good not just the product but the convenience, environment, and a multitude of other factors, only a few traded goods, such as gold or oil, fit into the arbitrage definition necessary for purchasing power parity. What exactly is the price of a loaf of bread — when the same loaf can be sold at different prices — from the supermarket to the restaurant to the gas station of the same neighborhood? They are the same product but other attributes make them different as perceived by consumers and therefore cannot be arbitraged.

The Economist magazine publishes twice yearly the Big Mac Index (video) which measures the “over- or undervaluation of a currency. Of course, the price of a hamburger has more to do with the cost of labor and rent than with the cost of the bun, meat, or pickles in a Big Mac. It is also a non-traded good, so we should not expect arbitrage to force uniformity in prices across countries or regions. The Economist is trying to sell magazines, so it is justified in being less than precise. However, professional economists should not be using this index, or any index, to identify a currency as undervalued or overvalued. In reality, such statements are total nonsense.
The value of a currency, as reflected in the exchange rate, is determined by supply and demand. The price of rice is not overvalued nor is the price of apples undervalued. Such a statement would be considered idiotic for rice or apples, but is considered justified for exchange rates. Equilibrium exists where the quantity demanded is equal to the quantity supplied. No one is overpaying or underpaying. To suggest that someone is indeed “overpaying” implies the buyer is irrational. It is sad to see economists in central banks, like the Swiss central bank, incapable of drawing obvious conclusions about exchange rates from such simple concepts as supply and demand.
Economists should banish the words overvaluation or undervaluation from their vocabularies when talking about currencies. These terms should also be stricken from international finance textbooks. The euro is not overvalued, nor should faulty logic be used as an argument to dismantle it.

See the original article >>

Oil Limits And The Economy - One Story; Not Two

by Gail Tverberg

The two big stories of our day are:

(1) Our economic problems: The inability of economies to grow as rapidly as they would like, add as many jobs as they would like, and raise the standards of living of citizens as much as they would like. Associated with this slow economic growth is a continued need for ultra-low interest rates to keep economies of the developed world from slipping back into recession.

(2) Our oil related-problems: One part of the story relates to too little, so-called “peak oil,” and the need for substitutes for oil. Another part of the story relates to too much carbon released by burning fossil fuels, including oil, leading to climate change.

While the press treats these issues as separate stories, they are in fact very closely connected, related to the fact that we are reaching limits in many different directions simultaneously. The economy is the coordinating system that ties together all available resources, as well as the users of these resources. It does this almost magically, by figuring out what prices are needed to keep the system in balance—how much materials of which types are needed, given what consumers can afford to pay.

The catch is that the economic system is not infinitely flexible. It needs to grow, to have enough funds to (sort of) pay back debt with interest and to make good on all the promises that have been made, such as Social Security.

Energy use is very closely tied to economic growth. When energy consumption becomes slow-growing (or high-priced—which  is closely tied to slow-growing), it pulls back on economic growth. Job growth becomes more difficult, and governments find it difficult to get enough funding through tax revenue. This is the situation we have been experiencing for the last several years.

We might think that governments would be aware of these issues and would alert their populations to them.  But governments either don’t understand these issues, or only partially understand them and are frightened by the prospect of what is happening. The purpose of my writing is to try to explain what is happening in terms that people who are used to reading the Wall Street Journal or Financial Times can understand.

I am not an economist, so I can’t speak to the question of what economists are saying. I do know that what economists say tends to change from time to time and from researcher to researcher. For example, in 2004, the International Energy Agency prepared an analysis with the collaboration of the OECD Economics Department and with the assistance of the International Monetary Fund Research Department (Full Report, Summary only). That report said, “.  . . a sustained $10 per barrel increase in oil prices from $25 to $35 would result in the OECD as a whole losing 0.4% of GDP in the first and second year of higher prices. Inflation would rise by half a percentage point and unemployment would also increase.” This finding is consistent with the issues I am concerned about, but I expect that not all economists would agree with it. Oil prices are now around $100 per barrel, not $35 per barrel.

The Tie of Oil and Other Forms of Energy to the Economy

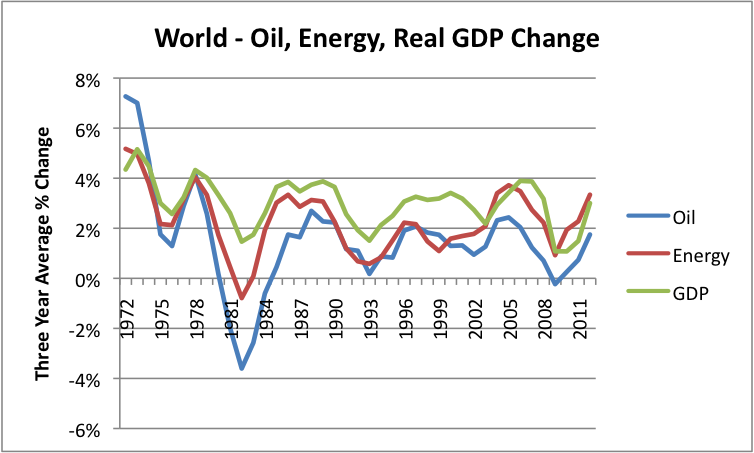
Oil and other forms of energy are used to power the economy. Historically, rises and falls in the use of oil and other types of energy have tended to parallel GDP growth (Figure 1).

Figure 1. Growth in world GDP, compared to growth in world of oil consumption and energy consumption, based on 3 year averages. Data from BP 2013 Statistical Review of World Energy and USDA compilation of World Real GDP.

Figure 1. Growth in world GDP, compared to growth in world of oil consumption and energy consumption, based on 3 year averages. Data from BP 2013 Statistical Review of World Energy and USDA compilation of World Real GDP.

There is disagreement as to which is cause and which is effect—does GDP growth lead to more oil and energy demand, or does the availability of cheap oil and other types of energy power the economy? In my view, the causality goes both ways. Oil and other types of energy are needed for economic growth. But if people cannot afford oil or other types of energy products, typically because they don’t have jobs, then energy use will drop. And if oil prices drop too low, we will be in real trouble because oil production will stop.

How Oil Limits Work

People tend to think of limits as working in the same manner as having a box with a dozen eggs. Once the last egg is gone, we are out of luck. Or a creek dries up from lack of rainfall. The water is no longer available, so we have lost our water source.

With the benefit of the economy, though, limits are more complicated than this. If we live in today’s economy, we can purchase another box of eggs if we run short of eggs, assuming markets provide eggs at a price we can afford. If the creek runs dry, we can figure out a different approach to getting water, such as buying bottled water or hiring a tanker to get water from a source at a distance and bringing it to where it is needed.

Oil limits are a kind of limit we often hear concerns about. Being able to drill oil wells at all and refine the oil into products of many kinds requires a complex economy, one that can educate engineers working in oil extraction and can build paved roads, pipelines, and refineries. The economy needs to be able to produce high tech equipment using raw materials from around the world. Thus, there must be an operating financial system that allows buyers at one end of the globe to purchase materials from the other end of the globe, and sellers to have the confidence that they will be paid for contracted products.

If a company wants to extract oil, it can almost always figure out places where this theoretically can be done. If a company can gather together all of the things it needs—trained workers; enough high tech extraction equipment of the right type; enough pollution-fighting equipment, to prevent oil spills and spills of radioactive water; and leases on land where drilling is to done, then, in theory, oil can be extracted.

In fact, the big issue is whether the extraction can be done in a sufficiently cost-effective manner that the whole economic system can be supported. Even if the cost of extraction “looks” fairly cheap, such as in Iraq, or in some of the older installations elsewhere in the Middle East, the vast majority of the revenue that is generated from oil extraction (often as much as 90%) goes to support the government of the country where the oil is extracted (Rogers, 2014). This revenue is needed for many purposes: desalination plants to provide water for the people; food subsidies, especially when oil prices are high because food prices will tend to be high as well; new ports and other infrastructure; and revenue to provide jobs and programs to pacify the people so that the government will not be overtaken by revolt.

A major issue at this point is the fact that most of the easy-to-extract oil is already under development, so companies that want to develop new projects need to move on to locations that are more difficult and expensive to extract (Bloomberg, 2007). According to oil industry consultant Steven Kopits, the cost of one major category of oil production expenses increased by an average of 10.9% per year between 1999 and 2013. In the period between 1985 and 1999, these same expenses increased by 0.9% per year (Kopits, 2014) (Tverberg, 2014).

When production costs are higher, someone loses out. It is as if the economy is becoming less and less efficient. It takes more people, more energy products, and more equipment to produce the same amount of oil. This leaves fewer people and less energy products to produce the goods and services that people really want, putting a squeeze on the economy. The economy tends to grow less quickly because part of the goods and services available are being channeled into less productive operations.

The situation of the economy becoming less and less efficient at producing oil is called diminishing returns. A similar problem exists with fresh water in many parts of the world. We can extract more fresh water, but it takes deeper wells. Or we have to ship in water from a distance, using a pipeline or trucks. Or we need to use desalination. Water is still available but at a higher per-gallon price.

Diminishing Returns is Like a Treadmill that Runs Faster and Faster

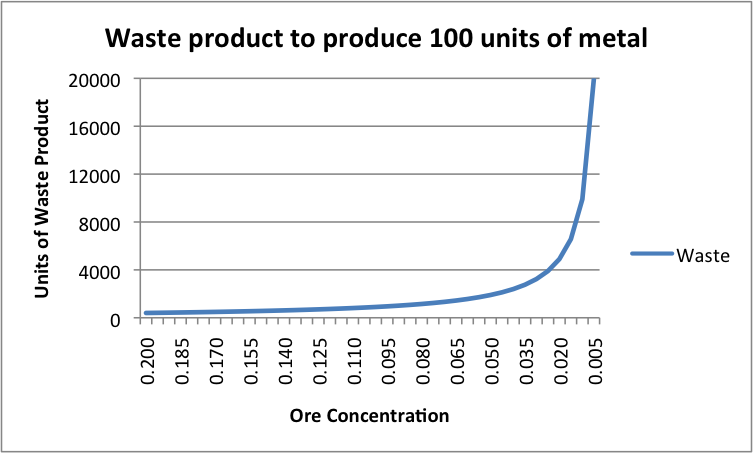
There are many ways we can reach diminishing returns. One easy-to-illustrate example relates to mining metals. We usually extract the cheapest-to-extract ores first. An important cost consideration is how much waste material is mixed in with the metal we really want–this determines the ore “grade.” As we are gradually forced to move from high-grade ores to lower-grade ores, the amount of waste material grows slowly at first, then dramatically increases (Figure 2).

Figure 2. Waste product to produce 100 units of metal

Figure 2. Waste product to produce 100 units of metal

We know that this kind of effect is happening right now. For example, the SRSrocco Report indicates that between 2005 and 2012, diesel consumption per ounce of refined gold has doubled from 12.7 gallons per ounce to 25.8 gallons per ounce, based on the indications of the top five companies. Such a pattern suggests that if we want to extract more gold, the price of gold will need to rise.

The economy is affected by all of the types of diminishing returns that are taking place (oil, fresh water, several kinds of metals, and others). Even attempting to substitute “renewables” for nuclear and fossil fuels electricity production acts as a type of diminishing returns, if such substitution raises the cost of electricity production, as it seems to in Germany and Spain.

If the total extent of diminishing returns is not very great, increased efficiency and substitution can act as workarounds. But if the combined effect becomes too great, diminishing returns acts as a drag on the economy.

Oil Increases are Already Higher than the Economy Can Comfortably Absorb

For oil, we can estimate the historical impact of increased efficiency and substitution by looking at the historical relationship between growth in GDP and growth in oil consumption. Based on the worldwide data underlying Figure 1, this has averaged 2.0% to 2.4% per year since 1970, depending on the period studied. Occasional years have exceeded 3%.

The problem in recent years is that increases in the cost of oil production have been much higher than 2% to 3%. As mentioned previously, a major portion of oil extraction costs seem to be increasing at 10.9% per year. To make this comparable to inflation adjusted GDP increases, the 10.9% increase needs to be adjusted (1) to take out the portion related to “overall inflation” and (2) to adjust for likely lower inflation on the portion of oil production costs not included in Kopits’ calculation. Even if this is done, total oil extraction costs are probably still increasing by about 5% or 6% per year—higher than we have historically been able to make up.

According to Kopits, we are already reaching a point where oil limits are constraining OECD GDP growth by 1% to 2% per year (Kopits, 2014) (Tverberg, 2014). Efficiency gains aren’t happening fast enough to allow GDP to grow at the desired rate.

A major concern is that the treadmill of rising costs will speed up further in the future. If it is hard to keep up now, it will be even harder in the future. Also, the economy “adds together” the adverse effects of diminishing returns from many different sources—-higher electricity cost of production, higher metal cost of production, and the higher cost of oil production. The economy has to increasingly struggle because wages don’t rise to handle all of these increased costs.

As one might guess, when economies hit diminishing returns on resources that are important to the economy, the results aren’t very good. According to Joseph Tainter (1990), many of these economies have collapsed.

Why Haven’t Governments Told Us About these Difficulties?

The story outlined above is not an easy story to understand. It is possible that governments don’t fully understand today’s problems. It is easy to focus on one part of the story such as, “Shale oil extraction is rising in response to higher oil prices,” and miss the important rest of the story—the economy cannot really withstand high oil (and water and electricity and metals) prices. The economy tends to contract in response to a need to use so many resources in increasingly unproductive ways. We associate this contraction with recession.

We have many researchers looking at these issues. Unfortunately, most of these researchers are focused on one small portion of the story. Without understanding the full picture, it is easy to draw invalid conclusions. For example, it is easy to get the idea that we have more time for substitution than we really have. Financial systems are fragile. The world financial system almost failed in 2008, after oil prices spiked. We are still in very worrisome territory, with many countries continuing a policy of Quantitative Easing and ultra low interest rates. We may have only a few months or a year or two left for substitution, not 40 or 50 years, as some seem to assume.

Of course, if governments do understand the worrisome nature of our current situation, they may not want to say anything. It could make the situation worse, if citizens start a “run on the banks.”

The other side of the issue is that if governments and citizens don’t understand the full story, they may inadvertently do things that will make the situation worse. They certainly won’t be looking long and hard at what collapse might look like in the current context and what can be done to mitigate its impacts.

See the original article >>

Shifting focus in the treasury markets

by SoberLook.com

Treasuries once again experienced what amounts to a sharp curve flattening in recent days. The market action resembled what took place after the initial announcement of taper back in December (see post). The yields in the "belly" of the curve have risen sharply as the market prepares for rate "normalization".

Treasury yield moves from close of 3/7/2014 to close of 3/21/2014

MarketWatch: - The yield curve’s violent reaction to the Federal Reserve on Wednesday shouldn’t be thought of as a first-day fluke by Chairwoman Janet Yellen. Rather, the rise of intermediate-term Treasury yields is one step in a monetary policy normalization process that will characterize the rest of the year, according to mammoth investment management firm BlackRock.
If last year was all about longer-duration Treasury yields moving higher — the 10-year Treasury yield rose more than a full percentage point and now trades at 2.78% – this year is all about the rise at the front end of the curve, according to Rick Rieder, chief investment officer of Fundamental Fixed Income for BlackRock.
“I think this is a very different year for managing fixed income,” he said in a press briefing Thursday.
The MarketWatch article proceeds to describe in detail how rates had moved this year vs. last year. It all however comes down to a single chart which shows daily treasury yield volatility across the curve this vs. last year. A picture is worth, well you know...

Market focus is shifting from taper to the near-term trajectory of the overnight rates, which is impacting the intermediate and shorter maturities. The first rate hike, while still some time away, is becoming a reality.

See the original article >>

How China Imported A Record $70 Billion In Physical Gold Without Sending The Price Of Gold Soaring

by Tyler Durden

A little over a month ago, we reported that following a year of record-shattering imports, China finally surpassed India as the world's largest importer of physical gold. This was hardly a surprise to anyone who has been following our coverage of the ravenous demand for gold out of China, starting in September 2011, and tracing it all the way to the present.

China's apetite for physical gold, which is further shown below focusing just on 2012 and 2013, has been estimated by Goldman to amount to over $70 billion in bilateral trade between just Hong Kong and China alone.

Yet while China's gold demand is acutely familiar one question that few have answered is just what is China doing with all this physical gold, aside from filling massive brand new gold vaults of course. And a far more important question: how does China's relentless buying of physical not send the price of gold into the stratosphere.

We will explain why below.

First, let's answer the question what purpose does gold serve in China's credit bubble "Minsky Moment" economy, where as we showed previously, in just the fourth quarter, some $1 trillion in bank assets (mostly NPLs and shadow loans) were created  out of thin air.

For the answer, we have to go back to our post from May of 2013 "The Bronze Swan Arrives: Is The End Of Copper Financing China's "Lehman Event"?", in which we explained how China uses commodity financing deals to mask the flow of "hot money", or the one force that has been pushing the Chinese Yuan ever higher, forcing the PBOC to not only expand the USDCNY trading band to 2% recently, but to send the currency tumbling in an attempt to reverse said hot money flows.

One thing deserves special notice: in 2013 the market focus fell almost exclusively on copper's role as a core intermediary in China Funding Deals, which subsequently was "diluted" into various other commodities after China's SAFE attempted a crack down on copper funding, which only released other commodities out of the Funding Deal woodwork. We discussed precisely this last week in "What Is The Common Theme: Iron Ore, Soybeans, Palm Oil, Rubber, Zinc, Aluminum, Gold, Copper, And Nickel?"

We emphasize the word "gold" in the previous sentence because it is what the rest of this article is about.

Let's step back for a minute for the benefit of those 99.9% of financial pundits not intimate with the highly complex concept of China Commodity Funding Deals (CCFDs), and start with a simple enough question, (and answer.)

Just what are CCFDs?

The simple answer: a highly elaborate, if necessarily so, way to bypass official channels (i.e., all those items which comprise China's current account calculation), and using "shadow" pathways, to arbitrage the rate differential between China and the US.

As Goldman explains, there are many ways to bring hot money into China. Commodity financing deals, overinvoicing exports, and the black market are the three main channels. While it is extremely hard to estimate the relative share of each channel in facilitating the hot money inflows, one can attempt to "ballpark" the total notional amount of low cost foreign capital that has been brought into China via commodity financing deals.

While commodity financing deals are very complicated, the general idea is that arbitrageurs borrow short-term FX loans from onshore banks in the form of LC (letter of credit) to import commodities and then re-export the warrants (a document issued by logistic companies which represent the ownership of the underlying asset) to bring in the low cost foreign capital (hot money) and then circulate the whole process several times per year. As a result, the total outstanding FX loans associated with these commodity financing deals is determined by:

the volume of physical inventories that is involved

commodity prices

the number of circulations

A "simple" schematic involving a copper CCFDs saw shown here nearly a year ago, and was summarized as follows.


As we reported previously citing Goldman data, the commodities that are involved in the financing deals include copper, iron ore, and to a lesser extent, nickel, zinc, aluminum, soybean, palm oil, rubber and, of course, gold. Below are the desired features of the underlying commodity:

  • China is heavily reliant on the seaborne market for the commodity
  • the commodity has relatively high value-to-density ratio so that the storage fee and transportation cost are relatively low
  • the commodity has a long shelf life, so that the underlying value of the commodity will not depreciate significantly during the financing deal period
  • the commodity has a very liquid paper market (future/forward/swap) in order to enable effective commodity price risk hedging.

Here we finally come to the topic of gold because gold is an obvious candidate for commodity financing deals, given it has a high value-to-density ratio, a well-developed paper market and very long "shelf life." Curiously iron ore is not as suitable, based on most of these metrics, and yet according to recent press reports seeking to justify the record inventories of iron ore at Chinese ports, it is precisely CCFDs that have sent physical demand for iron through the proverbial (warehouse) roof.

Gold, on the other hand, is far less discussed in the mainstream press in the context of CCFDs and yet it is precisely its role in facilitating hot money flows, perhaps far more so than copper and even iron ore combined, that is so critical for China, and explains the record amount of physical gold imports by China in the past three years.

Chinese gold financing deals are processed in a different way compared with copper financing deals, though both are aimed at facilitating low cost foreign capital inflow to China. Specifically, gold financing deals involve the physical import of gold and export of gold semi-fabricated products to bring the FX into China; as a result, China’s trade data does reflect, at least partially, the scale of China gold financing deals. In contrast, Chinese copper financing deals do not need to physically move the physical copper in and out of China as explained last year so it is not shown in trade data published by China customs.

In detail, Chinese gold financing deals includes four steps:

  1. onshore gold manufacturers pay LCs to offshore7 subsidiaries and import gold from bonded warehouses or Hong Kong to mainland China – inflating import numbers
  2. offshore subsidiaries borrow USD from offshore banks via collaterizing LCs they received
  3. onshore manufacturers get paid by USD from offshore subsidiaries and export the gold semi-fabricated products to bonded warehouses – inflating export numbers
  4. repeat step 1-3

This is shown in the chart below:

As shown above, gold financing deals should theoretically inflate China’s import and export numbers by roughly the same size. For imports, they inflate China’s total physical gold imports, but inflate exports that are mainly related to gold products, such as gold foils, plates and jewelry. Sure enough, the value of China’s imports of gold from Hong Kong has risen more than 10 fold since 2009 to roughly US$70bn by the end of 2013 while exports of gold and other products have increased by roughly the same amount (shown below). This is in line with the implication of the flow chart on Chinese gold financing deals: the deals inflate both imports and exports by roughly equal size.

Given this, that the rapid growth of the market size of gold trading between China and Hong Kong created from 2009 (less than US$5bn) to 2013 (roughly US$70bn) is most likely driven by gold financing deals.

However, a larger question remains unknown, namely that as Goldman observes, "we don’t know how many tons of physical gold are used in the deals since we don’t know the number of circulations, though we believe it is much higher than that for copper financing deals."

Recall the flowchart for copper funding deals:

  1. Step 1) offshore trader A sells warrant of bonded copper (copper in China’s bonded warehouse that is exempted from VAT payment before customs declaration) or inbound copper (i.e. copper on ship in transit to bonded) to onshore party B at price X (i.e. B imports copper from A), and A is paid USD LC, issued by onshore bank D. The LC issuance is a key step that SAFE’s new policies target.
  2. Step 2) onshore entity B sells and re-exports the copper by sending the warrant documentation (not the physical copper which stays in bonded warehouse ‘offshore’) to the offshore subsidiary C (N.B. B owns C), and C pays B USD or CNH cash (CNH = offshore CNY). Using the cash from C, B gets bank D to convert the USD or CNH into onshore CNY, and trader B can then use CNY as it sees fit.
  3. Step 3) Offshore subsidiary C sells the warrant back to A (again, no move in physical copper which stays in bonded warehouse ‘offshore’), and A pays C USD or CNH cash with a price of X minus $10-20/t, i.e. a discount to the price sold by A to B in Step 1.
  4. Step 4) Repeat Step 1-Step 3 as many times as possible, during the period of LC (usually 6 months, with range of 3-12 months). This could be 10-30 times over the course of the 6 month LC, with the limitation being the amount of time it takes to clear the paperwork. In this way, the total notional LCs issued over a particular tonne of bonded or inbound copper over the course of a year would be 10-30 times the value of the physical copper involved, depending on the LC duration.

In other words, the only limit on the amount of leverage, aka rehypothecation of copper, was limited only by letter of credit logistics (i.e. corrupt bank back office administrator efficiency), as there was absolutely no regulatory oversight and limitation on how many times the underlying commodity can be recirculated in a CCFD.... And gold is orders of magnitude higher!

Despite the uncertainty surrounding the actual leverage and recirculation of the physical, Goldman has made the following estimation:

We estimate, albeit roughly, that there are c.US$81-160 bn worth of outstanding FX loans associated with commodity financing deals – with the share of each commodity shown in Exhibit 23. To put it into context, the commodity-related outstanding FX borrowings are roughly 31% of China’s short-term FX loans (duration less than 1 year) .

Putting the estimated role of gold in China's primary hot money influx pathway, at $60 billion notional, it is nearly three time greater than the well-known Copper Funding Deals, and higher than all other commodity funding deals combined!

Under what conditions would Chinese commodity financing deals take place. Goldman lists these as follows:

  • the China and ex-China interest rate differential (the primary source of revenue),
  • CNY future curve (CNY appreciation is a revenue, should the currency exposure be not hedged),
  • the cost of commodity storage (a cost),
  • the commodity market spread (the spread is the difference between the futures
  • China’s capital controls remain in place (otherwise CCFD would not be necessary).

All of these components are exogenous to the commodity market, except one – the commodity market spread. This reveals an important point that financing deals are, in general, NOT independent of commodity market fundamentals. If the commodity market moves into deficit, or if the financing demand for the commodity is greater than its finite supply of above ground inventory, the commodity market spread adjusts to disincentivize financing deals by making them unprofitable (thus making the physical inventory available to the market).

Via ‘financing deals’, the positive interest rate differential between China and ex-China turns commodities such as copper from negative carry assets (holding copper incurs storage cost and financing cost) to positive carry assets (interest rate differential revenue > storage cost and financing cost). This change in the net cost of carry affects the spreads, placing upward pressure on the physical price, and downward pressure on the futures price, all else equal, making physical-future price differentials higher than they otherwise would be.

* * *

That bolded, underlined sentence is a direct segue into the second part of this article, namely how is it possible that China imports a mindblowing 1400 tons of physical, amounting to roughly $70 billion in notional, demand which under normal conditions would send the equilibrium price soaring, and yet the price not only does not go up, but in fact drops.

The answer is simple: the gold paper market.

And here is, in Goldman's own words, is an explanation of the missing link between the physical and paper markets. To be sure, this linkage has been proposed and speculated repeatedly by most, especially those who have been stunned by the seemingly relentless demand for physical without accompanying surge in prices, speculating that someone is aggressively selling into the paper futures markets to offset demand for physical.

Now we know for a fact. To wit from Goldman:

From a commodity market perspective, financing deals create excess physical demand and tighten the physical markets, using part of the profits from the CNY/USD interest rate differential to pay to hold the physical commodity. While commodity financing deals are usually neutral in terms of their commodity position owing to an offsetting commodity futures hedge, the impact of the purchasing of the physical commodity on the physical market is likely to be larger than the impact of the selling of the commodity futures on the futures market. This reflects the fact that physical inventory is much smaller than the open interest in the futures market. As well as placing upward pressure on the physical price, Chinese commodity financing deals ‘tighten’ the spread between the physical commodity price and the futures price .

Goldman concludes that "an unwind of Chinese commodity financing deals would likely result in an increase in availability of physical inventory (physical selling), and an increase in futures buying (buying back the hedge) – thereby resulting in a lower physical price than futures price, as well as resulting in a lower overall price curve (or full carry)." In other words, it would send the price of the underlying commodity lower.

We agree that this may indeed be the case for "simple" commodities like copper and iron ore, however when it comes to gold, we disagree, for the simple reason that it was in 2013, the year when Chinese physical buying hit an all time record, be it for CCFD purposes as suggested here, or otherwise, the price of gold tumbled by some 30%! In other words, it is beyond a doubt that the year in which gold-backed funding deals rose to an all time high, gold tumbled. To be sure this was not due to the surge in demand for Chinese (and global) physical. If anything, it was due to the "hedged" gold selling by China in the "paper", futures market.

And here we see precisely the power of the paper market, where it is not only China which was selling specifically to keep the price of the physical gold it was buying with reckless abandon flat or declining, but also central and commercial bank manipulation, which from a "conspiracy theory" is now an admitted fact by the highest echelons of the statist regime. and not to mention market regulators themselves.

Which answers question two: we now know that of all speculated entities who may have been selling paper gold (since one can and does create naked short positions out of thin air), it was likely none other than China which was most responsible for the tumble in price in gold in 2013 - a year in which it, and its billionaire citizens, also bought a record amount of physical gold (much of its for personal use of course - just check out those overflowing private gold vaults in Shanghai.

* * *

This brings us to the speculative conclusion of this article: when we previously contemplated what the end of funding deals (which the PBOC and the China Politburo seems rather set on) may mean for the price of other commodities, we agreed with Goldman that it would be certainly negative. And yet in the case of gold, it just may be that even if China were to dump its physical to some willing 3rd party buyer, its inevitable cover of futures "hedges", i.e. buying gold in the paper market, may not only offset the physical selling, but send the price of gold back to levels seen at the end of 2012 when gold CCFDs really took off in earnest.

In other words, from a purely mechanistical standpoint, the unwind of China's shadow banking system, while negative for all non-precious metals-based commodities, may be just the gift that all those patient gold (and silver) investors have been waiting for.  This of course, excludes the impact of what the bursting of the Chinese credit bubble would do to faith in the globalized, debt-driven status quo. Add that into the picture, and into the future demand for gold, and suddenly things get really exciting.

See the original article >>

Saturday, March 22, 2014

Control your risk with simple and winning rules - Free trading alert for 24 March

Super Stocks Trading Report
Latest Free Trading Alerts for 24 March
Open position value at 21 March $ 14,592.67 2014 P/L   +4.33%
Mixed long/short open position
Today no new entry orders
We stopped at breakeven on PG, at Stop Loss on WMT (Daily pos.)
5 Open Positions 
3 Long 
2 Short 
4 with Stop Loss at breakeven
In true signal service, attachments reports are shipped to customers also via email, in the evening after the markets close. Those who wish to receive them during the demo, please send me their email address.

I simulated 25% margining and modified initial  capital to $ 500K


Super Stocks Trading Report For 24 March
We are happy to offer free signal service for Super Stocks until the end of March
Please send me your email address so I can invite you on my server to do the demo. Mail me to take the offer and start the free service until the end of March michele.giardina@quantusnews.com
Material in this post does not constitute investment advice or a recommendation and do not constitute solicitation to public savings. Operate with any financial instrument is safe, even higher if working on derivatives. Be sure to operate only with capital that you can lose. Past performance of the methods described on this blog do not constitute any guarantee for future earnings. The reader should be held responsible for the risks of their investments and for making use of the information contained in the pages of this blog. Trading Weeks should not be considered in any way responsible for any financial losses suffered by the user of the information contained on this blog.

Follow Us