Wednesday, March 12, 2014

Reaching for Yield: Worth the Risk?

By AllianceBernstein

Investors seeking more robust returns in a lower-interest-rate environment often look to high-yield bonds for answers. But it’s critical that they don’t reach too far down the credit spectrum in search of higher yields—as tempting as it may be.

High Yield’s Slippery Slope
We’re currently in the stable phase of the credit cycle—characterized by companies’ solid financial health—and we anticipate that we’re still years away from increasing defaults becoming an issue. But that doesn’t give investors the green light to begin stretching for higher yields by investing in lower-rated credits.

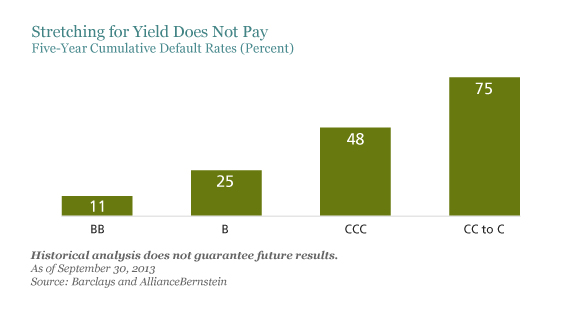
The display below shows cumulative five-year default rates, which worsen the further one slides down the credit scale. Even reaching for CCC-rated debt can put an investor in hot water and often isn’t worth the pain, as the compensation isn’t commensurate with the risk level. The extra premium investors receive is low relative to history—on top of default risk—and CCC debt is unattractively priced above par. Bottom line: avoid the yield stretch.

Distenfeld_default-rates

How Roll Can Help
During a steep-yield-curve environment in which interest rates are expected to rise, yield-curve “roll,” or a bond’s price increase as it moves closer to maturity, can act as a cushion against rising rates and declining prices. Over time, a bond’s yield progresses—or rolls—down the yield curve as its price ticks upward. Bondholders can especially benefit if interest rates rise by less than anticipated, as their bonds will likely be valued at a higher level than new issues of a comparable time frame.

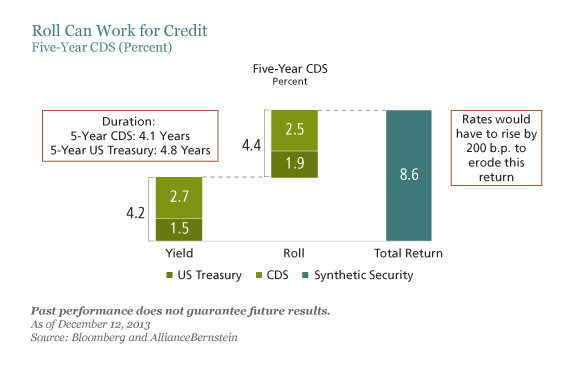
Many credit curves are particularly steep today, creating opportunities for roll. The display below shows how roll can work for a five-year corporate credit default swap (CDS). For the bond’s total return (its income and capital appreciation) to be eroded, interest rates would have to rise by 200 basis points, which is unlikely.

Distenfeld_cds-roll1

Given the current environment, we expect high yield to continue its journey for the next couple of years, and as long as investors remain wary of yield stretch, and remember that roll is on their side, they’ll have a better chance of successfully navigating the road ahead—no matter what interest rates do.

See the original article >>

Xu Shaoshi says all is well with China's economy

by SoberLook.com

China's propaganda machine went into full gear as it sets its sights on foreign economic forecasters who are continuing to profess slower economic growth for the nation. Is the West is picking on China again? Creating all this negative publicity?

People's Daily: - Among a number of foreign investment banks and international media, prophets of doom on the Chinese economy have begun to find their voices once more.
How should we view this negative publicity, and what is China's current economic situation? On March 5, Xu Shaoshi, head of the National Development and Reform Commission made clear that the Chinese economy has made a good start to the year and that future prospects are favorable. On the sidelines of the "two sessions" - the annual sessions of the National People's Congress (NPC) and the Chinese People's Political Consultative Conference (CPPCC) - reporters interviewed NPC deputies and CPPCC members.

Are the Western analysts just "prophets of doom" hyping up the China-slowdown story? While a severe recession in China remains an unlikely outcome, there is no question we are seeing PRC face some serious headwinds.
First of all it is well known that many of China's insiders, analysts working for Chinese organizations, seem to be just as bearish on China's economic expansion as their counterparts abroad. Moreover, key economic data continue to indicate that growth is below expectations - see the latest export figures for example. And while one could debate the veracity of such data due to seasonal effects and other biases, it's harder to argue with the markets. Commodities that are sensitive to China's industrial demand, particularly iron ore (see chart), steel (see chart), and copper (chart below) have been hit unusually hard. Clearly something is wrong here.

China's authorities certainly have the wherewithal to stabilize growth through either fiscal or monetary stimulus. They've done it before. The central government however has been trying to wean the country from both in order to contain the buildup of market bubbles in areas such as wealth management ($6 trillion shadow banking balance sheet), corporate credit, and real estate. And if all was well with the nation's economy, Beijing would be staying the course here.
Lately however China's central bank has become quite accommodative. It stopped appreciating the yuan - in fact the currency has been allowed to depreciate (see chart) to help the nation's exporters. It is also allowing short term rates to decline. Some of that decline is due to falling demand, as banks pull back on lending into certain sectors. Partially it is the result of PBoC injecting liquidity via unsterilized dollar purchases (yuan sales). Whatever the case, the outcome is a sharp decline in interbank rates - a loosening monetary stance.

1-week and 2-week SHIBOR

One could debate the reasons for each of these trends. But taken as a whole, it is hard to argue that it is business as usual in China - even if Xu Shaoshi made it perfectly "clear that the Chinese economy has made a good start to the year and that future prospects are favorable."

See the original article >>

Coffee – The Craziest Chart Of The Year Already

by AuthorWolf Richter

Brazil, the top producer of arabica coffee, has gotten hammered by drought. A few analysts have cut their estimates for the 2014/15 crop, with a leery eye on the 2015/16 crop. It’s not a catastrophe for the rest of the world, and there is a pretty good chance we won’t have to switch to drinking hot water.

But it was good enough for traders to nudge coffee futures up a few cents from their multi-year low of just over a buck a pound in November. In January, once the charts gave the go-ahead – among them, James Ferro of Signalinea posted his call on January 29 – traders piled in and went haywire and catapulted coffee futures to today’s high of $2.089 (before it ran out of hot air), having doubled in four months. 

To make life miserable for the rest of us coffee lovers. Our latte, espresso, or just plain good coffee is going to bite fiercely into our already mauled pocket book.

And here it is via Signalinea, a weekly chart (doesn't include today's moves) going back to 2007. Already the craziest chart of the year, though it’s just March:

So what’s next?

My beloved state of California too has been getting hammered by drought, and we produce 82% of the world's almonds, our second most valuable legal crop, after grapes, with sales of $4.4 billion in 2012. Production has doubled since 2006 to 1.9 billion pounds last year.

These almond orchards cover endless acres in the Central Valley, much of it in counties whose drought conditions have been labeled “extreme.” January and February, the middle of our rainy season, were mostly dry, after two dry years. There have been some good rains since, but still a drop in the bucket, so to speak. Growers need to irrigate their orchards with water that doesn’t exist this year.

So, in your bag, jar, or can of mixed nuts later this year and next year, watch for the magic disappearance of almonds, to be replaced with cheaper nuts to keep inflation from showing up in its ugly manner on the price sticker. And start counting the almond chips in your almond biscotti.

Another California item has jumped in price: homes. Teachers are a symbol of the middle class. In California, they earn on average $69,300 annually, fifth highest in the country. Not exactly a pittance. But it is a ludicrous pittance if they’re trying to buy a home. Read....

See the original article >>

Brazil cuts corn crop forecast, slashes soy hopes

by Agrimoney.com

Brazil revealed the first estimates of damage to its crop prospects from hot and dry weather, cutting forecast for corn and soybean production, but the downgrades failed to prevent a tumble in Chicago futures.

The Conab crop bureau cut by 280,000 tonnes to 75.2m tonnes its forecast for the domestic corn harvest this year.

And it slashed by 4.6m tonnes to 85.4m tonnes its forecast for the country's soybean harvest, ditching hopes of overtaking the US as the world's top producer of the oilseed.

The downgrades were blamed on the dry weather in southern and eastern Brazil which has fuelled a rally in prices in particular of coffee and sugar, for which Conab has yet to release updated estimates for domestic production.

In fact, Wednesday's revisions, while for soybeans putting Conab amongst the most pessimistic forecasters, failed to support Chicago prices of the oilseed, which tumbled 2.4% to $13.78 3/4 a bushel for May delivery in morning deals on talk of Chinese cancellations of import orders.

'Scarcity of rains'

Conab cut forecasts for soybean crops in all five regions of the country.

But the downgrade was particularly severe in the south, where in Parana, the country's second biggest soy producing state, "practically since the time of planting , the crop was severely affected by the lack of rainfall and high temperatures," the bureau said.

In Rio Grande do Sul, Conab warned that "pest attacks" had been "intensified in recent weeks by the scarcity of rains".

Further north, the crop in Goiás "was strongly influenced by climate, with low rainfall, associated with pest and disease attacks".

However, excess rains had proven a problem in Mato Grosso do Sul, slowing harvesting, Conab said.

Main vs safrinha

For corn, Conab raised the estimate for the second, or safrinha, crop, which is sown after the soybean harvest, by more than 900,000 tonnes to 43.8m tonnes, citing a boost from a recovery in prices.

However, the upgrade was more than offset by a 1.2m tonnes cut, to 31.4m tonnes, in the estimate for output from the so-called main crop because of the dry weather.

"Many crops were penalised by the scarcity of rainfall occurring in December, January and February," Conab said, terming this a "crucial" period for crop development in bringing pollination and early grain growth.

While, in its commentary, Conab failed to highlight any losses to coffee and sugar, it did cut its forecast for soybean production in Sao Paulo, the top cane growing state, by 9%, citing "climatic adversities".

The estimate for soybean production in Minas Gerais, the top coffee growing state, was slashed by 12% to 3.31m tonnes.

See the original article >>

The Big Debt Binge

by Pater Tenebrarum

Government Debt Soars Into Stratosphere

We had a global financial crisis in 2008 that was widely acknowledged to be the result of an unmitigated credit bubble egged on by loose central bank policy after the  peak of the tech mania in 2000. Of course, central banks themselves did not acknowledge their responsibility. According to Ben Bernanke, it wasn't the suppression of administered interest rates that set off the credit bubble that collapsed so spectacularly in 2008. Instead it was a 'lack of regulation'. Right. We wonder if Mr. Bernanke would be interested in acquiring a certain bridge in Brooklyn?

So what did our vaunted policy makers decide to do to battle the effects of the expired credit bubble? Simple, they did what they always do: they replaced it with an even bigger one. How much bigger has recently been revealed by the quarterly BIS review.

As Bloomberg informs us: “Debt Exceeds $100 Trillion as Governments Binge”.

A few excerpts:

“The amount of debt globally has soared more than 40 percent to $100 trillion since the first signs of the financial crisis as governments borrowed to pull their economies out of recession and companies took advantage of record low interest rates.

The $30 trillion increase from $70 trillion between mid-2007 and mid-2013 compares with a $3.86 trillion decline in the value of equities to $53.8 trillion, according to the Bank for International Settlements and data compiled by Bloomberg. The jump in debt as measured by the Basel, Switzerland-based BIS in its quarterly review is almost twice the U.S. economy.

Borrowing has soared as central banks suppress benchmark interest rates to spur growth after the U.S. subprime mortgage market collapsed and Lehman Brothers Holdings Inc.’s bankruptcy sent the world into its worst financial crisis since the Great Depression. Yields on all types of bonds, from governments to corporates and mortgages, average about 2 percent, down from more than 4.8 percent in 2007, according to the Bank of America Merrill Lynch Global Broad Market Index.”

“Given the significant expansion in government spending in recent years, governments (including central, state and local governments) have been the largest debt issuers,” said Branimir Gruic, an analyst, and Andreas Schrimpf, an economist at the BIS. The organization is owned by central banks and hosts the Basel Committee on Banking Supervision, which sets global capital standards.

In the six-year period to mid-2007 global debt outstanding doubled from $35 trillion, according to data compiled by BIS.

Marketable U.S. government debt outstanding has soared to a record $12 trillion, from $4.5 trillion in 2007, according to U.S. Treasury data compiled by Bloomberg. Corporate bond sales globally surged during the period, with issuance totaling more than $21 trillion, Bloomberg data show.”

(emphasis added)

Just to get this straight: in the six years to 2007, global debt doubled from $35 trillion to $70 trillion. This debt expansion seemed to stop in its tracks when the bubble imploded in 2008. In the six years since then, another $30 trillion in debt has been added.

In other words, in a span of just 12 years, global outstanding debt went from $35 trillion to $100 trillion. Keep in mind though that this refers only to debt that exists in the form of securities. Given that the most recent debt expansion consists mainly of government debt expansion, we know for a fact that much of this debt is unproductive. The funds have simply been consumed.

Here is a chart from the BIS report illustrating the situation:


BIS-Debt Bubble

The global credit bubble. There are now about $100 trillion in debt securities outstanding worldwide – click to enlarge.


Admittedly, while this debtberg was built, money has lost a lot of its purchasing power, so it is not as large as it appears on a nominal basis. There may well be additional and possibly quite discontinuous losses in the exchange value of money at some point going forward, given the huge expansion in the money supply witnessed all over the world.

Where to From Here?

There is zero evidence that this debt growth has had any positive effect on economic growth – rather the opposite. The global debt binge can be said to have gone into overdrive from 1971 onward, when Nixon decided to 'temporarily' default on the US gold obligation according to the Bretton Woods agreement. Ever since, real economic growth in the developed nations has been much lower than in the post war decades preceding the default, when debt growth was far more subdued (because it was at least a little bit constrained by the gold exchange standard). Moreover, given that outstanding debt has  roughly tripled over the past twelve years, we can conclude that such large debt growth is in fact extremely detrimental to the real economy's performance. Obviously, economic growth in developed nations has been completely underwhelming over this time span.

We should add here, the size of the debt as such is not the decisive point in this context. If the debt represented genuine savings and had been invested productively, its size should not worry us. However, we know that the impetus for this debt expansion has come from the artificial suppression of interest rates by central banks and we therefore know for a fact that much of this debt has not been employed productively. On the contrary, it has likely led to vast growth in capital malinvestment. Of course there is no question that there was e.g. enormous malinvestment in housing in numerous nations (and continues and/or has resumed in many more). We would argue though that there exist a number of less obvious instances of malinvestment that simply await their eventual unmasking.

Below is another chart from the BIS report, which shows the ratio of bank lending to total private sector funding in selected countries. We can infer from this chart that the total debtberg is a good size bigger than that represented by debt securities alone.


Bank credit-to-total-funding ratio
Bank lending in selected countries relative to total private sector debt funding – click to enlarge.


The BIS notes that this ratio depends on a number of factors, such as the legal tradition of the country concerned (and the protection it affords arms-length third party investors), the types of businesses doing the borrowing (whether or not they have assets that can easily be pledged as collateral) and the average size of businesses (smaller ones are more likely to borrow from banks).

Another interesting and not very surprising finding is that in 'normal' recessions (i.e. fairly mild downturns), access to credit remains more open in countries in which bank lending predominates, whereas in financial crises, the more market-based credit systems turn out to be superior. Here is an interesting excerpt:

“Banks and markets also behave differently when it comes to moderating business cycle fluctuations. In “normal” downturns, relationship banks, especially well capitalised ones, find it easier to keep lending than markets do.

Drawing on their long-term relationships with clients, banks are more inclined to offer credit during a downturn. By contrast, transaction lenders, who do not invest in information about the borrower, typically pull back during a recession.

However, a financial crisis can impair banks’ shock-absorbing capacity. When banks are under strain, they are less able to help their clients through difficult times.

In addition, during a financial crisis, banks may put off necessary balance sheet restructuring: instead, they may opt to roll over credit in an effort to postpone loss recognition (so-called zombie lending). This is something that capital market investors cannot afford to do. In a financial crisis, therefore, systems that are more market-oriented may speed up the necessary deleveraging, thereby paving the way for a sustainable recovery.”

(emphasis added)

Intuitively, this rings true, especially considering the recent experiences in the euro area. However, while euro area banks have been a bit lackadaisical in terms of deleveraging and strengthening their capital (this does not mean they have done nothing – they most certainly have), there are other signs that the liquidation of malinvested capital that has occurred in Europe was more intense than elsewhere.  There has furthermore at least been a token attempt at braking government debt growth and instituting economic reform. However, as our readers know, we are of the opinion that it has been done the wrong way (by trying to squeeze the private sector while leaving the government sector largely untouched) and that the reforms have not even remotely gone far enough.

The question is though where this enormous expansion in largely unproductive debt will lead. As far as we can tell, the tendency is for this growth to continue, with only temporary slowdowns occurring from time to time. However, it is a mathematical certainty that debt growth cannot exceed real economic growth forever and ever, regardless of how low interest rates (and the associated debt service costs) are. This is not least so because real wealth generation is impeded by too low interest rates. Hence, the ability to service debt is perforce declining, even while the debtberg continues to increase. It is therefore not possible to 'outgrow' the debt accumulation. That is just not going to happen.

Also, Japan's example demonstrates the inescapable fact that even if interest rates remain at rock bottom levels, once a certain threshold is crossed, the sheer size of the debtberg becomes so daunting that debt service costs begin to inexorably rise anyway. Then one arrives in the Land of pure Ponzi finance, which is where Japan's government already finds itself today.

Conclusion:

In the long run, there are only two realistic ways in which this situation can be resolved: either there is a wave of defaults at some point (which would likely strain the ability of governments to protect depositors to the breaking point and would therefore have deflationary implications), or there is a 'flight forward', i.e., an attempt to 'solve' the debt problem via inflation – by a policy that deliberately aims at 'unanchoring' inflation expectations.

This is surely not something Western central banks would like to do, as they would risk their own destruction if the process 'gets away' from them. Sometimes though, we don't get what we want, but what we deserve. No-one knows when the strong demand for money and the continued improvement in the productivity of certain sectors of the economy that have kept the price effects of monetary inflation largely confined to financial markets and non-tradable services will give way to a declining demand for money. All we know for certain is that the supply of money has been vastly increased, but we cannot know a priori at what point it will affect the demand for money. There probably exists a threshold for this as well though, and once it is crossed, central banks may find that it is not so easy to put the genie back into the bottle. This is especially so as it seems likely that  the pressure to provide easy money will continue on account of political contingencies. Besides, governments can always commandeer central banks by revoking or restricting their nominal independence.

All of this seems a distant prospect today, but all it will take is a big enough financial and economic emergency. Then a lot of things can change in a hurry.

See the original article >>
Is It a Bubble Yet?

by Pater Tenebrarum

Warning Signs Proliferate Again

One of the best illustrations that we are in an unmitigated and absolutely frantic financial bubble is the recent rally in fuel cell stocks. Yesterday, PLUG (Plug Power), a stock that traded at a mere 15 cents last year, finally fell sharply from its high above $11,70 (yes, it has risen by about 77 times in a few short months) after Citron Research remarked that nothing – absolutely nothing – has actually changed at the company.

According to Marketwatch:

“Plug Power shares traded at their highest in five years, and the stock was the second most active in U.S. markets in early trading Tuesday.

Then Andrew Left of Citron Research came out and said Plug Power PLUG -1.16% shares would be fairly valued at 50 cents. Shares of Plug were recently down 25%. “It’s a casino stock, “the lowest form of speculative moonshot,” Left said in a note Tuesday. There are no profits, no unique technology, and the end of government subsidies looms, he added.

Nothing has changed in the year since the stock traded at 15 cents. “Revenue for the 9 months ended September 30, 2013 was $18.6 (million), vs $20.2 (million) for the prior year. Nothing more needs to be said.”

(emphasis added)


PLUG bubble-1The PLUG mini-bubble – click to enlarge.


Not only is this type of action highly reminiscent of the spring of 2000, it also turns out that the reason behind the moonshot is the fact that various companies are trying to avail themselves of federal subsidies by engaging in what are plainly uneconomic investments (if they were economic, they would not require subsidies):

“The contracts that have propelled Plug Power to stardom? Big companies such as Wal-Mart and FedEx are after the federal tax credits for renewable energy, Left said. That particular punchbowl, however, is likely to be taken away in a couple of years, he added.”

(emphasis added)

That particular punchbowl is indeed likely to be taken away.  For one thing, it is unaffordable and for another, global warming has stopped 17 years and 5 months ago (and counting). This is notwithstanding the fact that the political and bureaucratic elites continue to propagate the 'climate change' meme sotto voce at every opportunity.

Leveraged Loans, Penny Stocks and Profitless IPOs

Sentimentrader has posted a few updates recently that show that financial froth is quite out of bounds by now. For instance, the share of IPOs of money losing companies over the past six months has soared back to the highs last seen at the top of the technology mania in 2000. A full 74% of all IPOs issued over the past half year were in companies that are making losses. The securities of such companies bereft of income of course all tend to soar right after they hit the market.

In another update, it was pointed out that the value of trading in penny stocks has soared to a multi-year high:


Penny Stocks

Penny stock trading soars - click to enlarge.


Admittedly, a similar spike in 2013 subsided quickly and didn't turn out to mean anything, but since then there have been several intermittent spikes, and their frequency has clearly increased. At some point it will mean something (just because something has not had meant much so far does not mean it never will).

However, the soaring issuance of leveraged loans really takes the cake. This is a chart to make even hardened bubble-heads dizzy. It is especially noteworthy how the current surge compares to the surge in 2007, shortly before the last bubble peaked. Nothing remotely comparable has ever been seen before. It is a mirror image of record junk bond issuance and the mania for high yielding debt in general (whereby 'high yielding' these days actually means 'not yielding very much').


Leveraged Loans

Leveraged loan issuance goes bananas – click to enlarge.

See the original article >>

Follow Us