By Gail Tverberg
What do diminishing returns, energy return on energy invested (EROI or EROEI), and collapse have to do with each other? Let me start by explaining the connection between Diminishing Returns and Collapse.
Diminishing Returns and Collapse
We know that historically, many economies that have collapsed were ones that have hit “diminishing returns” with respect to human labor–that is, new workers added less production than existing workers were producing (on average). For example, in an agricultural economy, available land might already have as many farmers as the land can optimally use. Adding more farmers might add a little more production–perhaps the new workers would keep weeds down a bit better. But the amount of additional food the new workers would produce would be less than what earlier workers were producing, on average. If new workers were paid on the basis of their additional food production, they would find that their wages dropped relative to those of the original farmers.
Lack of good paying jobs for everyone leads to a need for workarounds of various kinds. For example, swamp land might be drained to add more farmland, or irrigation ditches might be added to increase the amount produced per acre. Or the government might hire a larger army might to conquer more territory. Joseph Tainter (1990) talks about this need for workarounds as a need for greater “complexity.” In many cases, greater complexity translates to a need for more government services to handle the problems at hand.
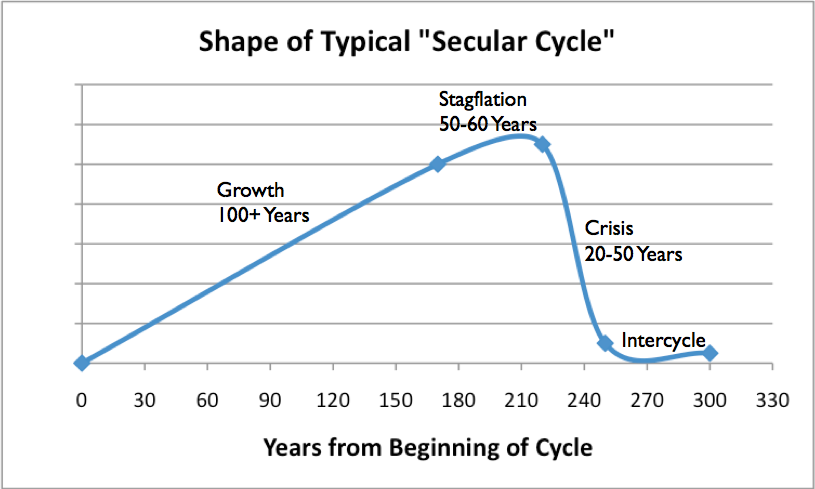
Turchin and Nefedof (2009) in Secular Cycles took Tainter’s analysis a step further, analyzing financial data relating to historical collapses of eight agricultural societies in operation between the years 30 B.C. E. and 1922 C. E.. Figure 1 shows my summary of the pattern they describe.
 Figure 1. Shape of typical Secular Cycle, based on work of Peter Turkin and Sergey Nefedov.
Typically, a civilization developed a new resource which increased food availability, such as clearing a large plot of land of trees so that crops could be planted, or irrigating an existing plot of land. The economy tended to expand for well over 100 years, as the population grew in size to match the potential output of the new resource. Wages were relatively high.
Eventually, the civilization hit a period of stagflation, typically lasting 50 or 60 years, as the population hit the carrying capacity of the land, and as additional workers did not add proportionately more output. When this happened, the wages of common workers tended to stagnate or decrease, resulting in increased wage disparity. The price of food tended to spike. To counter these problems, the amount of government services rose, as did the amount of debt.
Ultimately, what brought the civilizations down was the inability of governments to collect enough taxes for expanded government services from the increasingly impoverished citizens. Other factors played a role as well–more resource wars, leading to more deaths; impoverished common workers not being able to afford an adequate diet, so plagues were more able to spread; overthrown or collapsing governments; and debt defaults. Populations tended to die off. Such collapses took place over a long period, typically 20 to 50 years.
For those who are familiar with economic theory, the shape of the curve in Figure 1 is very similar to the production function mentioned in This Is A Debt and Energy Crisis. In fact, the three main phases are the same as well. The issue in both cases is diminishing returns ultimately leading to collapse.
There seems to be a parallel to the current world situation. The energy resource that we learned to develop this time is fossil fuels, starting with coal about 1800. World population was able to expand greatly because of additional food production permitted by fossil fuels and because of improvements in hygiene. A period of stagflation began in the 1970s, when we first encountered problems with US oil production and spiking oil prices. Now, the question is whether we are approaching the Crisis Stage as described by Turchin and Nefedov.
Why Might an Economy Collapse?
Let’s think about how an economy operates. It is built up from many parts, over time. It includes one or more governments, together with the laws and regulations they pass and together with their financial systems. It includes businesses and consumers. It includes built infrastructure, such as roads and electricity transmission lines. It even includes traditions and customs, such as whether savings are held in gold jewelry or in banks, and whether farms are inherited by the oldest son. As each new business is formed, the owners make decisions based on the business environment at that time, including competing businesses, supporting businesses, and the number of customers available. Customers also make decisions on which product to buy, based on the choices available and the prices of these products.
Over time, the economy gradually changes. Some parts of the economy gradually wither and are replaced by new parts of the system. For example, as the economy moved from using horses to cars for transportation, the number of buggy whip manufacturers decreased, as did the number of businesses raising horses for use as draft animals. Customs and laws gradually changed, to reflect the availability of automobiles rather than horses for transportation. In some cases, governments changed over time, as increased wealth allowed more generous social programs and wider alliances, such as the European Union and the World Trade Organization.
In the academic field of systems science, an economy can be described as a complex adaptive system. Other examples of complex adaptive systems include ecosystems, the biosphere, and all living organisms, including humans. Because of the way the economy is knit together, changes in one part of the system tend to affect other parts of the system. Also, because of the way the system is knit together, the system has certain requirements–requirements which are gradually changing over time–to keep the economy operating. If these requirements are not met, the economy may collapse, just as the eight economies studied by Turchin and Nefedov collapsed. In many ways such a collapse is analogous to an animal dying, or climate changing, when conditions are not right for the complex adaptive systems that they are part of.
Clearly one of the requirements that an economy has, is that it needs to be wealthy enough to afford the government services that it has agreed to. Scaling back those government services is one option, but when these services are really needed because citizens are getting poorer and finding it harder to find a good-paying job, this is hard to do. The other option, unfortunately, seems to be collapse.
The wealth of an economy is very much tied to the availability of cheap energy. A huge uplift is added to an economy when the (value added to society) by an energy resource such as oil greatly exceeds its (cost of production). Over time, the cost of production tends to rise, something measured by declining EROI. The uplift added by the difference between (value added to society) and (cost of production) is gradually lost. Some would hypothesize that the falling gap between (value added to society) and the (cost of production) can be compensated for by technology changes and improvements in energy efficiency, but this has not been proven.
Our Economy is Already in a Precarious Position
As I indicated in my most recent post, if a person computes average wages by dividing total US wages by total US population (not just those employed), the average wage has flattened in recent years as oil prices rose. Median wages (not shown on Figure 2) have actually fallen. This is the same phenomenon observed in the 1970s, when oil prices rose. This is precisely the phenomenon that is expected when there are diminishing returns to human labor, as described above.
 Figure 2. Average US wages compared to oil price, both in 2012$. US Wages are from Bureau of Labor Statistics Table 2.1, adjusted to 2012 using CPI-Urban inflation. Oil prices are Brent equivalent in 2012$, from BP’s 2013 Statistical Review of World Energy.
The reason for the flattening wages is too complicated to describe fully in this post, so I will only mention a couple of points. When consumers are forced to spend more for oil for commuting and food, they have less to spend on discretionary spending. The result is layoffs in discretionary sectors, leading to lower wage growth. Also, goods produced with high-priced oil are less competitive in the world market, if sellers try to recoup their higher costs of production. As a result, fewer of the products are sold, leading to layoffs and thus lower average wages for the economy.
In the last section, I mentioned that the economy is a complex adaptive system. Because of this, the economy acts as if there are hidden laws underlying the system, parallel to the laws of thermodynamics underlying physical systems. If oil supplies are excessively high-priced, very few new jobs are formed, and those that are created don’t pay very well. The economy doesn’t grow much, but it does stay in balance with the high-priced oil that is available.
The Government’s Role in Fixing Low Wages and Slow Economic Growth
The government ends up being the part of the economy most affected by slow economic growth and low job formation. This happens because tax revenue is reduced at the same time that government programs to help the poor and unemployed need to grow. The current approach to fixing the economy is (1) deficit spending and (2) interest rates that are kept artificially low, partly through Quantitative Easing.
The problem with Quantitative Easing is that it is a temporary “band-aid.” Once it is stopped, interest rates are likely to rise disproportionately. (See the recent Wall Street Journal editorial,” Janet Yellen’s Greatest Challenge.”) Once this happens, the economy is likely to fall into severe recession. This happens because higher interest rates lead to higher monthly payments for such diverse items as cars, homes, and factories, leading to a cutback in demand. Oil production may fall, because the cost of production will rise (because of higher interest rates), while the amount consumers have to spend on oil will fall–quite possibly reducing oil prices. If interest rates rise, the amount the government will need to collect in taxes will also rise, because interest on government debt will also rise.
So we are already sitting on the edge, waiting for something to push the economy over. The Affordable Care Act (“Obamacare”) may provide a push in that direction. Inability to pass a federal budget could provide a push as well. So could a European Union collapse. Debt defaults are another potential problem because debt defaults are likely to increase dramatically, as economic growth shrinks, as discussed in the next section.
Debt is Major Part of our Current Precarious Financial Situation
If an economy is growing, it is easy to add debt. People find it easy to find and keep jobs, so they can pay back debt. Businesses and governments find that their operations are growing, so borrowing from the future, even with interest, “makes sense.”
It is as also easy to add debt if the economy is not growing, but there is an ample supply of cheap oil that can be extracted if increasing debt can be used to ramp up demand. For example, after World War II, it was possible to ramp up demand for automobiles and trucks by allowing purchasers to use debt to finance their purchases. When this increased debt led to increased oil consumption, it greatly benefited the economy, because the (value to society) was much greater than the (cost of extraction). Governments were able to tax oil extraction heavily, and were also able to build new roads and other infrastructure with the cheap oil. The combination of new cars, trucks, and roads helped enable economic growth. With the economic growth that was enabled, paying back debt with interest was relatively easy.
The situation we are facing now is different. High oil prices–even in the $100 barrel range–tend to push the economy toward contraction, making debt hard to pay back. (This happens because we are borrowing from the future, and the amount available to repay debt in the future will be less rather than more.) The problem can be temporarily covered up with deficit spending and Quantitative Easing, but is not a long-term solution. If interest rates rise, there is likely to be a large increase in debt defaults.
The Role of Energy Return on Energy Invested (EROI or EROEI)
EROI is the ratio of energy output over energy input, a measure that was developed by Professor Charles Hall. To calculate this ratio, one takes all of the identifiable energy inputs at the well-head (or where the energy product is produced) and converts them to a common basis. EROI is then the ratio of the gross energy output to total energy inputs. Hall and his associates have shown that EROI of oil extraction has decreased in recent years (for example, Murphy 2013), meaning that we are using increasing amounts of energy of various kinds to produce oil.
In previous sections, I have been discussing diminishing returns with respect to human labor. Oil and other energy products are forms of energy that we humans use to leverage our own human energy. So indirectly, diminishing returns with respect to the extraction of oil and other energy products, as measured by declining EROI, will be one portion of the diminishing returns with respect to human labor. In fact, declining EROI may be the single largest contributor to diminishing returns with respect to human labor. This will happen if, in fact, low EROI correlates with high oil price, and high oil prices leads to diminished wages (Figure 2). This may be the case, because David Murphy (2013) indicates that the relationship between EROI and the price of oil is in fact inverse, with oil prices rising rapidly at low EROI levels.
Contributors to Declining Return on Human Labor
Human labor is the most basic form of energy. We humans supplement our own energy with energy from many other sources. It is this combination of energy from many sources that is reflected in the productivity of humans. For example, we take it for granted that we will have tools made using fossil fuels and that we will have electricity to power computers. Before fossil fuels, humans supplemented their energy with energy from animals, burned biomass, wind, and flowing water.
What besides declining EROI of fossil fuels would lead to diminishing returns with respect to human labor? Clearly, the same problems that were problems years ago continue to be problems. For example, growing world population tends to lead to diminishing returns with respect to human labor, because resources such as arable land and fresh water are close to fixed. Greater world population means that on average, each gets person less. Oil production is not rising as rapidly as world population, so the quantity available per person tends to drop as world population rises.
Soil degradation is another issue, according to David Montgomery, in Dirt: The Erosion of Civilizations(2007). Declining quality of ores for metals is another issue. The ores that are cheapest to extract are extracted first. We later move on to poorer quality ores, and ores in less accessible locations. These require more oil and other fossil fuels for extraction, leaving less for other purposes.
There are other more-modern issues as well. Growing populations in areas where water is scarce lead to the need for desalination plants. These desalination plants use huge amounts of fossil fuel resources (oil in the case of Saudi Arabia) (Lee 2010), leaving less energy resources for other purposes.
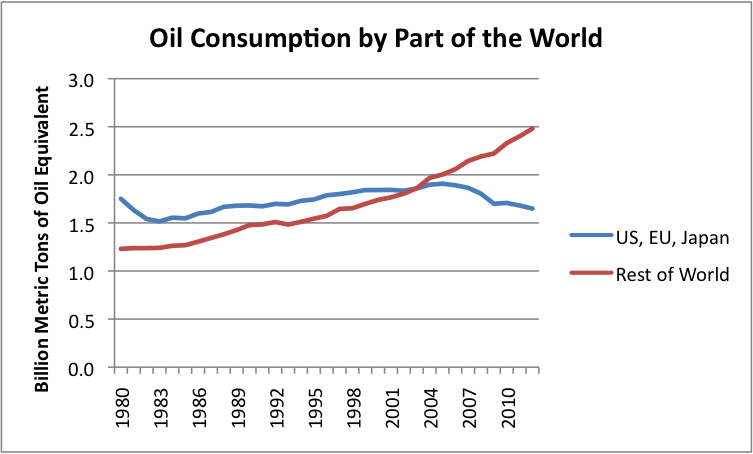
Globalization is another issue. As the developing world uses more oil, less oil is available for the part of the world that historically has used more oil per capita. The countries with falling oil consumption tend to be the ones that recently have had the most problems with recession and job loss.
 Figure 3. Oil consumption based on BP’s 2013 Statistical Review of World Energy.
An indirect part of diminishing returns with respect to human labor has to do with what proportion of the citizens is actually able to find full-time work in the paid labor force, and whether the jobs available are actually using their training and abilities. The Bureau of Labor Statistics calculates increases in output per hour of paid labor. I would argue that this is not a broad enough measure. We really need a measure of output per available full-time worker.
Obviously, there are potential offsets. We hear much about technology improvements and increased efficiency offsetting whatever other problems may occur. To me, the real test of whether there is diminishing returns with respect to human labor is how wages are trending, especially median wages. If these are not keeping up with inflation, there is a problem.
Conclusion
We don’t often think about the return on human labor, and how the return on human labor could reach diminishing returns. In fact, human labor is the most basic source of energy we have. Stagnating wages and higher unemployment of the type experienced recently by the United States, much of Europe, and Japan look distressingly like diminishing returns to human labor.
Stagnation of wages is happening despite attempts by governments to prop up the economy using deficit spending, artificially low interest rates, and Quantitative Easing. Without these interventions, the results would likely be even worse. If QE is removed, or if interest rates rise on their own, there seems to be a distinct possibility that these countries will be reaching the “crisis” phase as described by Turchin and Nefedov.
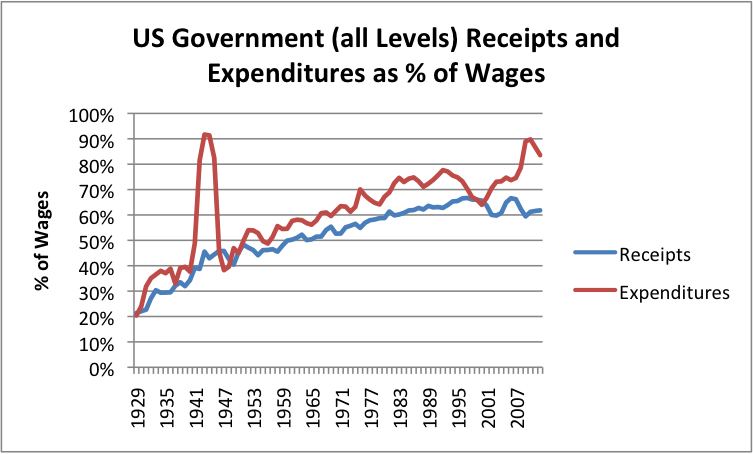
Historical experience suggests that a major danger of diminishing returns to human labor is that governments costs will rise so high, and wages will drop so low, that it will be impossible for the government to collect enough taxes from wage-earners. In fact, there seems to be evidence we are already headed in this direction. Figure 4 (below) shows that the US ratio of government spending to wages has been rising since 1929. Government receipts have leveled off in recent years.
 Figure 4. Based on Table 2.1 and Table 3.1 of Bureau of Economic Analysis data. Government spending includes Federal, State, and Local programs.
Adding more health care services under the Affordable Care Act will only increase this trend toward growing government expenditures.
One issue is how the financial benefit of human labor (together with the energy sources leveraging this labor) is split among businesses, governments, and humans. Businesses have the most control in this. If an endeavor is not profitable, they can discontinue it. If cheaper labor is available elsewhere, they can cut hold down wages in countries with higher wages. They also have the option of increased mechanization. Humans and governments both tend to get shortchanged. As the overall return of the system reaches limits, wages of humans tend to stagnate. Governments find themselves with greater and greater costs, and more and more difficulty collecting funds from increasingly impoverished citizens.
Most authors of academic articles assume that the challenge we are facing is one that can be solved over the next, say, fifty years. They also seem to believe that the fixes required are simply small adjustments to our current economy. This assumption seems optimistic, if we are really approaching financial collapse.
If we are in fact near the crisis stage described by Turchin and Nefedov, we will need to do something much closer to “start over”. We need to build a new economy that will work, rather than just “tweak” the current one. New (or radically changed) government and financial systems will likely be needed–ones that are much less expensive for taxpayers to fund. We are also likely to need to cut back on basic services, including maintaining paved roads and repairing long-distance electricity transmission lines.
Because of these changes, whole new ways of doing things will be needed. EROI analyses that have been to date represent analyses of how our current system operates. If major changes are needed, their indications may no longer be relevant. We cannot simply go backward, because methods that worked in the past, such as using draft horses and buggy whips, will no longer be available without a long development period. We are truly facing an unprecedented situation–one that is very hard to prepare for.
See the original article >>