Tuesday, July 30, 2013

Treasury bill supply hits new lows

by SoberLook

Since the beginning of the year the US treasury curve has steepened substantially, with yields on the short-end actually declining.

There are two key reasons for treasury bill rates staying at such suppressed levels.
1. In a rising rate environment, durations are cut and demand for treasury bills increases. Investors want to stay liquid without taking rate risk, and there isn't much else out there that can provide both.
2. There are simply fewer treasury bills out there. The supply of bills relative to the overall pool of treasury securities is at record lows. The US Treasury has focused on issuing more longer-term paper to lock in the ridiculously low rates that the Fed and others have been willing to take.

Source: DB

See the original article >>

Key factor driving corporate profit margins

by SoberLook

Corporate margins in the US are no longer expanding at the rate they were in the first couple of years after the recession. In fact margins are now undergoing a gradual decline.

WSJ: - Revenue at the companies that make up the Standard & Poor's 500-stock index—excluding banks, whose profits have soared—is expected to creep up by just 1.1% in the second quarter from a year earlier, according to Thomson Reuters, which melds Wall Street analysts' projections with company reports.
Earnings, meanwhile, are expected to decline 0.6%. That would be the first profit decline for nonfinancial companies since last autumn and the first time in a year that earnings grew more slowly than revenue, a sign that margin widening is petering out.
Analysts are blaming this on weak economic growth and poor business spending. Some are pointing to the end of the refinancing binge that allowed corporate treasurers to capture falling interest rates. That game is now over and lower funding costs will no longer add to margins. If we step outside the US however, most nations - particularly emerging markets - are seeing even sharper downward adjustments to margin growth.

Source: JPMorgan

According to JPMorgan, profit margins are heavily impacted by changing trends in labor productivity gains, which have declined globally. Change in profit margins is in fact proportional to the deviations from longer term growth trend in productivity. And emerging markets have seen the highest correction to that trend, resulting in higher reduction in corporate margins.

Source: The Conference Board

The US actually exhibits a relatively stable productivity trend which had accelerated right after the recession but has since declined. That's why US margins grew sharply after the recession and have been in a gradual downward drift recently. Nations such as Hungary and Russia on the other hand saw an extreme adjustment in the productivity trend, resulting in collapsing profit margins.

Source: JPMorgan

As we begin to adjust to lower profit margins for US companies, we should keep in mind that the declines are sharper for most other nations. Going forward, while business spending and interest rates will certainly have an impact, it's the labor productivity gains that will ultimately drive adjustments in corporate margins.

See the original article >>

Migrant Workers to Save China’s Growth

By tothetick

A new report published by HSBC predicts that one of the only things that might save the Chinese economy from going completely topsy-turvy in terms of economic growth will be the fact that the country has over 260 million migrant workers. Allowing them to settle in urban areas will mean that they may boost the economy. At a time when countries in the western world are still tightening their regulations on immigration, and the UK has even decided to run an ad campaign on mobile billboards around the capital telling illegal immigrants to own up or face expulsion, China might find some saving grace from the slowdown in activity from its migrants from rural areas, who up until now have been largely treated as unwanted people.

Chinese Growth: Migrants?

Chinese Growth: Migrants?

China’s growth has already slowed to just 7.5% for this second quarter this year and there are great concerns regarding the lack of liquidity and the fall in requests for loans for either small businesses or individuals in the country. Although even the growth of China at 7.5% is being brought into question and there are growing rumors that China has been faking it yet again regarding their figures. Year-over-year growth for June was at 7.5% and for the whole of 2012 growth stood at 7.8%. The predicted 7.5% for 2013 that has been put forward by the Chinese government is currently being disputed by analysts around the world. Some are suggesting that China only has a growth figure of about 3-4%! Some are saying that exports and imports that are contracting as well as trade data and price indices all point to the fact that it is impossible for there to be over 7.5% growth in Gross Domestic Product. Trade figures, for instance, serve as a prime example since June saw a decline in exports of 3.1% compared with a year ago. Imports were also down from June by 0.7% year on year, despite there having been a predicted rise of 8%.

In the report published by HSBC today, it states that China has the key to unlocking that slowdown by allowing migrant workers to settle in cities and urban areas, enabling them to transform into consumers and thus boost spending in the economy. In addition, there are expected to be some 100 million that are forecast to leave rural zones for urban areas in the next ten years and that will bring about (according to HSBC) sustained growth and labor productivity. Although looking back at our own rural exoduses that too k place long ago, perhaps the movement of large numbers towards urban areas may also bring about unemployment or underemployment and not just positive side-effects.

Urban China and Migrants

Urban China and Migrants

The number of migrant workers has increased in China since the end of 2012 reaching 262.61 million people. That was a 3.9% increase. The average salary of a migrant worker also increase by 241 Yuan (or $39.37) and reached 2, 290 Yuan per month. That was an increase in salary of 11.8% in comparison to the previous year. Migrant workers in China mostly come from agricultural backgrounds and have little or no educational skills. 1.5% of migrant workers in 2012 in China were considered by the Bureau of Statistics of China as being illiterate. Only 14.3% had finished elementary-school educational level. As a means of comparison, the monthly minimum wage for Shanghai, for example stood at 1, 620 Yuan in May 2013. The lowest monthly minimum wage was in the province of Anhui and stood at 1, 010 Yuan in May 2013. There is no fixed minimum wage for the entire country and it is different in every province according to the living conditions of each area. But, already it can be seen that the migrant workers have largely over that minimum wage (highest or lowest) in China today.

Chinese Urban Areas

Chinese Urban Areas

In 2012, the total number of people that lived in urban areas was on the up and it increased to 52% of total population. Thirty years ago it was only 20% in the largely rural and agricultural country. 60% of the migrant workers receive some sort of help today to settle in urban areas either from their employers or from the Chinese administration. However, discrimination against the migrant workers has always existed in Chinese urban areas. Reforms are currently underway to change the hukou (or household registration system), which is denied to migrant workers today and thus limits access to public services of these workers. Lack of access to health and education means that the Chinese migrant workers save. If the Chinese government wishes to transform its economy, perhaps it might be time to change the way that migrant workers in China are perceived by the rest of the urban population, since they could be the driving force behind the boost needed in economic growth today.

But, making those migrant workers become spenders and consumers means that they will have to feel secure for the future and stop saving to start spending.

See the original article >>

China Injects Cash in Bid to Improve Liquidity

By tothetick

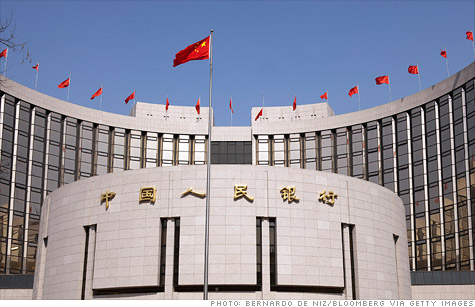
The People’s Bank of China decided to inject 17 billion Yuan ($2.7 billion) into money markets today despite having let everyone believe that they didn’t give two hoots about the way things were going, just as long as the bad credit stopped getting granted and the shadow bankers fell off the Great Wall never to be seen again. Now, it looks as if with market volatility and growing fears that the liquidity in China is in fact worse than they are letting on and that the economy is growing at under half of what they have been leading us to believe (closer to 3-4% rather than 7.5% according to some analysts), the People’s Bank of China has decided to step in and allay some of the fears at least. This is the first time that there has been a cash injection into the Chinese economy since February.

PBOC - Cash Injection

PBOC - Cash Injection

The PBOC is obviously aiming at reducing fears and avoiding liquidity problems in the banking system that were revealed in June 2013. But, the small amount that has been injected is perhaps a tell-tale sign that the PBOC is there to provide some assistance, but that ultra-loose Bernanke-style injection is not going to happen.  Some analysts are predicting however that the PBOC will continue injecting money into the markets right through August now. But the small amount of money means that the markets are being made aware that the PBOC wishes to provide just the right amount of liquidity but at the same time being able to still reign in risky lending practices in the banking sector. Short-term lending rates have been on the up over the past few weeks and the banks in China have had to keep a tight hold on their liquidity for fear of not having enough to make dividend payments and to sort their accounts out by the end of the month. The PBOC has played it very cool hinting at the fact that they would step in only if necessary to provide assistance in the event of cash levels dropping, but there were relatively few statements being made. Liquidity is there it might seem, but it has a price for the banks and will not be dished out by being thrown at the people from a helicopter like elsewhere in the world.

The result was that Chinese shares reversed the downward trend of the past three weeks, rebounding on the Shanghai Composite and also on the Hong Kong market. The Hong Kong Hang Seng Index stood at +0.48% (up 103.81 points to 21, 9853.96) and the Shanghai Composite reached 1, 990.06 (up 13.76 points or 0.70%).

The Bank of China (which is the 2nd largest bank in China and the 5th largest in the world in terms of market capitalization) rose by 0.62% (up 0.020 HKD to 3.260 HKD). At the end of June the Bank of China had to cut lending almost immediately and brought the lending limit down. It is up today as the cash injection takes effect. The Industrial and Commercial Bank, which also had trouble with liquidity (customers were unable to withdraw cash from ATMs at the end of June), was up today also by 0.59% (+0.030 HKD to 5.090 HKD). The Industrial and Commercial Bank is the largest bank in the world in terms of profit and market capitalization. Lending has stood at 70 billion Yuan on average since 2010 and that means that it lent to more companies and private individuals than any other bank in the world.

Some are saying that China has relied too heavily on exports in the past and also investment that is driven by credit. The economy has over-invested in property markets and industries that are no longer as profitable as they once were (car industry and electronics or textiles) due primarily to rising demands of increased wages. Yield on investments is thus dropping off. The objective is to try to avoid redundancies and bankruptcies with the credit-crises looming. But, is it going to be possible to steer clear of that?

Chinese Cash Injection

Chinese Cash Injection

Some are seeing dangerously worrying similarities between Japan of the 1980s and the 1990s and China’s situation today. Both countries primarily allowed investment to take place through the banking sector. But the banking sector only provided loans and credit to the least-risky enterprises (which were multinationals or state-owned). The solution for both countries was to free the financial sector allowing for non-bank lending. Thus, non-bank lending and bank lending increased and a property bubble ensued. Credit in China increased from 105% of Gross Domestic Product in 2000 to 187% in 2012.

But, some of the problem also stems from the fact that banks that are already experiencing tight cash flows are being encouraged to keep those that my otherwise default on repayment of loans afloat. That is stopping the cash-strapped banks from investing in new projects and viable ones that may exist. This is causing a spiraling downward effect as the banking sector enters the vicious circle of the Chinese economy’s contraction. Although there are the migrant workers that could help pull China out of that, but it must be remembered that the median age of rural people is now 40 years old in China and hardly the age at which those people are going to move into urban areas. In addition, half of the Chinese population already lives in an urban area today. The one-child policy has seen the drastic effect of a shrinking working population, which all put together means that there is lower consumption and also a decline in growth rates that will take place.

The cash injection of 17 billion Yuan today had the effect of boosting the banking system for at least a while. But, for how long that will last is another matter. Without structural reforms to the Chinese economy and the country in general, the road ahead will only be one of injections and more injections until the banking system is fully intravenously on a drip. Intravenous cash therapy!

See the original article >>

US Dollar Marking Time, Aussie Steals Spotlight

by Marc to Market

The US dollar is little changed against most of the major currencies as summer market awaits the week's key events that begin in earnest tomorrow. The Australian dollar is the biggest mover, dropping about 1.5% against the greenback in response to two blows: a collapse in building approvals (-6.9% vs a consensus forecast of a +2.3%)and dovish comments by the central bank governor. The OIS market is now pricing in almost certainty that the RBA cuts the cash rate next week. Further out, the market is pricing at least one more cut in the cycle.

Not only were the June building approvals weaker than expected, but the May decline was revised to -4.3% from -1.1%. RBA Governor Stevens reiterated that there was scope to cut rates after last week's CPI data and opined that the decline in the Australian dollar did not threaten the inflation outlook. Note that recent data has been soft, including a loss of full time jobs in May and June.

As a proxy for short-term interest rates, we note that the 1-year bill yield fell 9 bp and at 2.28%,appears to be a new record low. The cash rate sits at 2.75%. For its part, the Australian dollar fell to almost $0.9050. The three-year low was set on July 12 just below $0.9000.

Japan also reported disappointing data, but the dollar continues to straddle the JPY98 level. The preliminary estimate is that June industrial output fell 3.3%, more than twice the decline the consensus expected. It is the first decline in seven months and the respondents were optimistic going forward with the July forecast lifted to 6.5% from 3.3%. Nevertheless, the year-over year rate shows a 4.8% contraction from a 1.1% decline in May. This coupled with the deflation in the core measures of CPI suggest pressure may mount on the BOJ to take additional measures. In a different report, investors learned that vehicle production in Japan fell 9.5% from year ago levels in June after a 6.2% contraction was reported in May.

Meanwhile, another aspect of the creeping disappointment with Abenomics, which has seen support for Prime Minister Abe slip lower, despite the recent electoral victory, has been with consumption. Overall, household spending in June fell 0.4% year-over-year. The consensus called for a 1.4% rise. It is the second consecutive decline. Higher corporate profits has not translated into more hiring or wage increases. It is true that separately Japan reported that the unemployment rate unexpectedly fell to 3.9% from 4.1% in May, but this reflected a greater contraction in the labor force (-150k) compared with the number of employed (-10k).

Anticipation of either more BOJ measures or perhaps some measures to minimize the next April's retail sales tax hike helped fuel bargain hunting in the Nikkei after yesterday's more than 3% decline. The Nikkei recouped about half of those losses, with the oil and gas sector leading the way with a 5.4% advance. The Nikkei had gapped lower last Friday and again yesterday. Today's gains failed to enter yesterday's gap, which extends from 13954-14114.

One of the factors that may have helped lift the Nikkei and the MSCI Asia-Pacific Index (+~0.5%) was news that The PBOC injected liquidity into the banking system for the first time in five weeks and used 7-day reverse repos as the tool of injection (CNY17 bln) for the first time since February. Separately, we note that to address the earthquake region in Lushan, the PBOC has cut the required reserves for local banks by 1% and will allow mortgages in the region to be set at 60% discount to the benchmark rates.

European news has been limited.  The biggest mover has been  the Swedish krona.  A soft preliminary Q2 GDP figure has seen the krona lose almost 1% against the dollar and a little more against the euro.  Sweden reported the economy had contracted by 0.1%, whereas the market had expected an expansion of the same magnitude. 

Exports declined by 0.8% on the quarter and household consumption slipped 0.1%.  Government spending rose 0.2% and investment rose 0.1%.  The data are subject to revisions in September and it is too soon to expect a monetary policy response.  Fiscal policy is a different matter, and the Finance Minister Borg has already suggested more stimulus next year. 

The euro move toward SEK8.69 and has been held in check by a downtrend off the June 24 high (~SEK8.8990) and July 8 high (~SEK8.8165).  The immediate euro buying exhausted itself, but pullbacks should be limited to the SEK8.64-SEEK8.66 area near-term. 

Separately, we note that Spain reported Q2 GDP.  At -0.1% it was in line with expectations as was the EU harmonized CPI of 1.9% (down from 2.2% in June).  Meanwhile, market awaits the Italian Supreme Court's decision on Berlusoni's final appeal on tax fraud charges.  It is not clear that a final decision will be made today, but it is possible. Upholding Berlusconi's conviction may spur some political uncertainty as some of the center-right members of parliament have threatened to withdraw support for the Letta government. 

In the US, the two-day FOMC meeting begins and, the only data of note is the CaseShiller house price index.  A further modest rise is expected.  Tomorrow brings the first estimate of Q2 GDP (and revisions to include research and development and copyrights as investments) and the ADP estimate of employment, as well as the FOMC statement.

See the original article >>

A Flow From Bonds to Gold

by Greg Harmon

Money has been moving out of Bonds but many suggest that it is not yet flowing into anything but cash. That could easily be an interim step for the summer. “Hey broker dude, just sell the bonds before they collapse and we will talk about what to do with it after I close the Hampton’s house. And can you get me into Stevie’s next party?”

But the ratio chart of Gold ($GC_F, $GLD) to my bond proxy, $TLT, the 20 year US Treasury ETF, suggests flow may be occurring right now. Take a look. Over the last 3 months this ratio has been trading in a channel between a ratio of 10.80 and 12.50. Signs point to the strong possibility that it put in a double bottom in this channel and is ready to move higher. As

gold tlt

it consolidates at the top of the channel, the Relative Strength Index (RSI) is rising to new highs and bullish while the Moving Average Convergence Divergence indicator (MACD) is also rising. Both support a push higher. The ratio itself is stepping higher and over the 100 day Simple Moving Average (SMA). The Measured Move (MM) on a break over the top of the channel takes it to the 13-13.25 area. At the low end of that is a 4% rise in Gold in terms of bonds or a 4% fall in bonds relative to Gold. That is worth trading.

See the original article >>

Follow Us