Saturday, July 13, 2013

Corn, soybeans retreat as record U.S. crops seen boost supplies

By Jeff Wilson and Whitney McFerron

Corn fell the most this month and soybeans posted the biggest drop since March on signs of ample global supplies as U.S. farmers rebound from last year’s drought with record crops in 2013. Wheat also declined.

Stockpiles of corn in the U.S., the world’s top grower, will more than double to 1.959 billion bushels by the start of the 2014 harvest, the U.S. Department of Agriculture said yesterday. The agency also reduced its outlook for global demand, which will fall short of production. Soybean reserves in the U.S. also will double, boosting world stockpiles by 20% to a record 74.12 million tons, USDA said.

“We continue to expect a significant recovery in U.S. corn and soybean production and lower prices” in the second half of 2013, Damien Courvalin, a New York-based analyst at Goldman Sachs Group Inc., said in an e-mailed report. “Our expectation for lower prices also reflects the already realized large South American harvest and current weakness in global demand.”

Corn futures for December delivery, after the harvest, fell 3.4% to close at $5.0925 a bushel at 1:15 p.m. on the Chicago Board of Trade, the biggest drop for the most-active contract since June 28. For the week, prices gained 3.7% amid earlier concerns that warm weather in parts of the U.S. may hurt crops. Last year, corn rallied to a record $8.49 in August, as the drought cut output by 13%.

Soybean futures for delivery in November dropped 2.6% to $12.5725 a bushel on the CBOT, the biggest decline since March 28. The most-active contract was up 2.4% for the week.

Beneficial Weather

Prices also fell on speculation that warm, sunny days and cool nights during the next week should help to boost yield potential for corn and soybeans in most of the Midwest, Jerrod Kitt, the director of research for the Linn Group on Chicago, said in a telephone interview.

Temperatures the next 10 days will be near normal for most of the Midwest, with rain developing by the end of next week to aid crop development, especially in portions of the driest areas of Nebraska, western Iowa, Missouri and Kansas, T-Storm Weather LLC said in a report today.

“There is nothing in the weather forecasts that is threatening to crop development across the northern and eastern Midwest,” Kitt said. “Corn yields are angling higher.”

Also in Chicago, wheat for September delivery declined 0.3% to $6.81 a bushel, halting a four-day rally. Prices gained 3.2% this week on increased Chinese demand for U.S. supplies and shrinking global production.

Yesterday, the USDA cut its forecast for global wheat inventories to 172.38 million tons, 4.9% smaller than estimated in June, amid rising demand in China. U.S. export sales jumped to 1.47 million tons in the week to July 4, more than double a week earlier, with China buying 1.02 million tons, according to a separate USDA report.

See the original article >>

Portugal Crisis: Will Contagion Make a Comeback?

by Pater Tenebrarum

Crisis Conditions Return

The political crisis in Portugal has received fresh impetus when the country's president Anibal Cavaco Silva decided to reject the government's plan to 'heal its internal rift'. By calling for early elections next year, he is now accused by critics to have ignited a 'time bomb'. As is well known by now, too much democracy isn't  good for EU bailout regimes tied to austerity.

“Portugal's president has thrown the bailed-out eurozone country into disarray after rejecting a plan to heal a government rift, igniting what critics called a "time bomb" by calling for early elections next year.

President Anibal Cavaco Silva proposed a cross-party agreement between the ruling coalition and opposition Socialists to guarantee wide support for austerity measures needed for Portugal to exit its bailout next year, followed by elections.

The surprise move came just when conservative prime minister Paolo Passos Coelho thought he had overcome a cabinet crisis by reaching a deal to keep his centre-right coalition together. The decision was a warning shot to all mainstream parties indicating the conservative president does not think any of them is capable of ruling effectively until the EU-IMF bailout is due to expire in June.”

(emphasis added)

This has promptly emboldened the socialist opposition to demand a 'renegotiation of the bailout terms'. It seems the former austerity 'model student' Portugal is going to throw a spanner into the works – just prior to elections in Germany to boot, which will make any changes to the bailout conditions a hard sell indeed.

“The opposition Socialists demanded a renegotiation of Portugal's bailout terms on Friday, raising a hurdle to a cross-party pact the president says is needed to end the euro zone country's dependence on international funding next year.

Prime Minister Pedro Passos Coelho and Socialist leader Antonio Jose Seguro said they are ready to discuss a deal, but analysts say their divergence on painful austerity policies linked to the bailout could make it hard to resolve the crisis.

"We have to abandon austerity politics. We have to renegotiate the terms of our adjustment program," Seguro told parliament. "The prime minister has to recognize publicly that his austerity policies have failed."

The political turmoil has already forced Lisbon to request a delay in the eighth review of the bailout by its creditors, initially due to start on Monday, until the end of August or early September. The delay drove up yields on Portuguese government bonds, which move inversely with prices, with 10-year yields surging 90 basis points on Friday to 7.87 percent.”

(emphasis added)

As always, the main problem is what the alternative to 'austerity' is supposed to consist of. To state that 'austerity has failed' is not enough. After all, the government is definitely insolvent. It cannot resume deficit spending on a grand scale. The problem with EU style austerity in fact isn't that governments are cutting their spending. It is the failure to implement truly wide-ranging economic reform and the failure to actually shrink government. Instead of giving the market room to breathe, governments have raised taxes so as to keep their 'share of the pie' unchanged. Spain's government is incidentally currently well on its way to intensifying precisely this mistake.


Portugal, 10 year yield, 30 min10 year government bond yield of Portugal, 30 minute chart: back to recent highs – click to enlarge.


Portugal, 10 year yield, daily

10 year government bond yield of Portugal, daily chart. This does not inspire much confidence at present – click to enlarge.


It should be remembered here that the former socialist government originally applied for a bailout from the EU when 10 year Portuguese government bond yields first reached 8.4%. Current yields are not very far away from this level and are definitely too high to allow the government to finance itself in the markets. At current yields, it would immediately enter into an unstoppable debt spiral.  Not surprisingly, Portugal's stock market is under pressure again as well:


PSI-20After a brief bounce, the PSI 20 in Lisbon has turned down again – click to enlarge.


The Danger Beyond Portugal

We haven't seen this discussed anywhere in the mainstream financial media yet, but we suspect that sooner or later, the question will come into focus: namely what a renewed crisis in Portugal could mean to Spain and specifically Spain's floundering banks.

Below is a (slightly dated) overview of the exposure of various banking systems in Europe to Portugal. Spain's banks have exposure amounting to nearly € 70 billion, which is by far the largest in all of Europe.

In short, it is the danger of contagion that should actually be the biggest worry here. Spain's banks have already so many problems that they really don't need yet another headache.


Spain's exposure to Portugal

Bank exposure to Portugal by country and type of debt, via Scott Barber of Reuters.


Among the crisis-stricken euro area countries, Portugal is in the top three in terms of official unemployment rates and its economy continues to be under great pressure. A return of outright crisis conditions could conceivably push numerous marginal borrowers over the edge.


EZ-unemployment

Unemployment in Portugal is at almost 18%, mirroring the weakness of its economy.


As Ambrose Evans-Pritchard writes, the 'wheels are coming off' again in the euro area periphery:

“The Portuguese press is already reporting that the European Commission is working secretly on a second bail-out, an admission that the wheels are coming off the original €78bn EU-IMF troika rescue.

This is a political minefield. Any fresh rescue would require a vote in the German Bundestag, certain to demand ferocious conditions if this occurs before the elections.

Europe’s leaders have given a solemn pledge that they will never repeat the error made in Greece of forcing an EMU state into default, with haircuts for banks and pension funds. If Portugal needs debt relief, these leaders will face an ugly choice.

Do they violate this pledge, and shatter market confidence? Or do they admit for the first time that taxpayers will have to foot the bill for holding EMU together? All rescue packages have been loans so far. German, Dutch, Finnish and other creditor parliaments have never yet had to crystallize a single euro in losses.”

(emphasis added)

We would add that there is yet another danger waiting in the wings that hasn't received much attention yet: what if the EU's new bank resolution process is put to the test? We suspect that even the slightest whiff that Cyprus style 'haircuts' could be in store for bank depositors anywhere else in the euro area periphery would immediately reignite capital flight from the periphery to the center. The Euro-Stoxx bank index is already poised rather precariously just above an important lateral support level. If it breaks below it, it will probably signal that a full-scale crisis is about to be reignited.


Euro-Stoxx banksEuro-Stoxx Banks, weekly: poised precariously just above a support level – click to enlarge.


Conclusion:

As always, it is not just about the isolated case of a relatively small country getting into trouble. The interdependence of banks in the euro area almost ensures that contagion will spread unless the flare-up of crisis conditions in Portugal is quickly brought under control again. Keep in mind that the ECB's 'OMT' promise does not extend to countries like Portugal that have already lost market access. It seems that the times are about to become 'interesting' again, possibly in a hurry.

See the original article >>

Bull Symmetrical Triangle

By Tothetick Education

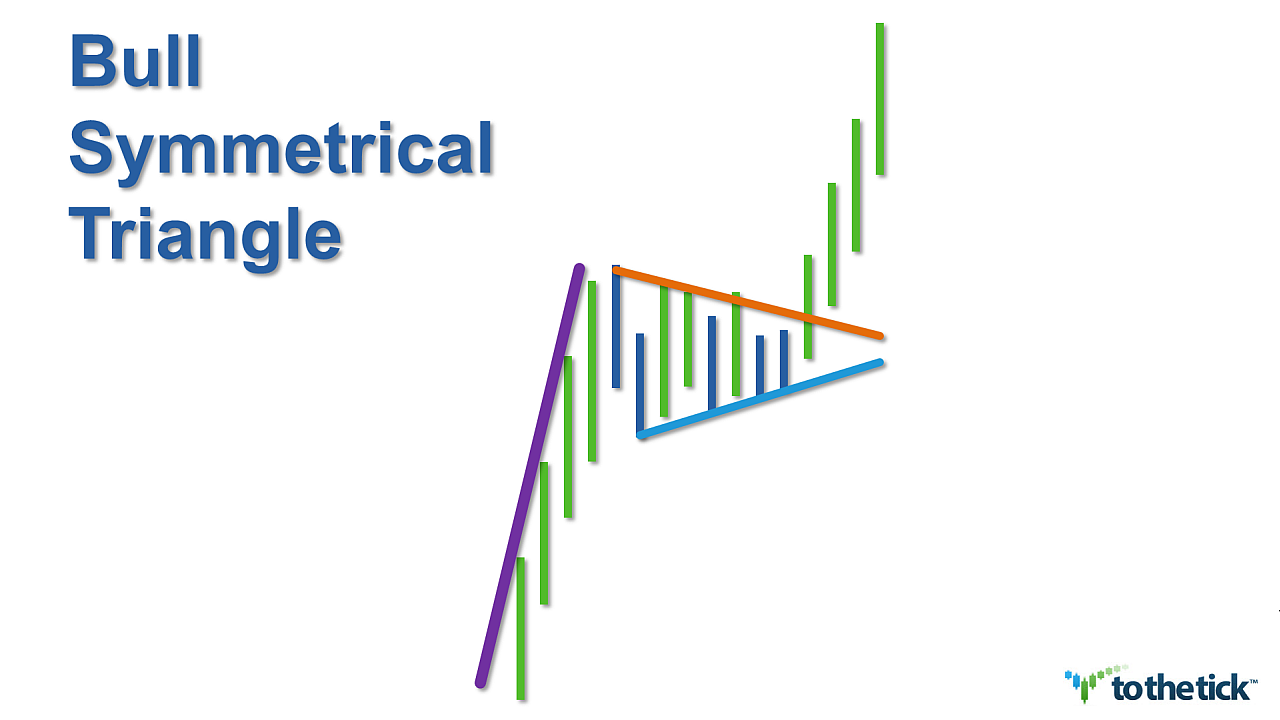
The Symmetrical Triangle as a price pattern is fairly common as it presents frequently in all markets, time frames, & price ranges and tends to provide a great reward-to-risk ratio when traded with a clear trend bias. Their versatility has made Symmetrical Triangles available as either a bullish or bearish trend continuation pattern or a reversal pattern depending on the trading environment in the background.

Visually the Symmetrical Triangle is characterized by a series of higher lows & lower highs. The shape of the Symmetrical Triangle is altered by the slope of the descending resistance line & the slope of the ascending support line which is ‘converging’ or; inclining toward each other.

Symmetrical Triangles vary in their duration & are often quite large which diminishes their momentum & represents indecision. They will have at least two swing highs and two swing lows in price. Traders should be prepared to adjust the trendlines as needed with additional swings. Volume usually diminishes as the pattern develops because traders become more & more unsure as to the market’s future direction. Symmetrical Triangles are considered neutral & often appear aimless in direction as the range-bound price action is balanced between buyers & sellers exhibiting similar strength. Eventually prices squeeze to an Apex. The closer to the apex price gets the odds for a breakout of the immediate price range become more likely.

Traders can look to trade the Symmetrical Triangle in numerous similar methods regardless of market environment but with several nuances can ‘stack the deck’ which increases the risk-to-reward ratio for profits. One of the best Symmetrical Triangle performers statistically is the bullish continuation pattern seen in an uptrend.

The bullish continuation pattern has 3 phases:

1) Background: A Strong impulsive, thrusting action with a surge in volume & price establishes a clear picture of the controlling bullish trend direction. In our symmetrical triangle price pattern it is represented visually by a Pole. Higher and more drama the better as the Pole is the Key to recognizing the potential for the continuation of the pattern. The Pole represents trend direction as well as its strength & often this pattern is initiated as a new breakout in price from an established bullish base of support.

2) The second phase is a pause for consolidation of the action both in volume & price and is represented by the symmetrical triangle. As traders we like to see this phase very short in duration with only 2 or 3 swings while our price action is range bound maintaining the higher lows & lower highs shape and the volume is ‘resting’. The best breakouts occur at 50-75% of the triangle completion. Caution if the breakout is delayed until prices crowd into the apex as it is an indication of ‘balance’ or indecision between buyers & sellers.

  • regardless of trend direction a Symmetrical Triangle will have higher lows & lower highs & this description also applies to a Pennant price pattern.
  • typically the difference between a Pennant & a Symmetrical Triangle is the size or duration of the consolidation phase. Pennants are usually shorter in duration & therefore 'stubby' in appearance.

3) The pattern confirms as a bullish continuation pattern if the action creates a new bullish breakout with a surge again from the bulls in both volume & price. The immediate upper resistance outlined by the symmetrical triangle is the area traders look to see confirm the breakout. Typically the action will mimic the volatility & energy experienced with the Pole creation. Since the symmetrical triangle represents neutrality it is highly recommended to pay close attention to the volume after the breakout as an aid in recognizing further potential for the pattern. With large patterns where the momentum has been somewhat ‘dampened’, re-tests of the apex &/or breakout price are common before the trend can continue.

Options for Trading the Symmetrical Triangle as a bullish continuation pattern:

There are two methods of trading this pattern and it depends on your trading style.

Aggressive traders will enter long trades right around the support trendline once sufficient support has confirmed. The concept is that the trend is on your side and the bulls are maintaining and pushing a higher level of support as evidenced by the slope of the line.

This is a very accurate trade that usually has a great risk:reward ratio. Stop placement can be fairly tight right below support & can be adjusted upward accordingly. Note there is a ‘mid-line’ created using the apex as the measurement & traders can gauge success of the immediate swing based on this incremental value. When price approaches the upper resistance line you should gauge the momentum: if you see that the momentum is strong stick to the position. However, if you see that resistance prevails, close the trade & take your profits to maximize the reward.

The aggressive trading method can highly increase the profit potential of any triangle, as you can trade the same pattern several times & profit from the ranging swing movements inside the pattern. However, remember that as a trend continuation pattern traders want this consolidation triangle formation to be relatively brief. Two or 3 swings may turn into more with this triangle but the 50-75% formation concept aids trade consideration.

Conservative traders will enter a trade once the upper resistance line has been broken &/or the new breakout has confirmed.

False breakouts do happen and confirmation needed is always a traders’ choice. Several methods that apply here for either intrabar &/or close bar options offered in sequence: breakout above resistance price, retrace holds line, price clears breakout swing high price, price clears swing high price of triangle, larger chart combination.

Stop placement considerations can be aggressively raised after the breakout of the price.

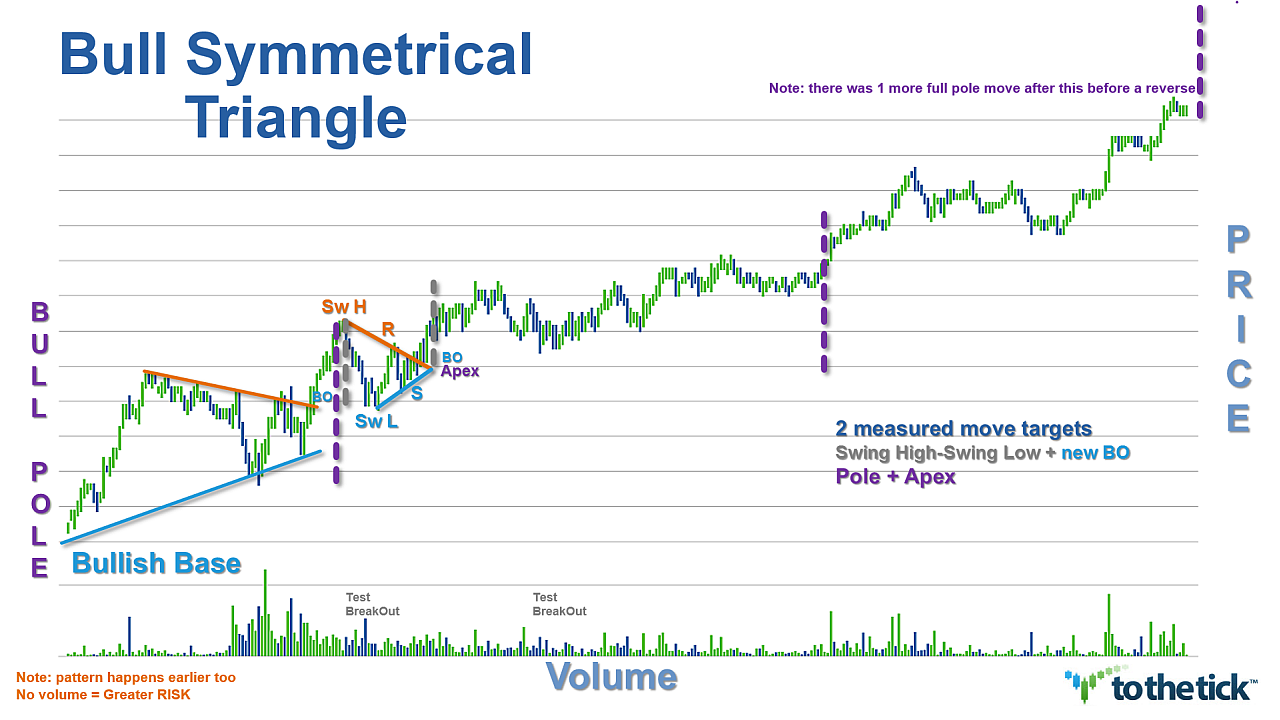
Measured Move Targets based on structure of Pole & the Bull Symmetrical Triangle

Aggressive with Momentum & Volume: duplication of the original move or trader choice measurement of the Pole:

  • Pole measure (added to) Apex or BreakOut price = target
  • Pole measure = (Pole Tip price (minus) Pole Base price)

Conservative:

  • Symmetrical Triangle measure (added to) Apex or BreakOut price = target
  • Symmetrical Triangle measure = (swing high price of triangle (minus) swing low price of triangle)

Example Symmetrical Triangle as a bullish continuation pattern:

bull sym tri May 31  2m ex 2 2

Bull Symmetrical Triangle

See the original article >>

Fed’s Bullard opposes tapering of QE amid slowing inflation

By Steve Matthews and Aki Ito

Federal Reserve Bank of St. Louis President James Bullard, who dissented for the first time last month over the issue of defending the Fed’s price goal, said the central bank shouldn’t trim its monthly bond purchases until inflation accelerates toward its 2% target.

“Pulling back on accommodation as inflation is sinking is not the right combination,” Bullard, who votes on monetary policy this year, said today in a Bloomberg Television interview with Michael McKee to air July 15. “I’d like to see us do more” to ensure inflation doesn’t continue to slow.

Bullard last month dissented against a pledge by the Federal Open Market Committee to maintain its $85 billion in monthly bond buying, saying the panel should “signal more strongly its willingness to defend its inflation goal in light of recent low inflation readings.”

Inflation as measured by the personal consumption expenditures price index rose 1% for the year ending May, below the central bank’s 2% goal.

Price gains have been “very low,” Bullard said today. “I’d at least like to see inflation tick up a little or get some kind of reassurance” that it “will come back toward our target.”

Bernanke’s Timetable

Chairman Ben S. Bernanke said on June 19 that the FOMC may taper bond purchases later this year and end the program around mid-2014 as long as the economy performs in line with the Fed’s forecasts. About half the 19 participants on the FOMC favor ending the program by year’s end, according to meeting minutes released this week.

Philadelphia Fed President Charles Plosser, who has opposed the Fed’s current round of asset purchases, said today the central bank should begin trimming monthly bond buying in September and end the unorthodox stimulus by year-end.

“I don’t want to do it all at once, but I think we should begin to taper very soon and hopefully end it by the end of this year,” Plosser said today in a separate Bloomberg Television interview to air on July 15. “That would be a healthy thing for the economy. We can do it gradually,” Plosser said.

Plosser, who doesn’t vote on monetary policy this year, has repeatedly spoken out against additional easing by the Fed.

In a speech to the Global Interdependence Center in Jackson Hole, Wyoming, Bullard said a recent surge in U.S. Treasury yields may stem from “increased optimism” about the economic outlook, adding that forecasts for growth have proven too optimistic during the past several years.

Improving Markets

Positive indicators include improving real-estate markets, rallying equity markets, a “subdued” European sovereign debt crisis, less U.S. “fiscal brinksmanship” and households improving their financial balance sheets, Bullard said in remarks prepared for the speech.

“However, given recent forecasting performance, we should be careful in using an optimistic forecast to justify current policy decisions,” he said. “A more prudent approach would be to wait to see if better macroeconomic outcomes materialize in the months and quarters ahead.”

In his interview, Bullard said during the June FOMC meeting “there was a little bit of slippage back to date-based guidance,” referring to setting a tentative end date for the bond buying.

Data Dependent

“To have it creep back in was something I found a little disturbing,” though Bernanke “did mitigate that” to “some extent” by highlighting that the schedule was contingent on economic reports, he said.

Bernanke said this week he favored maintaining stimulus “for the foreseeable future,” even as the FOMC has been split on how quickly it should reduce bond buying, or quantitative easing. He referred to “my good friend Jim Bullard” as he agreed the central bank should defend the inflation target when price gains slow too quickly.

U.S. stocks were little changed, with the Standard & Poor’s 500 Index falling less than 0.1% to 1,674.55 at 3:02 p.m., after a report today showed consumer confidence fell. The Thomson Reuters/University of Michigan preliminary sentiment index for July fell to 83.9 from 84.1 a month earlier. The U.S. 10-year Treasury yield rose to 2.6% from 2.57% yesterday.

“There’s a little bit of a mixed bag” on a broad set of labor market indicators, but the main employment indicators including payroll growth have improved since September 2012, Bullard said. The U.S. central bank began its third round of large-scale asset purchases in September.

Housing Strength

“The general sentiment in housing markets has turned positive,” Bullard said in the interview, prior to a planned speech to the Rocky Mountain Economic Summit. “That’s a psychological shift,” he said. “We’ll see an improving housing market going forward.”

Bullard said that the U.S. “could do better” if it had smaller and more innovative U.S. banks that regulators can allow to fail without disrupting the financial system.

“We could win the global competition if we had smaller institutions,” he said.

The St. Louis Fed president has been an outspoken supporter of open-ended quantitative easing, with no limit on the size or duration of the buying. Fed officials should vary the amount of bond purchases in response to fresh economic data, Bullard has said.

Since 2010, Bullard has expressed concern that slowing inflation could lead to deflation, or a sustained decline in prices, and Japanese-style economic stagnation. He has also said the FOMC needs to safeguard the credibility of its inflation target, defending the goal when price gains are either too high or too low.

Bullard, 52, joined the St. Louis Fed’s research department in 1990 and became president of the regional bank in 2008. His district includes all of Arkansas and parts of Illinois, Indiana, Kentucky, Mississippi, Missouri and Tennessee.

See the original article >>

Bear Flag

By Tothetick Education

The Bear Flag is considered one of several price action patterns that lead to a continuation of the bearish trend. Typically they present immediately following an impulsive move in the market & represent a short consolidation before the continuation of the trend. In general Flags are found frequently in all markets, time frames, & price ranges. They also tend to be easy to identify, very reliable & therefore, a trader favorite.

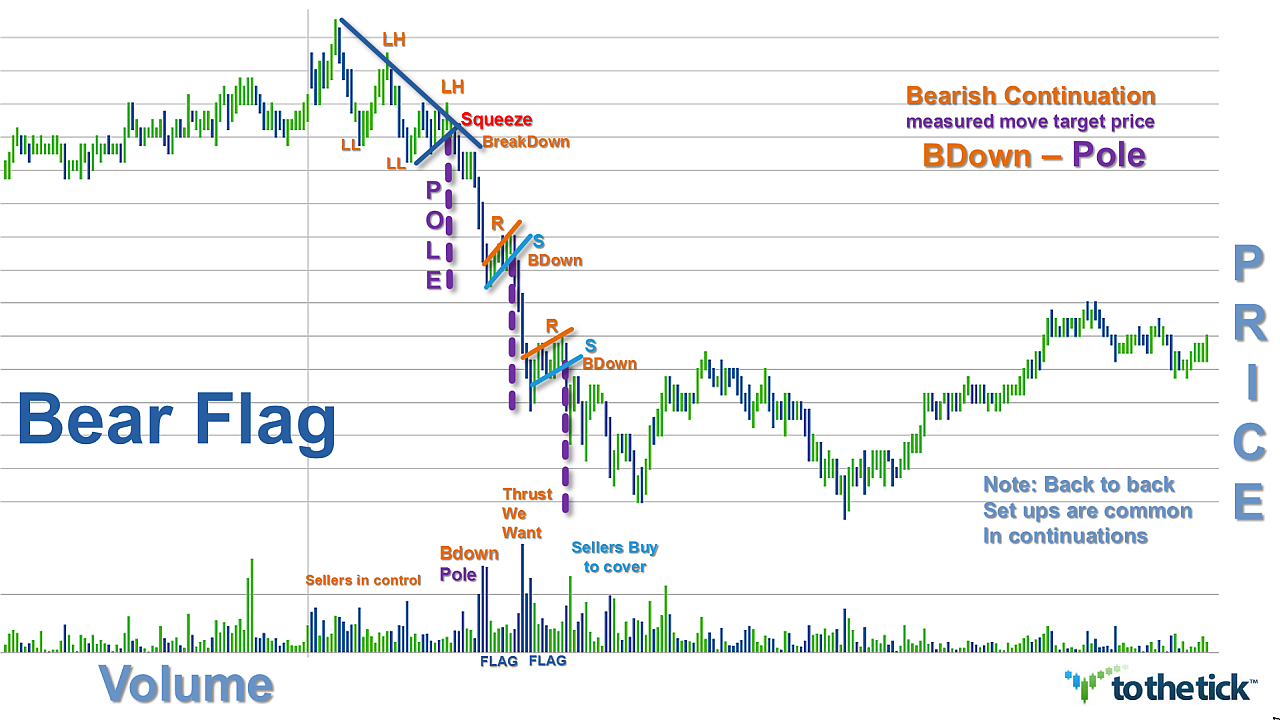
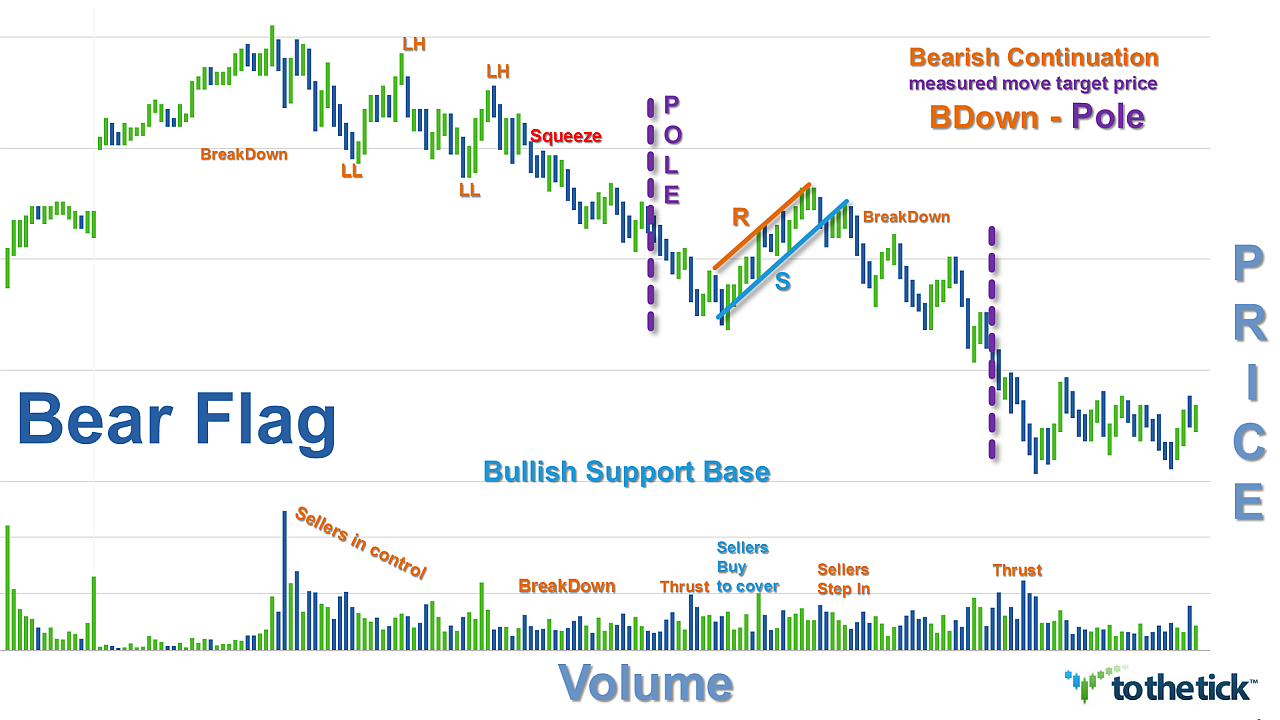
Visually Flags are a 2 part structure: a Pole with a base & a tip tilted toward price & then a small parallelogram or rectangle attached to the Pole tip facing right. In the case of a Bear Flag it looks like an up-side-down Pole with the tip at the bottom.

They are characterized with parallel or near-parallel trend lines drawn to represent the immediate support & resistance. Ideally the Bear Flag portion will be ‘tilted’ or sloped upwardly opposite of the prevailing trend direction during formation which is believed to offer traders a potential ‘edge’. However, a good Bear Flag is not limited to have a tilt as it can also be totally horizontal, or even sloped downward representing ‘nuances’ for traders to consider.

The bearish continuation pattern has 3 phases:

1) Background: A Strong impulsive, thrusting action with a surge in volume & price establishes a clear picture of the controlling bearish trend direction. This action is represented visually by a Pole with tip pointing down. Deeper & more drama the better as the Pole is the Key to recognizing the potential for the continuation of the pattern. The Pole represents trend direction as well as its strength & often this pattern is initiated as a new breakdown in price from an established area & sellers are in control. This pattern has ‘1 rule: all Flags must have a pole.’

2) The second phase is a pause for consolidation of the action both in volume & price and is represented by the Flag. As traders we like to see this phase very short in duration with only 2 or 3 swings while our price action is range bound maintaining the parallel or near-parallel shape & the volume is ‘resting’.

  • Usually the difference between Flags & Rectangles &/or Channel price patterns is their size or duration. Typically, Flags are relatively short in duration and therefore small.

3) The pattern confirms as a bearish continuation pattern if the action creates a new bearish breakdown with a surge again from the bears in both volume & price. The immediate lower support outlined by the Flag is the area traders look to see confirm the breakdown. Typically the action will mimic the volatility & energy experienced with the Pole creation.

Options for Trading the Bear Flag as a bearish continuation pattern:

Aggressive traders may trade short:

  • with each failed swing high effort on resistance: recommend wait for couple of swings
  • less aggressive option: wait for the 1st confirmed failure of price to make it back to the upper resistance line

Conservative traders will enter a trade short:

  • once the lower support line has been broken
  • once the new breakdown has confirmed

False breakouts do happen & confirmation needed is always a traders’ choice. Several methods that apply here for either intrabar &/or close bar options offered in sequence: breakdown below support price, line holds retrace as new resistance, price clears breakdown swing low price, price clears Pole tip price, larger chart combination.

Stop placement considerations can be aggressively lowered after the breakdown of the price.

Measured Move Target based on structure of Pole & the Bear Flag

Aggressive with Momentum & Volume: duplication of the original move or trader choice measurement of the Pole:

  • BreakDown price (minus) Pole measure = target
  • Pole measure = (Pole Base price (minus) Pole Tip price)

Examples Bear Flag as a bearish continuation pattern:

Bear Flags bear FLAG June21  1m 2

See the original article >>
Bull Flag

By Tothetick Education

The Bull Flag is considered one of several price action patterns that lead to a continuation of the bullish trend. Typically they present immediately following an impulsive move in the market & represent a short consolidation before the continuation of the trend. In general Flags are found frequently in all markets, time frames, & price ranges. They also tend to be easy to identify, very reliable & therefore, a trader favorite.

Visually Flags are a 2 part structure: a Pole with a base & a tip tilted toward price & then a small parallelogram or rectangle attached to the Pole tip facing right. They are characterized with parallel or near-parallel trend lines drawn to represent the immediate support & resistance. Ideally the Bull Flag portion will be ‘tilted’ or sloped downwardly opposite of the prevailing trend direction during formation which is believed to offer traders an ‘edge’. However, a good Bull Flag is not limited to have a tilt as it can be totally horizontal, or even sloped upward representing ‘nuances’ for traders to consider.

The bullish continuation pattern has 3 phases:

1) Background: A Strong impulsive, thrusting action with a surge in volume & price establishes a clear picture of the controlling bullish trend direction. This action is represented visually by a Pole with tip pointing up. Higher & more drama the better as the Pole is the Key to recognizing the potential for the continuation of the pattern. The Pole represents trend direction as well as its strength & often this pattern is initiated as a new breakout in price from an established base of support & buyers are in control. This pattern has ‘1 rule: all Flags must have a pole.’

2) The second phase is a pause for consolidation of the action both in volume & price and is represented by the Flag. As traders we like to see this phase very short in duration with only 2 or 3 swings while our price action is range bound maintaining the parallel or near-parallel shape & the volume is ‘resting’.

  • Usually the difference between Flags & Rectangles &/or Channel price patterns is their size or duration. Typically Flags are relatively short in duration and therefore small.

3) The pattern confirms as a bullish continuation pattern if the action creates a new bullish breakout with a surge again from the bulls in both volume & price. The immediate upper resistance outlined by the Flag is the area traders look to see confirm the breakout. Typically the action will mimic the volatility & energy experienced with the Pole creation.

Options for Trading the Bull Flag as a bullish continuation pattern:

Aggressive traders may trade long:

  • with each failed swing low effort on support: recommend wait for couple of swings
  • less aggressive option: wait for the 1st confirmed failure of price to make it back to the support line

Conservative traders will enter a trade long:

  • once the upper resistance line has been broken
  • once the new breakout has confirmed

False breakouts do happen & confirmation needed is always a traders’ choice. Several methods that apply here for either intrabar &/or close bar options offered in sequence: breakout above resistance price, line holds retrace as new support, price clears breakout swing high price, price clears Pole tip price, larger chart combination.

Stop placement considerations can be aggressively raised after the breakout of the price.

Measured Move Targets based on structure of Pole & the Bull Flag:

Aggressive with Momentum & Volume: duplication of the original move or trader choice measurement of the Pole:

  • Pole measure (added to) BreakOut price = target
  • Pole measure = (Pole Tip price (minus) Pole Base price)

Example Bull Flag as a bullish continuation pattern:

Bull Flag

See the original article >>

Follow Us