Friday, June 28, 2013

China Will Adjust Liquidity

By tothetick

The statement was issued through the official news agency of the People’s Bank of China, the Xinhua News Agency today. The statement went on to mention that “prudent” monetary policy would be implemented and would continue to be used, but fine-tuning would be used where and when appropriate in a bid to calm down fears that the Chinese banking system is drying up and going into meltdown. But will this be enough to alleviate the fears that have grown stronger over the past week? In particular in the light of the fact that two major Chinese banks no longer have enough liquidity deposits and have suspended their credit lines.

On Tuesday the People’s Bank of China agreed to inject money to stop the shortage that was occurring and that was already a change of attitude. Monday saw the Shanghai Composite post its biggest drop in 4 years of 5.3%. Tuesday was almost as bad with a further drop of 6%, only managed to pick that back up when the PBOC issued the statement that liquidity would be provided in the late afternoon. The Shanghai Composite rallied by 1.5% (+29.19 points to 1, 979.21) today so perhaps it has taken affect.

The People’s Bank of China is certainly playing it cool. They are very wary about injecting cash into the economy as they want to see a restriction on credit and they want the shadow banks to disappear, thus enticing the Chinese to put their money into bone fide (or banks that are controllable by the state) banks. Shadow banks include trust and insurance companies as well as pawnbrokers and informal lenders. By refusing to inject money to boost liquidity deposits, the People’s Bank of China had hoped that it would cut uncontrolled lending via the shadow banks. However, major banks are currently strapped for cash and now the statement has been issued that the PBOC will indeed aid faltering banks. This will not have the desired effect, therefore of reducing uncontrolled loans.

Shadow Banking

Shadow Banking

Shadow banks are able to raise capital from two sources, both from traditional banks and also from individuals that wish to obtain a greater yield than is being currently offered by those traditional banks. Those banks have lost out to enterprising possibilities on offer by the shadow-banking sector.

According to analysts, shadow banking is the fastest sector to grow in the financial area right now. In 2010 for a 2-year period shadow banks ended up doubling their outstanding loans and that came to a whacking 36 trillion Yuan ($5.8 trillion). In GDP terms, that represents about 69% of China’s current GDP.

Naturally, the shadow banks have little control from the state and so there business deals tend to be riskier and also they sometimes take over projects that would normally be dealt with by the traditional banking sector. That’s taking work away from the traditional banks, reducing even further their liquidity. But, if the state has little control over them, then that means when things do go really downhill, then there may be greater debt that will be popping up all over the place, further fuelling a meltdown that is already in progress.

If the People’s Bank of China has issued a statement today that they will continue to be prudent, but that they will use all kinds of tools to fine tune the Chinese economy, then all well and good. It just remains to be seen what that actually means. Prudence is a good thing, but what are the tools that are going to be used. Come on PBOC, tell us more! Otherwise if nothing is done very soon, the People’s Bank of China might actually end up taking down the sign hanging outside head office and replace it with the spheres suspended from a bar.

See the original article >>

4 Candles Create Confusion

by Greg Harmon

The major market index ETF’s have had a great start to the week. Four days of a reversal back higher has many calling the bottom in place and a run higher coming. But the close Thursday has also brought in some doubters and this is reasonable too. It all comes down to how you interpret the last 4 days Candlesticks. There are many similarities in the charts elsewhere. The Relative Strength Index (RSI) is turning back higher. The Moving Average Convergence Divergence indicator (MACD) is leveling or starting to improve. These are positives. But the move higher has come on flat or declining volume and is only now nearing the gap lower in the bodies of the candles. So that leaves the Candlesticks, and there are two different views. Lets walk through those Candlesticks one by one to see what you think.

First, for the bulls, the Russell 2000 ETF, $WIM, below. The first candlestick, a Spinning Top out side of the Bollinger bands is a good reversal candidate. The second a near doji back inside the Bollinger bands is is suspect, but does confirm the reversal in the Spinning Top. It is the next two Candlesticks, increasing in the size of their real bodies and moving up through the 20 day Simple Moving Average (SMA) that makes the bull case. These negate any doubt of the

iwm

Spinning Top and the doji. With the characteristics mentioned above this builds a bullish mosiac. The Dow 30 ETF, $DIA is pretty close to looking like this as well. Some may interpret this as a 3 Advancing White Soldiers pattern (the color on the second candle is wrong – it should be a solid black candle), which is very bullish. That may be a stretch but certainly all is well and you can lean back in your chair again. Until you look at the Nasdaq 100 ETF, $QQQ. This is a very different story, and by the way the same one the S&P 500 ETF, $SPY, is telling. It starts the same with the Spinning Top and confirmation higher with a candle back in the Bollinger bands. But then the doji’s continue and end Thursday with a

qqq

Gravestone Doji, or Shooting Star doji. This needs to be confirmed to be a reversal candle, but where is the long green body of the IWM candle? Where is the strong bullishness? This grouping with the gapping is more like an Advance Block, a weakening version of 3 Advancing White Soldiers. And this has not even made it to the 20 and 50 day SMA’s yet. So which set of candles is going to lead the market through the last day of the second Quarter?

See the original article >>

Oil is the Next Major Commodity to be Taken Down

By EconMatters

We have seen how Gold and Silver were viciously attacked by the shorts this past week, and surprisingly Oil escaped the carnage which is interesting because in April Oil was taken down to the $86 level during the last attack on the Gold and Silver markets. This is even stranger considering the fundamentals for the Oil market are even more bearish than they were in April from a supply standpoint as exemplified by the latest EIA report on Wednesday on this week. There is little doubt however that since the easy money is gleaned from the Gold attack, the Feral Hogs will start looking for their next target, and the Oil market will be high on their list in the upcoming months as the summer driving season winds down, and bulging supplies start to weigh on trader`s sentiments.

This week`s EIA report identifies the problem with the Oil market as we had refineries running at the highest utilization rate of the year at 90% and yet there still wasn`t a draw in crude supplies. There have only been like 4 or 5 draws the entire year in Crude supplies. With Oil inventories above 390 million during the strong part of the year for oil demand, what happens to supplies when the slower part of the demand cycle kicks in for petroleum products? Gasoline supplies are well above where they were last year at this time, and distillates are slightly ahead of last year`s inventory levels for this time of year. And for all that talk about added pipelines out of Cushing alleviated the Cushing Oil glut; you guessed it Cushing supplies are higher now than during this same time a year ago. This is hilarious considering the spread between Brent and WTI last year, compared to the $5 spread today. But that is the thing you have to understand about the Oil market it is one of the most manipulated markets in the world. There is just so much money to be made in the Oil business and markets that the incentives for manipulation with lax oversight are just too inviting for the large players in the industry. Take your pick either the spread should never have been $25 to begin with or it shouldn`t be $5 today because nothing has changed at Cushing Oklahoma in fact there is even more oil stuck in the Midwest so to speak which was used as the rationale for having the spread in the first place, and rhetoric for why the spread was going to go away! More lies and propaganda used to push positions for profit! The entire spread is a complete farce, take your pick it was either a farce then or it is now because having both conditions given the actual data is illogical.

The headwinds for the oil market are as follows: The entire BRIC and emerging markets commodity inspired theme has come to an end from Brazil to India to China. In fact, some emerging markets seem destined for a crash. And the biggest Oil consumer of the BRIC play China may be growing at less than 6% in real terms. You don`t have to look at China to realize how bad it is in China for growth of commodities just look at the other commodity producer countries of Australia and Brazil to see just how much China has slowed in its consumption of raw materials, i.e., the fall in Iron-ore prices. Moreover, the PMI`s coming out of China are going in the wrong direction, they aren`t getting better, they are starting to accelerate to the downside, and that was before the credit crunch of late. In addition, it appears too much past stimulus is part of the problem in China with regards to solvency issues and the shadow banking crisis that additional stimulus from the Central Planning Authorities is unlikely anytime soon.

The next headwind is a strong dollar and despite fed officials trying to talk down the dollar and bond market yields the rest of the world is in far worse shape than the United States. Emerging market and Commodity currencies are imploding against the dollar, and with the advent of the weakening Yen strategy of Japan the dollar seems destined for much higher levels. A higher dollar means commodities which are based and traded in dollars becomes more expensive, and is a bearish driver for prices.

Consumption is down in the biggest user of petroleum products the United States while the emerging economies like China and India are really struggling economically which is needed to offset the draw in US consumption. This is the real reason the Brent – WTI spread has come down with China not building a new city every month like they were in the developing phase, India in the midst of a recession, and Europe automobile sales at record lows, nobody is going to pay higher prices for oil at the global level – and Brent is considered the Oil Benchmark for international demand. And Brent under $105 tells you demand sucks internationally because if the players had their way Brent would be closer to $130.

Oil output and production is up globally, with US leading gains in the domestic US market not seen in decades. But here is the kicker for why Oil is in for larger inventory builds for the fall. The Saudi`s raise and lower production seasonally, i.e., they ship more to the US during the Driving season, and less in the Fall. But the US production is constantly rising because these are projects that are just trying to maximize production from an efficiency standpoint. So this new capacity comes to market regardless of the current supply levels or current seasonal demand patterns. You see this in the fact that we should be experiencing draws right now in Crude supplies as refinery utilization rates increase to produce more products for the seasonal driving demand. But yet we are flat or have had slight builds in Crude supplies because US production is making up the difference for season demand. The equation for the fall is the Saudi`s slow production as refinery utilization rates come down, but the US production still continues at or above the same rate and Oil supplies build with total supplies crossing the 400 million threshold.

Even the Middle East is looking less threatening for potential supply disruptions with Iran electing a much more moderate leader this time around, and an Iran attack that was thought to be a possibility is looking less likely by most of the scholars on the subject from the political think tanks analyzing the latest dynamics. It looks like there will be a deal to scale back the size of the nuclear program in Iran which appeases Israel and the United States and lifts the sanctions in Iran who need the economic boost as practical concerns have taken precedent over ideological drivers in the country`s politics.

In short, almost every argument used in the past to support higher oil prices is actually heading in the other direction. And we haven`t even touched on the fact that there seems to be a problem of deflation, and not inflation when it comes to commodities in general. All other commodities have deflated far more than Oil has, and especially if we take WTI which is up for the year, this seems like the outlier that stands out, and will be correcting in the future. The price of WTI doesn`t match the fundamentals of the rest of the commodity complex, or the fundamentals of its own supply and production levels. The real question is when will the Feral Hogs fix their sights on the WTI market, and take it down to $80 like they have the last two years. My guess now that they have had their fun with the Gold and Silver markets, they will start looking around for their next target. And the WTI price just stands out among the other commodities like a sore thumb. If they can take Gold down below $1200 on a couple of arguments, it seems there are at least five major arguments for taking WTI down to $80 in their next shark attack. Just watch out for all the I-banks coming out with their “research reports” after they are properly positioned for their takedown like we saw in Gold.

See the original article >>

Russia, Ukraine setbacks erode grain harvest hopes

by Agrimoney.com

The glowing early reports on the northern hemisphere wheat harvest turned a notch dimmer amid restated doubts over some former Soviet Union crops, and in the southern hemisphere with growing concerns for newly-sown crops in Western Australia too.

Reports on the early northern hemisphere grains harvests remain encouraging overall, as it ramps up from initial cuts in southern Russia and the US, with early results from Spain coming in strong.

Early Spanish barley cuts, an early indicator of the European Union cereals crop, "suggest excellent yields", averaging 7.5m tonnes per hectare so far in the north of the country, a major European commodities house said.

While this figure came from crops grown largely on irrigated land, "so average productivity will certainly be lower, it is a promising start for a country which has a five-year average yield of around 4 tonnes per hectare for winter barley," the commodities house said.

INTL FCStone analysts, returning from a field trip to northern Spain, reported expectations of yields of more than 8m tonnes for winter barley, with test weights "also being reported as being up on last year, at around 67 kilogrammes per hectolitre", a rise of 3 kilogrammes per hectolitre.

The strong crop prospects put Spain, a major European consumer of feed barley, on track for a "small surplus" in the grain in 2013-14 the commodities house said, flagging a potentially negative impact for exporters to the country, such as the UK which could see its "barley prices put under yet more pressure".

Former Soviet Union reports

However, while INTL FCStone also noted reports of strong rises in grain yields from the former Soviet Union so far, with Ukraine yields up 50%, some other commentators had a more negative spin.

Agritel, which has an office in Ukraine, termed the early Ukraine harvest "disappointing", saying that "spring dryness could have affected national production", while noting some setbacks in Russia too.

The agriculture ministry forecast of a 95m-tonne grains harvest, including 54m tonnes of wheat, "doesn't seems possible given the situation in the field", the consultancy said.

The beginning of harvest in the southern area of Kuban two weeks early reflects dry conditions towards the end of crop development which "could affect grains quality", cutting by 35% the amount of the local crop making milling grade, Agritel said.

"In addition, weather conditions are too cold in Siberia where plantings have been delayed.

"This could affect spring wheat quality with a drop in gluten rate", leaving "a significant part" of the crop potentially only suitable for feed use.

'Concerns surrounding ongoing dryness'

Separately, Rabobank reported "some concerns surrounding ongoing dryness" in Russia's Volga region as it slashed to 40m tonnes, from 55m tonnes, its forecast for the rise in world wheat production in 2013-14.

The bank's updated world crop estimate is in line with that from the US Department of Agriculture.

Rabobank also noted "quite mixed" reports for yields and protein from the US hard red winter wheat crop, which is broadly seen as having got off to a better-than-expected start, allowing a drop in the premium of Kansas City-traded hard red winter wheat over Chicago's soft red winter wheat.

Minneapolis-based broker Benson Quinn Commodities also reported a "wide range of protein levels" from the hard red winter wheat harvest, adding that a "few areas dealing with damp conditions".

'Some lost area'

Rabobank furthermore revealed that fears over dryness this month in Western Australia, where newly-sown crops are establishing, had hardened into reduced crop forecast.

"Australian production expectations have been trimmed due to some lost area in the eastern wheat belt in Western Australia," the bank said, in a briefing written by Australia-based staff.

Much of the Western Australia grain belt has received less than 40% of normal June rainfall, with Geraldton getting less than 10% of average levels, Luke Mathews at Commonwealth Bank of Australia said.

"The Western Australia grain belt is unfavourably dry and will stay that way for at least another week," he added.

See the original article >>

Gold Plunges

By tothetick

Gold has gone down Friday to under $1, 200 an ounce and that means it’s reached its lowest point for the past three years. Worse than that: it’s been the worst quarterly performance for gold for 45 years! But the mere mining of gold is now just under the market value of gold and this could have serious consequences for people working in that sector. Gold is almost at production cost today and if that stays there while the markets readjust, then it will be cause for concern for those working in mining.

The ‘All in Sustainable Cash Cost’ of gold, or the cost per ounce for a company to mine gold, is roughly $919. However that is for the US, where it is the cheapest to produce gold. In Africa, the level at which mining gold becomes profitable may be as high as $1, 300. The cost of gold production is broken down into the following areas:

  • $610 represents the direct cost of mining the gold.
  • $156 for mine development expenditure
  • $121 for sustaining Capital expenditure (to upgrade physical assets such as property).
  • $50 goes to gains made under currency hedging.
  • $44 administrative costs.
  • $44 goes in royalties (investors buy royalties and provide capital to the mine for future production and then they are paid back in royalties).
  • $29 for by-product credits.
  • $11 for the mine on-site exploration.
  • $26 for rehabilitation and accreditation.
  • $14 for other expenses.

Gold is most economically produced in North America, then in Europe. Africa is the most costly place to mine gold.

In some places in the world there has been a doubling in the cost of gold production over the past five years and it now stands at a world average of about $1, 000. Obviously, smaller mines are having greater difficulty in keeping up with that or will do in the future if the prices remain where they are. They may have to end up closing down. The only ones that will be able to maintain any sustained production will be the larger companies or the ones that have good cash flows and that might be able to prop themselves up for a while. There is also the added problem of the fact that fixed costs in the industry have seen a rise in recent years. Salaries, in particular have increased.

Gold has fared badly over the last quarter quite simply because of the Federal Reserve’s decision to cut Quantitative Easing by 2014. Analysts suspect, however, that it would be impossible for gold to fall further or to even go under $1, 000 an ounce as this would mean that the vast majority of mines would then turn unprofitable and definitely close. However, impossible always tends to happen right when it’s not being expected. So, will gold fall below that price of $1, 000?

Analysts also believe that the price of gold will automatically stabilize when mines go into liquidation and there are cuts in gold production. Reducing supplies of gold on to the market will lead to a rise in the price and greater stability. But, in the meantime, there will be miners that lose their jobs and mines that close leaving only the big fish to snap them up once the price of gold returns to better times.

The fall in gold prices has certainly been brought about by the end to stimulus that has been announced and which seems to be edging closer in the light of economic data revealed yesterday regarding US incomes and consumer spending, in particular. Even if the progress is tepid to say the least, it reveals that the Federal Reserve will withdraw Quantitative Easing as planned. That means that people will be leaving gold as it will no longer be just a safe haven to place your money while the economy gets back on track.

Consumer-spending data in the USA showed an increase of 0.3% in May (which was the opposite of April’s 0.3%-drop). After inflation, adjustments, spending rose by 0.2%. In the first three-months there was an increase in economic growth of 1.8%, which admittedly is not much. That’s sluggish. Consumer spending may have been helped along the way somewhat by rising prices of real estate in the USA. Given the fact that it was this which was one of the triggering factors of the financial crisis, Ben Bernanke is looking at it as a good gauge of what the state of the economy is like. This has a positive effect on consumer confidence. Average housing prices increased by 12.1% ending in April in comparison with last year. April has seen the largest monthly gain for six years (+2.5%). Housing prices are increasing perhaps some suggest due to the fact that there is a current shortage. The US population has increased by 12 million over the past 6 years, and there has been a cut in the building trade and real-estate sector regarding new homes being built. Rising house prices will mean that the economy is getting back on its feet, some will say. Incomes in the USA also increased by 0.5% and that means it was the best increase since February.

But, the President of the New York Federal Reserve Bank, William Dudley, did state yesterday that if economic growth were under what the Federal Reserve has predicted, then Quantitative Easing will more than likely continue.  Just last week, the Federal Reserve predicted a fall in unemployment to even below 6.5%, which would mean that the US was back in the boundaries of healthy. That is for 2014, which still means that it is a year ahead of what was previously predicted. March’s forecast of economic expansion in the US was raised and is now situated at between 3% or 3.5% for this year.

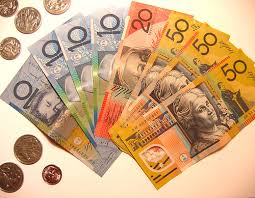
Gold falling in price has brought about a fall in the Australian Dollar also as a knock-on effect. It was down this morning to 92.76 US cents from 93.17 at yesterday’s close.

Australian Dollar

Australian Dollar

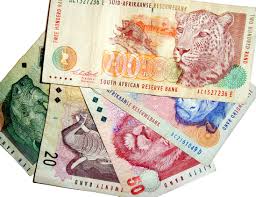
Some South African mining companies (where mining is the most costly) have already lost over $10 billion so far this year. This will bring further fears of the consequences of the future of some mines to the very forefront of their agendas. In some cases, South African mines are having also to deal with wage demands of over 60% this year. Gold prices have fallen by 25% this year.The South African Rand may also come in for a knock-on effect like the Dollar, and it is also down today by 0.26%.

South African Rand

South African Rand

So, the economy looks like it is picking up. Quantitative Easing will be withdrawn and gold will no longer be a good option.

See the original article >>

It’s Getting Volatile in Here…

By Attain Capital

There’s been so many recent events in the past couple of weeks, that it’s been hard to keep track. Let’s review: First it was Abenomics, resulting with the plunge in the Yen, then emerging markets experienced high volatility which sent stock US markets down, then a bout of selling in bonds as Bernanke signaled the end of QE. So put that all together and what do you get? Worried investors?  Sort of, but we’re not just talking about down moves – we’re talking about increased moves of all sorts. In the S&P, in Gold (ouch..again), in the Yen, in the Aussie Dollar, in 10 year notes.

In the Dow – consider the DJIA has had 12 triple digit moves this month, and at one point put in 8 in a row, from June 10th to 19th.

All of it combines to push the Vix to its highest levels of the year, and up about 81% since the March low, but you’ll also notice the VIX was down today with US stocks up.

Chart Courtesy: Yahoo Finance

But how does the VIX going down amidst a big up move reconcile with the fact that for those who go long and short – today was not less volatile, it was just volatile in another direction. As we’ve noted in a previous newsletter, while the VIX is the widely accepted barometer of volatility, it isn’t necessarily the best way to measure volatility for those who don’t just buy and hold stocks.

More importantly to managed futures participants, the VIX doesn’t do a very good job at explaining what investors are seeing in their portfolios. The fatal flaw of the VIX is that it doesn’t do a very good job of telling us what is happening when markets spike higher. Thus in order to get a better gauge of movement across markets we look to the much easier to understand average true range (ATR) calculation.  ATR has been used for decades by commodities traders, and the calculation is pretty easy to understand as well.  When calculating the ATR all we are considering are the market highs and lows for the current trading ATRsession along with the previous market close, and then averaging them across a predetermined time period. In this case, we looked back 20 days to see what the average market movement from one close to the next was.

With this view, you’ll see volatility at 1.5 year highs in stocks, gold, Yen, and 10 yr notes.

(Disclaimer:  past performance is not necessarily indicative of future results)

What’s this mean for the next 20 days, much less the rest of the year – who knows?  This could be a spike which subsides with the next bout of good economic news (or I guess… bad economic news so people think QE will come back), or it could be the start of a volatility shift to higher levels a la 2007/2008.

See the original article >>

Follow Us