Thursday, June 27, 2013

Gold prices continue to face headwinds despite being oversold

By Marcus Holland

Gold futures prices remained in a tight range on Thursday after experiencing another round of liquidation on Wednesday. Futures for gold August delivery tumbled $50 per ounce on Wednesday as traders quickly looked to exit positions as interest rates in the U.S. continued to rise and the dollar remained robust. It appears that the great short dollar trade is now coming to an end, which includes trades against precious metals such as gold and silver.

On Thursday another data point was released in the U.S. that shows inflation in the U.S. is nearly extinct. According to the Commerce Department core Personal Consumption Expenditures, which is the Fed’s favorite gauge of inflation, it increased by .1% on a month over month basis and by 1.1% on a year over year basis. Although the Fed believes that inflation expectation will increase during the second half of 2013 and the first half of 2014, levels that are well below the 2% gauge of inflation for the U.S. will not be helpful to gold futures prices.

On the spending front, which is another gauge that gold futures traders can use to determine if the yellow metal will gain traction, May’s consumer spending increased by .3% in line with expectations from a revised April number that saw a .3% decline. The net spending for the combination of the two months is zero, which is also a difficult gauge to overcome for gold bugs.

Gold position is also working against gold futures bulls. In the latest commitment of traders report released by the CFTC, hedge funds reduced their long positions in gold. According to the CFTC managed money reduced long positions by 6.8K contract while increasing short positions in gold futures contracts by 9K contracts.

The strength in the U.S. dollar has also been a headwind for gold futures prices. A climbing dollar erodes the value of products, such as gold, that are priced in U.S. dollars. The dollar has been on a tear of late as increasing long term interest rates makes the dollar more attractive. Yield on the 10-year note have climbed nearly 100 basis points over the past five weeks, moving up to 2.6%, which is the highest level seen since 2011. Higher yields reflect a strengthening economy, which has yet to be seen with the current batch of economic data. On Wednesday U.S. officials released revised first quarter data that GDP increased by 1.8% compared to the prior reading of 2.4%.

Click to enlarge.

The technical picture for gold futures prices is negative, as the commodity has broken through key support levels near $1,322 and $1,265. Resistance is now seen near former support at $1,265 and then the 10-day moving average at $1,310 (chart courtesy of Banc De Binary).

Momentum on gold futures prices is negative with the MACD generating a sell signal last week where the spread crossed below the nine-day moving average of the spread. The index is printing in negative territory while the trajectory of the index continues to move lower. The RSI on the other hand is printing near 24, which is in oversold territory and could indicate that gold might bounce in the near term.

See the original article >>

Real Disposable Income is Falling at 2008 Rates

by Graham Summers

The biggest single most important item in the GDP report yesterday was the collapse in disposable income for Americans.

Most investors will focus on the drop in GDP growth for 1Q13 and view it as opening the door for the Fed to continue with QE 3 and QE 4 without any tapering in sight.

After all, the markets have believed that bad economic news is good news for the markets for four years based on the belief that a weak economy will mean more money printing from the Fed.

However, the real issue in the BEA’s report on GDP growth was the collapse in real per capita disposable income which fell at a annualized rate of 9.21%.

That is a truly staggering collapse in incomes. The last time we say anything even close to this was in the third quarter of 2008. 

That was right after Lehman failed and the entire economy and stock market were melting down. Buckle up, things are getting worse in the US at a truly alarming rate.

I’ve been warning subscribers of Private Wealth Advisory that the economy was going to turn sharply weaker this year. It’s already begun.

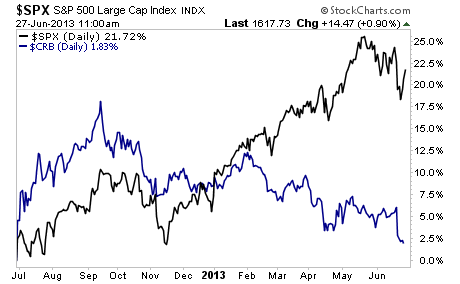
Indeed, while most investors will look at the GDP report as indicating more QE is coming, commodities certainly didn’t get that signal at all. The commodity index continues to plunge diverging wildly from the S&P 500.

One of these asset classes is completely mispricing the economy and the likelihood of more QE. Guess which one it is.

See the original article >>

Four Industry Groups You Should Still Avoid

by Tom Aspray

It was another good day for the stock market as even the downward revision of the first quarter GDP did not stem the buying. The rally has taken the major averages back to the start of stronger resistance.

The futures are higher again in early trading Thursday, and the S&P futures are now back above the 1600 level with further resistance in the 1608-1615 area. The daily technical studies have also rebounded back to resistance but do not yet show signs that the correction is over.

The McClellan oscillator has risen to -48 from its recent low of -276 and does show a pattern of higher lows. A strong move above the zero line would be an encouraging sign. The volume and A/D line analysis both need more work before they could turn positive.

The Spyder Trust (SPY) is now down just over 2% for the month but is still up 12.4% for the year so the double-digit gains for the year are still intact. It has been a much better month for some industry groups while others are acting much weaker that the S&P 500 or the SPY.

These four industry groups are among the weakest in June but are they showing any signs that they are ready to bottom?

chart
Click to Enlarge

Chart Analysis: The Dow Jones Coal Index (DJUSCL) traded as high as 184.83 last October but is currently trading down over 45% from those highs.

  • The break of support, line a, in May signaled that the downtrend had resumed.
  • DJUSCL lost 3.75% on Wednesday and is now down over 25% for the month.
  • President Obama’s comments about carbon emissions hammered an already-weak market this week.
  • The relative performance shows a longer-term downtrend and broke support (line b) in the first week of June.
  • The break of support was also confirmed by the OBV as it dropped the three-month support, line c, in early June.
  • The index is trading at the daily starc - band, and next week, the band will be at 100.20.
  • There is first resistance now in the 110-112 area.

The Dow Jones US Home Construction Index (DJUSHB) has also had a rough month. It is down over 10% this month as the fear of higher mortgage rates has cancelled out the bullish news on the housing sector.

  • The chart shows that the lower trend line support (line d) and starc- band were hit early this week.
  • As noted in a recent Trading Lesson, “if the support in the 440-446 area is broken, then the major 38.2% Fibonacci retracement support is at 405.”
  • The daily relative performance dropped below its WMA on May 20 indicating it was acting weaker than the S&P 500.
  • The DJUSHB is down 16.8% since May 29, but many of the homebuilding stocks have done even worse.
  • The daily OBV dropped below two-month support last week, line f, as the volume was quite heavy.
  • There is initial resistance at 463 with the declining 20-day EMA at 479.

chart
Click to Enlarge

It should not be a surprise that anything to do with mining or the metals has had a rough month. The Dow Jones US Platinum & Precious Metals Index (DJUSPT) is down 21.3% this month.

  • The daily chart shows a series of continuation patterns within the longer-term downtrend, line a.
  • The uptrend from the November lows (dashed line) was broken in February as it declined from 87.50 to 54.50.
  • The rebound from the April lows was broken during the first week of June (see arrow) as the April lows have now been broken.
  • The lower support, line b, is at 45, which is about 14% below Wednesday’s close.
  • The rally in the relative performance in late May and early June failed below the downtrend as the WMA was violated when support was broken.
  • As the rebound was topping in late May, the OBV just barely moved above its WMA.
  • The OBV has plunged in June and is well below its WMA
  • The declining 20-day EMA is now in the 60 area.

Another very weak industry group has been the Dow Jones Mortgage Finance Index (DJUSMF) as it is down over 10%. This was matched by the sharp decline in the REIT market, which was hit hard over fears of early Fed action.

  • The uptrend from the November and March lows, line f, has been broken though DJUSMF rebounded Wednesday.
  • There is initial resistance at 5.23 and the May lows.
  • The relative performance dropped below its WMA on June 14 and has dropped below support at line g.
  • The on-balance volume (OBV) was strong going into the early June highs before it collapsed.
  • The break through the OBV uptrend, line h, was another sign of weakness.
  • The severity of the decline indicates it will take some time before a bottom could be formed.

What it Means: In addition to these four industry groups, the mining, basic resource, and gold mining stocks are also showing double-digit losses.

The relative performance analysis for all, except the home construction index, has been weak for most of the year. Multiple time frame RS analysis can be a valuable tool for determining what sectors to invest in, as well as which ones to avoid.

As I noted yesterday, the RS analysis of the regional banking sector makes it attractive for new buying.

How to Profit. I think the correction in the Dow Jones US Home Construction Index (DJUSHB) will provide a long-term buying opportunity, but there are no signs yet that the index or any of the homebuilding stocks have bottomed. All of the other indexes should still be avoided as well.

See the original article >>

Sugar low may be forming as processors increase refining for ethanol

By Jack Scoville

SUGAR

General Comments: Futures closed slightly lower after trading higher early in the session. Data from Unica in Brazil showed that processors were refining for ethanol more than for sugar, but that there is still plenty of Sugar around. July goes off the Board on Friday. There is still talk that a low is forming or has formed for at least the short term. The Indian monsoon is off to a good start and this should help with Sugarcane production in the country. But, everyone is more interested in Brazil and what the Sugar market is doing there. Traders remain bearish on ideas of big supplies, especially from Brazil. Traders in Brazil expect big production as the weather is good. Demand is said to be strong from North Africa and the Middle East.

Overnight News: Showers are expected in Brazil, mostly in the south and southwest. Temperatures should average near to above normal.

Chart Trends: Trends in New York are mixed to up with objectives of 1770 and 1820 October. Support is at 1715, 1700, and 1665 October, and resistance is at 1760, 1770, and 1790 October. Trends in London are up with objectives of 495.00 October. Support is at 487.00, 484.00, and 478.00 October, and resistance is at 499.00, 503.00, and 508.00 October.

COTTON

General Comments: Futures were lower on currency considerations as the US Dollar moved higher. Traders are also getting ready for the export sales reports this morning and the big USDA reports on planted area tomorrow. Ideas of better production conditions in the US caused some selling interest. USDA showed that conditions in some areas got better while conditions in other areas got worse and this supported markets. Texas is reporting dry weather again. Dry weather is being reported in the Delta and Southeast as well. The weather should help support crop development in the Delta and Southeast, and could help in Texas as some areas of the state saw good rains last week. Weather for Cotton appears good in India, Pakistan, and China.

Overnight News: The Delta and Southeast will see some light showers through this weekend. Temperatures will average near to above normal. Texas will get dry weather. Temperatures will average above to much above normal. The USDA spot price is now 80.96 ct/lb. ICE said that certified Cotton stocks are now 0.596 million bales, from 0.587 million yesterday. ICE said that 221 notices were posted today and that total deliveries are now 1,426 contracts. USDA said that net Upland Cotton export sales were 57,000 bales this year and -7,100 bales next year. Net Pima sales were 10,600 bales this year and 200 bales next year.

Chart Trends: Trends in Cotton are mixed to down with no objectives. Support is at 85.10, 84.00, and 82.80 October, with resistance of 86.40, 86.90, and 88.00 October.

FCOJ

General Comments: Futures closed sharply lower as weather remains mostly good in Florida. The market was also reacting to disappointing retail demand data from Neilsen released on Tuesday afternoon. Better weather in Florida seems to be the big problem for the bulls at this time. Futures have been working generally lower as showers have been seen and conditions are said to have improved in almost the entire state. Ideas are that the better precipitation will help trees fight the greening disease. No tropical storms are in view to cause any potential damage. Greening disease and what it might mean to production prospects continues to be a primary support item and will be for several years. Temperatures are warm in the state, but there are showers reported. The Valencia harvest is continuing but is almost over. Brazil is seeing near to above normal temperatures and mostly dry weather, but showers are possible next week.

Overnight News: Florida weather forecasts call for showers. Temperatures will average near to above normal.

Chart Trends: Trends in FCOJ are down with objectives of 119.00 July. Support is at 125.00, 122.00, and 121.00 July, with resistance at 131.00, 135.00, and 136.00 July.

COFFEE

General Comments: Futures were lower on a weaker Brazilian Real against the US Dollar and also on more talk of big production in Brazil and Vietnam. The production is big, but the cash market remains very quiet. Trends in all three markets are down. Sellers, including Brazil, are quiet and are waiting for futures to move higher. Buyers are interested on cheap differentials, and might start to force the issue if prices hold and start to move higher in the short term on ideas that the market made a bottom. Brazil weather is forecast to show dry conditions, but no cold weather. There are some forecasts for cold weather to develop in Brazil early next week, but so far the market is not concerned. Current crop development is still good this year in Brazil. Central America crops are seeing good rains now. Colombia is reported to have good conditions.

Overnight News: Certified stocks are a little lower today and are about 2.749 million bags. The ICO composite price is now 113.56 ct/lb. Brazil should get dry weather except for some showers in the southwest. All areas could gt showers early next week. Temperatures will average near to above normal. Colombia should get scattered showers, and Central America and Mexico should get showers, with some big rains possible in central and southern Mexico and northern Central America. Temperatures should average near to above normal. ICE said that 0 delivery notices was posted against July today and that total deliveries for the month are now 749 contracts.

Chart Trends: Trends in New York are down with no objectives. Support is at 117.00, 116.00, and 113.00 September, and resistance is at 122.00, 123.50, and 125.00 September. Trends in London are mixed. Support is at 1720, 1705, and 1680 September, and resistance is at 1765, 1775, and 1800 September. Trends in Sao Paulo are down with no objectives. Support is at 140.00, 137.00, and 134.00 September, and resistance is at 148.00, 151.00, and 155.00 September.

COCOA

General Comments: Futures closed fractionally higher. There was not a lot of news for the market, but some are worried about dry weather developing in western Africa right now and there is a lot of smog in Southeast Asia. Ideas of weak demand after the recent big rally kept some selling interest around. The weather is good in West Africa, with more moderate temperatures and some rains. It is hotter and drier again in Ivory Coast this week, but the rest of the region is in good condition. The mid-crop harvest is about over, and less than expected production along with smaller beans is reported. Malaysia and Indonesia crops appear to be in good condition and weather is called favorable.

Overnight News: Scattered showers are expected in West Africa. Temperatures will average near to above normal. Malaysia and Indonesia should see episodes of isolated showers. Temperatures should average near normal. Brazil will get mostly dry conditions and warm temperatures. ICE certified stocks are lower today at 5.008 million bags. ICE said that 57 delivery notices were posted today and that total deliveries for the month are 205 contracts.

Chart Trends: Trends in New York are mixed to down with no objectives. Support is at 2140, 2105, and 2080 September, with resistance at 2200, 2230, and 2250 September. Trends in London are mixed to down with objectives of 1380 and 1270 September. Support is at 1440, 1420, and 1360 September, with resistance at 1470, 1490, and 1520 September.

See the original article >>

Dudley says QE may be prolonged if economy misses forecasts

By Joshua Zumbrun

Federal Reserve Bank of New York President William C. Dudley said the central bank may prolong its asset-purchase program if the economy’s performance fails to meet the Fed’s forecasts.

“If labor market conditions and the economy’s growth momentum were to be less favorable than in the FOMC’s outlook -- and this is what has happened in recent years -- I would expect that the asset purchases would continue at a higher pace for longer,” Dudley said in remarks prepared for delivery today in New York. He serves as vice chairman of the Federal Open Market Committee and has never dissented from a monetary policy decision.

Dudley also said any decision to reduce the pace of asset purchases wouldn’t represent a withdrawal of stimulus, and that an increase in the Fed’s benchmark interest rate is “very likely to be a long way off.” The economy may also diverge from the Fed’s forecasts, he said.

Concerns the Fed may curtail accommodation helped push the yield on the 10-year Treasury note to as high as 2.61% this week from as low as 1.63% in May. Dudley joined other Fed policy makers this week in seeking to damp expectations that an increase in the benchmark interest rate will come sooner than previously forecast.

“Let me emphasize that such an expectation would be quite out of sync with both FOMC statements and the expectations of most FOMC participants,” said Dudley, 60, a former chief U.S. economist for Goldman Sachs Group Inc.

Stocks Rise

Stocks extended gains after Dudley’s comments, with the Standard & Poor’s 500 Index climbing 1% to 1,619.80 at 10:41 a.m. in New York. The yield on the 10-year Treasury note fell to 2.51% from 2.54% late yesterday.

Reports today showed that consumer spending rebounded in May following the largest drop in more than three years, first- time claims for unemployment benefits fell last week and a gauge of consumer confidence climbed to the highest level since January 2008.

Dudley repeated Fed Chairman Ben S. Bernanke’s plan for a reduction in the pace of bond purchases should the economy perform as the Fed expects. He said the Fed may start to pare the current $85 billion monthly pace later this year and end the program around mid-2014.

Dudley spoke a day after a Commerce Department report showed first-quarter growth in the U.S. was less than forecast as a payroll tax increase reduced consumer spending.

Tug-of-War

“I continue to see the economy as being in a tug-of-war between fiscal drag and underlying fundamental improvement, with a great deal of uncertainty over which force will prevail in the near-term,” Dudley said.

A report next week from the Labor Department is forecast to show that the unemployment rate fell to 7.5% this month from 7.6%, according to a Bloomberg survey of economists. Employers probably added 165,000 workers to payrolls, down from 175,000 the prior month. The jobless rate peaked at 10% in October 2009.

Much of the decline in the jobless rate, Dudley said, is a result of workers leaving the labor force. “Job loss rates have fallen, but hiring rates remain depressed at low levels,” he said. “The labor market still cannot be regarded as healthy.”

The FOMC has said it will keep its benchmark rate close to zero as long as unemployment remains higher than 6.5% and the outlook for inflation is no more than 2.5%.

Inflation Goal

“Not only will it likely take considerable time to reach the FOMC’s 6.5% unemployment rate threshold, but also the FOMC could wait considerably longer before raising short-term rates,” he said. “The fact that inflation is coming in well below the FOMC’s 2% objective is relevant here. Most FOMC participants currently do not expect short-term rates to begin to rise until 2015.”

The timeline Bernanke laid out for tapering bond purchases was predicated on the economy growing in line with the FOMC’s forecasts. Central bankers expect growth of 2.3% to 2.6% this year, according to projections released last week. The economy grew at a 1.8% rate from January through March, down from a prior reading of 2.4%.

For the Fed’s outlook to be realized, gross domestic product would have to expand at about a 3.3% average annual rate in the last six months of 2013, according to calculations by economists at BNP Paribas SA in New York.

Stimulus Continuing

Officials speaking after Bernanke’s June 19 press conference have emphasized that the Fed will continue to provide stimulus to the economy even after the bond-buying program ends.

“This asset-purchase tapering is just slowing the rate at which we’re increasing the balance sheet,” Richmond Fed President Jeffrey Lacker, who doesn’t vote on the FOMC this year, said yesterday in a Bloomberg Television interview. “We’re not anywhere near decreasing the balance sheet yet.”

“What we’re talking about here is dialing back,” Richard Fisher, president of the Dallas Fed, said in London on June 24. “The word ‘exit’ is not appropriate here,” said Fisher, who doesn’t vote on policy this year and has been critical of the Fed’s easing policies.

See the original article >>

Stand and Deliver: How Germany Disrupted the World's Gold Market

by Jesse

Someone asked, 'why would there be a desire to do a stealth confiscation of gold from the public holdings in ETFs and private stores through price manipulation?' Who could have been assigned the task of prying bullion out of the hands of the people, and for what conceivable reason? It appears to be happening, but why?
There are any number of possible reasons. Concerns that an innovative new round of QE and money creation might create a run on the gold price is one possibility. There should be little doubt in those who look into the evidence that central bankers are quite sensitive to gold and silver as alternative currencies and reflections of their own policy initiatives.
And that is quite possible. As I have pointed out, there is some precedent for it. In 1933 Franklin Roosevelt pulled back much of the publicly held gold in the US. And after this was done, the government revalued the gold from $20 to $35 overnight, and then used the gains to recapitalize the banking system.
Although this could happen again, it does not seem likely because it flies in the face of everything the central bank has achieved by putting the US on a purely fiat money regime, the last gold ties being severed by Nixon in the 1970s. They prefer to denigrate gold, even though they still hold it, and certainly speak about it quite a bit often through their intermediaries.
There is definitely a movement to revisit the Bretton Woods Agreement that established the dollar as the world's reserve currency. The BRICs, whose economic power is ascendant, are seeking to establish a new currency for global trade that is owned by no single central bank or entangled in the domestic policies of no single country. And they wish to add gold and possibly silver to that mix. And they are in the process of acquiring substantial reserves to accomplish it.
The Anglo-American banking cartel is resisting this movement with all their diplomatic and political might. One of the sensitivities of the recent spying scandal leaks is the concern that they may be trying to obtain intelligence that could be used in these negotiations which are ongoing, very quietly behind the scenes.
But one has to ask, 'what set off the firestorm of price manipulation against gold that started at the beginning of this year?' Unless one is a shill, or naïve about markets, the market operation to knock the price of gold, and also silver, down is fairly obvious and heavy handed. They are not even trying to hide it. Traders do not dump hundreds or even thousands of contracts at market in quiet periods with any other objective than to take the price down. It really is that simple.
My initial take on this was that this was part of the 'price-setting' negotiation for gold and silver in the basket of currencies that the BRICs are developing. But that seemed a bit thin, unless it was seen as a 'last stand' against including gold and silver by making the argument that they were too volatile.
So I looked back on the chart for what I saw was the pivotal moment, and then checked the news and tried to find some event that may have served as the impetus for it. And the truth of it was staring me right in the face.
How remarkable is it that Germany, at the urging of their citizens and despite the objections of their central banks, has requested the return of its sovereign gold from its custodial storage in New York? And that the Feds said, no. You can't have it, but we will be in position to return your own property in seven years time.
What was up with that? Venezuela had recently requested its gold to be returned, and that helped to push the price of gold up to its all time high, because the request had obviously been floated before it became public knowledge.
So why couldn't Germany have the return of its own property for seven years?
Think about this. And perhaps what is happening now will become more clear. It is all a part of the credibility trap, wherein past actions of officials must be hidden in order to protect careers and ensure the orderly functioning of the status quo, even to its own eventual detriment.
Oh this is wrong? This is some weird theory? Well I admit that part of the problem is that we are left to guess what the central banks and the markets are doing with our money and property far in excess of what might be expected in democratic societies. This is the failure of regulation and oversight, and the corrupting power of big money in politics.
But, ok. If this is just some distraction, then give Germany back its gold, in full, this year.
If you wish to prove your word is good and facts are straight, give Germany back its gold.
And if you wish to restore some level of confidence in the markets, make them more transparent and open so people can conduct their business efficiently and safely without fear of being cheated and defrauded at every turn.
If you wish the trust and respect of the world, redeem what you have pledged to hold in trust.   If you have taken some actions in the past that were made in good faith and for good reasons, but are not so clearly so in retrospect, make good on them now.  Do the right thing even if it is not convenient, because it is the right thing to do. 
Prove your full faith and credit to be worthy.  Fulfill your oaths.  Tear down the wall of secrecy that divides the people from their government.
Stand and deliver.

"Oh what a tangled web we weave when first we practice to device."
Sir Walter Scott

See the original article >>

Follow Us