Monday, June 24, 2013

Hedge funds turn negative on ags, as US fears wane

by Agrimoney.com

Hedge funds turned negative on agricultural commodity prices for the first time in a month as improved US weather eased fears for corn and soybean crops, swamping a positive turn on cotton -which appears to have been a losing bet.

Managed money, a proxy for speculators, cut its net long position in futures and options in major US-traded agricultural commodities by nearly 32,000 contracts in the week to last Tuesday, according to the Commodity Futures Trading Commission, the market regulator.

Only in three out of the 13 main farm commodities - New York-traded cotton, and raw sugar and Chicago-traded lean hogs – did they turn more positive on price prospects.

And turning more negative on values has since proven, largely, to be a winning bet since, with commodities among assets hit by comments from Federal Reserve chairman Ben Bernanke last week over the withdrawal of ultra-easy US monetary policy, besides by soft Chinese manufacturing data.

'Nearly ideal weather'

Grain and oilseed prices have also been undermined by an improvement in the US weather, with the excess moisture still slowing late sowings seen as, broadly a boost to crops in the ground, and with weather models backing away from the prospect of imminent, excessive heat for the Midwest.

At Phillip Futures, Joyce Liu flagged the impact of "improving 2013 US corn crop prospects and weaker cash corn markets" on lowering prices of the grain, adding that "nearly ideal weather for developing crops" is expected in the Midwest over the next two weeks.

Soybean development too "is expected to improve as hotter and drier conditions emerge after a cool and wet spring", she said.

Paul Georgy, at Illinois-based broker Allendale, Paul Georgy, said that "wider-than-expected coverage of rain" across the Midwest over the weekend, "with warm temperatures to follow has traders convinced that 'rain is making grain'".

'Excessive rain'

"However, some areas received excessive amounts of rain over the weekend," Mr Georgy added.

North Dakota, as well as Canada, major spring wheat areas, have received excessive rainfalls, causing floods in Alberta which is forcing more than 100,000 people to flee their homes, besides prompting fertilizer group CF Industries to shut temporarily its Medicine Hat nitrogen plant.

Indeed, with wheat markets supported by ideas of Chinese buying too, beyond a 200,000-tonne order reported in France, the grain was one in which hedge funds were initially caught out by a shift to more negative positioning, with prices rebounding sharply on June 19.

However, values have continued to ease back since, depressed by the weight of supplies thrown off by the northern hemisphere harvest, and by the fall in prices of rival grain corn.

Cotton setback

Hedge funds' decision in cotton to ramp up to a historically-high 63,229 lots their net long position – the level to which long bets, which profit when prices rise, exceed short holdings, which benefit when values fall – has also proven of doubtful profitability.

While values of the thinly-traded old crop July contract are marginally higher than those on Tuesday, those of the December contract are nearly 3% down, undermined by rains which have improved crop prospects in Texas, the top US cotton-producing state, and soft imports by China.

"Fibres, owing to their discretionary demand attributes, are more susceptible to slowing economic growth than most other ag commodities," Luke Mathews at Commonwealth Bank of Australia said.

"Cotton markets are also being hurt by slower Chinese imports," which in May fell 31% year on year to 346,000 tonnes.

Profitability debate

The data come amid a debate over the extent to which agricultural commodities have lost appeal for hedge funds, with Ann Berg, a former Chicago Board of Trade director, warning over signs of a retreat.

Last week, Morgan Stanley revealed it was to close its agricultural commodities operation.

See the original article >>

The Greatest Trades

By tothetick

The top trades and who made it big.

We all knew it; but somebody has gone and brought us the proof straight from the horse’s mouth. Money makes people lie, cheat, steal and do other immoral ill-doings and now it’s official. The Journal of Organizational Behavior and Human Decision Processes has recently published (May 2013) a report (entitled “Seeing green: Mere exposure to money triggers a business decision frame and unethical outcome”, by Maryam Kouchaki and Kristin Smith-Crowe) in which people will, it turns out (surprise, surprise), double the number of lies that they tell if there is money involved. Yes, that’s right; we double the number of lies, which probably presupposes that we lie anyhow. But just that we lie more when there’s money waiting at the end of it. Pulling the wool over people’s eyes, fibbing, telling white lies; call it what you will. Immoral behavior is heightened when we can smell the greenbacks. People are more likely to flout the rules and go against morals or codes of values in society. When money is involved, people see the world through cost/benefit-ratio specs and the vision of the world changes: it becomes unethical!

Money makes you LIE!

Money makes you LIE!

Now, I don’t want people thinking I’m getting accusatory at all. Making money heightens the immoral behavior and the propensity to lie, leading to business models that are immoral. The research has proved it. But, who are the people that have made it rich? Who are the people that have made the greatest trades of all time? Would the research stick where they are concerned or are they exceptions? You decide!

Here are the top trades of all time. The ones that hit the jackpot before the rest of us hit the floor and dived for cover. The ones that struck it rich before gold had been discovered in them there hills. They are in ascending order of the money that was raked in - in bucket loads:

1. $80 million: John Templeton

John Templeton

John Templeton

Sir John Templeton of Templeton Growth Fund-Ltd investment fund. This is the guy that liked a good bet and that financed part of his studies in Law at Oxford University by playing (and winning, obviously) poker. If you had taken the bet on this guy some 50 years ago by investing $10, 000, then it would be worth just under $11 million today. He once said: “To buy when others are despondently selling and to sell when others are avidly buying requires the greatest fortitude… and pays the greatest reward”. He certainly had fortitude and reward!

How did he make $80 million? By shorting internet stocks just before the dot.com bubble bust right in the face of internet. He sold them all and netted a mint and that was before the lock-up for 6 months after the Initial Public Offering came into action stopping the sale of all stocks.

2. $100 million: Jesse Livermore

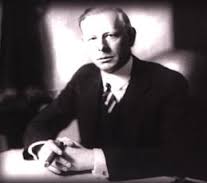
Jesse Livermore

Jesse Livermore

1929. The Stock Market Crash was the big money-maker for Livermore. But he struck gold way before then.

Livermore shorted stocks in 1906 just before the San-Francisco earthquake. It was just a taste of things to come as he netted $250 thousand. He did the same before the 1907 Panic and that brought him in four times as much. He was only just building up momentum, as he managed to rake in $100 million in 1929 by shorting the 1929 Stock Market Crash. That’s big money. Then it was enormous as people were dropping like dead flies around him. Today, if you take the Consumer Price Index as an indicator, it would be worth a whacking $1.27 billion. If you use the relative share of Gross Domestic Product, then it’s worth even more: $14 billion.

3. $100 million: Paul Tudor Jones

Paul Tudor Jones

Paul Tudor Jones

This is the guy that netted $100 million by predicting 1987’s Black Monday crash. He shorted as the Dow Jones plunged by over 22%. Paul Tudor’s hedge fund was called Tudor Investments. If you can track down a copy of ‘The Trader’ a documentary released in 1987 (which Tudor bought up all the copies of as soon as they were released), then you might learn a secret or two. Maybe it’s the fact that he had a lucky dinosaur in his office and wore a pair of tennis shoes that he bought at an auction that once belonged to Bruce Willis. He believed the market would rally by at least 30 points when he put them on. The question is raised then: why didn’t he wear them every day?

4. $100 million: Andrew Hall

Andrew Hall

Andrew Hall

In 2003, Andrew Hall saw oil as a means of striking it rich. The world had just gone through the dot.com crash and was reeling from the sufferings inflicted upon the financial markets. Oil was trading at just $30 a barrel back then. Hard to remember? By today’s standards, it’s impossible to even imagine! From the mid-1980s until about 2003, the price of a barrel of oil traded at roughly $25, in fact. It reached a peak of $147.30 in July 2008.

Hall took a bet that petrol prices would increase by threefold and reach $100 by 2008, due to shortages and petrol reserves declining. There was also heightening tension in the Middle East and speculation to blame. How was he able to predict all of that? Luck? Analysis? Who knows, but he did.

Hall made $100 million on that bet coming off. The bookmakers would have been closing down had he placed the bet down the local bookies. He could even keep the Chinese banks in flush liquidity at the moment, for a few days at least.

5. $300 million: Andy Krieger

Krieger didn’t get it all, he was working for someone else (Bankers Trust), but he still came out of it all with the tidy sum of $3 million, which would allow even the most dispendious amongst us to take retirement. How did he do it? By betting on the fact that the Dollar would plummet and people would end up dumping it big-time. 1987, just after Black Monday, people rushed into other currencies and Krieger took a bet on the New-Zealand Dollar. He struck it rich with the Kiwi and even had so many sell orders that they amounted to more than the money supply of the NZ$! The Dow Jones fell by 22.6% in one day and the Dollar fell against all major currencies around the world. But, Krieger bet on the over-evaluation of the NZ$.

The profits are questionable however, and there is probably a range of between $220 million and $300 million. Bankers Trust stated in 1988 that the fourth quarter profits had been overstated by $80 million.

6. $1 billion: George Soros

George Soros

George Soros

This is the man that was dubbed the ‘man that broke the Bank of England’. He shorted the pound, borrowed money even to end up making $1 billion. The result was that the UK government had to leave the European Exchange Rate Mechanism because it could no longer continue propping it up artificially and the pound ended up plummeting big-time. He shorted £10-billion worth.

7. $3-4 billion: John Paulson and Kyle Bass

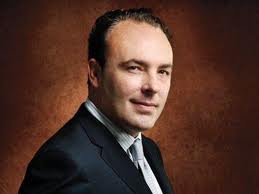
Kyle Bass

Kyle Bass

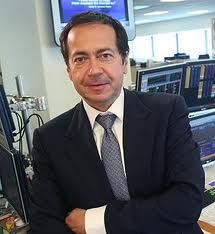
John Paulson

John Paulson

When the figures get this high, it seems hard to get the exact sum that was bagged by the guys that shorted the market crashes. John Paulson saw the sub-prime crisis coming and bet on it happening. The financial sector was buying up assets backed by sub-primes that were ready to implode and Paulson wrote credit-default swaps on them. When the market did implode, he just cashed them in.

Kyle Bass did exactly the same and made it rich with about the same amount of money.

8. $7 billion: David Tepper

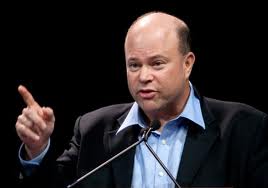
David Tepper

David Tepper

In the post-meltdown days of the financial crash, David Tepper bought up stock from depressed banks in 2009. There was enormous speculation that the banks risked nationalization, but Tepper took the risk that those stocks would rise again. That paid off. The stocks that he bought in Citigroup and the Bank of America multiplied by three or four times their value and Tepper made a mean $7 billion.

There are plenty more that might be mentioned, but these guys will go down in history as the ones that struck it rich in the end-of-the-world-is-nigh scenarios.

Trillions of dollars get traded every day, but the vast majority of the time, singling out one person is impossible. Rare are the ones that stand up to be counted just before the rest of the people on the trading floor have to pick themselves up and brush themselves down, dust and debris flying through the air around them. How many of them did it ethically? Now that’s the real question, maybe.

Unethical behavior may help you strike it rich. Unethical behavior will probably help you trample on a few people as you clamber to the top. Thankfully, there are some with a few morals left in the business world and trading on the markets. But, I’m sure someone will come up with an example of how they too were unethical at one time and trample on my own deluded ideals. If all else fails anyhow and you can’t stop the lying when the smell of the greenback becomes too strong, cross your fingers behind your back. Who knows, it may work? Or just come clean. People like a good liar that has brash, defiant, so-swagnificent bravado enough to say “yes, and so?”. Fingers crossed!

See the original article >>

Bond market big move may be looming

By Jeff Greenblatt

My biggest concern that I’ve expressed to you is about the bond market. We started teaching our clients about supply and demand imbalance points several months back. There are characteristics that lead to big moves and unfortunately I happen to have spotted such a condition on the monthly bond chart. There is the potential for a Jetstream of activity that many of us would probably call a waterfall. That doesn’t mean it has to happen but the possibility is there. I’ve characterized the long term chart as one of rally after rally with intermittent steep retracements of each rally. What that meant is that each time we got to an originating pivot; the rally took root but never really went too far without a steep retracement. It could mean a lot of things but what it probably means most of all is that we’ve never really had strong hands holding longer term with the exception of the Fed. They’ve likely propped this market up for years.

Since the demand points aren’t so great, if and when the tide ever turns the potential for an avalanche going in the opposite direction is pretty good simply because there hasn’t been enough buying interest to hold it up. This was a longer view hypothesis of mine. It appears we are ahead of schedule as far as trouble is concerned. I’ve shown you this chart before and we already in trouble.

Here’s my concern. I’ve told you the trouble is likely to be below 120 and in the vicinity of 80-90. We started above 150 and we already in the low 130s. That’s the good news. The bad news is we haven’t even come to problem area. Even Rick Santelli is getting into the act. I believe it was Thursday when he told CNBC viewers the housing recovery can stay on decent ground as long as interest rates remain stable. It’s one thing if they creep up over a long period of time. It’s quite another if the RATE OF CHANGE were to accelerate. I didn’t put it in those words but my implications looking at this chart have been exactly the same. Now look at the weekly chart.

Wouldn’t you agree that’s a beautiful looking bullish flag formation? Not anymore. It’s no wonder my projection for a higher VIX finally materialized. Stock market folks finally got the Beliebers scared out of them. Here’s another hypothesis we’ve discussed here that has worked out. It was January when the VIX was hovering around 12 and the good folks of the media were telling you the VIX wasn’t relative anymore. My take was it didn’t matter what the VIX was doing because back in 2006, the last time it was really complacent, it took about 7 months for the markets to top. My whole take on the VIX is it could cause the equity markets to drift higher but you are never going to get a sustained move with a VIX so low. Look what it took to finally wake people up. They had to get tapped on the shoulder by the Fed, see liquidity dry up in China to the point of banks seizing up and the prospects for an acceleration of interest rates right in our own back yard. Look at this bond chart. It should scare you. When we that waterfall is anyone’s guess. It could be this year; it might not happen for 2 years. But it’s definitely on the radar and it’s absolutely not a remote possibility. I happen to follow people who do historical timing not related to the stock market who are looking very seriously at the year 2015. I’m not going to get into it here because it would take pages and pages of explanation. But let me this. If we look to the 20th century as an analogy, there was a panic in 1907 and a World War 7 years later. Here there was a panic in 2008 and 7 years later takes us to 2015 and I think we can all agree the world isn’t such a friendly place anymore.

I’ve been bullish for a very long time and the market has been up for a very long time. After 1932 the market rallied for 5 years. We’ve now rallied for over 4 years. If we consider the NDX the absolute bottom of this market is November 21, 2008. Let’s just say I’m not so bullish anymore.

This was also a week where we got the payoff from a European market that failed to bounce in either of the prior 2 weeks when US markets did with decent reasons to do it. But here we are at the back end of the June 21st seasonal change point. Could we see a trading low this week? Absolutely we can because the VIX is in new territory and this has become an incredibly oversold market. We also have a condition in the Gold market where the Gann symmetry suggests it’s ripe for a turn. It can happen and we’ll know in the next couple of days. If Gold turns up then we could end up with a low for this time window.

Play along with me and consider we get a trading low in the next couple of days. Does that mean this is a BOTTOM? I would doubt it. If we do get the turn I think what we are dealing with is something more like March 2011 after the Japanese tsunami as opposed to October 2011 which was the real bottom. Some people think we had a washout and looking at some of the statistics, I’m willing to buy into that possibility. But even as we had a washout of sorts, at no time did last week feel like we were going down forever and not coming back. At the 2011 lows we were at the place psychologically where it felt like markets were going down for the count and not coming back. So what I’m looking at is not the beginning of the end, but the end of the beginning. I also happen to be of the opinion we may have the high for the year in the stock market in place.

I’d be very surprised if this week were like last week. Chances are it won’t happen again. Now if I’ve put up an uncharacteristic amount of I told you so, I’m also near the end of editing season for my 2nd edition of Breakthrough Strategies. It’s been years since I put out a book. Nobody gets it right all the time and I certainly get off course but we’ve developed a very good track record over the years and I’m coming out with a book that will open the door and teach you how to do this. The book is due out sometime in September. Just about the time the next major time windows kick in.

At the end of the day, markets are a combination of good pattern recognition, market timing and a serious grasp of market psychology. There’s a lot of bad information out there, mostly from those who get trapped by the popular sentiment of the day. Market sentiment has worked the same way since the days of Dow and will continue to do so long after we are gone. I just want to keep you on the right side.

See the original article >>

Capital Market Drivers

by Marc to Market

It may have many faces, but there is one dominant theme in the capital markets: unwinding strategic positions that have been established in the post-Lehman environment.
Prospects for the end of the third round of asset purchases in the US has provided a major spur. In addition, the dramatic reversal of Abe-inspired equity market advance and yen slide was another source of disruption. The liquidity squeeze in China, begun, perhaps by the crackdown on capital flows disguised as trade flows, and exacerbated by the PBOC's reluctance to continue monetizing what it judges to be an excessive expansion of credit may be another, even if under-appreciated, impetus for the portfolio adjustments.

Emerging markets are at the nexus. EPFR reports three consecutive weeks of outflows from emerging market bond ETFs and mutual funds. The pace of selling appears to be near record levels. The JP Morgan EMBI yield has risen above 6% and stands at its highest level since in 18 months.

Emerging market equity funds have also seen large scale liquidation. Since May 22, before Bernanke testified before the Joint Economic Committee of Congress and discussed the possibility of a reduction of long-term asset purchases, the MSCI Emerging Markets Index has fallen more than 16%, including today's 1.5% decline.

Mutual funds and ETFs tend to be dominated by retail investors. These flows do not capture the activity of the large institutional investors who invest directly in the emerging markets. Some data suggest foreign investors, excluding banks, bought $1.1 trillion of emerging market debt in the 2010-2012 period and about $220 bln of emerging market equities. The extent of the unwinding is difficult to measure. In terms of time, our sense is that some of those positions have been built up over a couple of years and we are likely to be still in the early stages of the adjustment.

We suggest that market positioning is driving prices more than a fair value model would imply. Even if, and we think that is a bigger and more important if than many observers seem to recognize, the US economy continues to recover and the risk of deflation does not grow, the Federal Reserve is not considering tightening of monetary policy. It is not thinking about hiking rates. A rate hike does not seem likely until 2015, and that assumes QE3 ends around the middle of next year.

In addition, Bernanke indicated that the Fed's balance sheet will remain larger for longer than many participants had thought. Bernanke signaled that a consensus has emerged toward not selling off the mortgage-backed securities it has purchases. There had never been talk about selling off Treasuries it had purchased. This is important because the Fed has consistently argued that the impact of its QE was not so much in the purchases, for which banks are credited with excess reserves, which lie mostly idle, but in the hold of the risk-free securities off the market.

In fact, not only is the Fed not tightening, the Fed's holding of MBS securities is one of the reasons why this may not be a repeat of its change of policy in 1994 and 2003. Convexity hedging from the mortgage security holders was a factor that helped fuel the upward spiral of interest rates then. The Fed's holdings now ensure that this pressure is reduced, though of course, not negated in full.

Moreover, in both 1994 and 2003, US inflation had begun rising and the Fed reacted. Now inflation is not rising, but to the contrary, the core-PCE measure, which we will be reminded on Thursday is near record lows.

Given the data dependence of the Federal Reserve, the market can be expected to be more sensitive to US data, especially forward looking indicators, like Tuesday durable goods orders report. Case/Shiller house prices the same day will illustrate the Fed's observation that downside risks have been reduced. Last September, when the Fed announced its was launched QE3, house prices had risen about 3% year-over-year. In May, the pace is expected to be above 10.5%. According to CoreLogic, 1.7 mln few households have negative equity in the past year alone.

The negative linkages between Japanese government bonds and US Treasuries appear to have been broken. Over the past month, US 10-year yields have risen about 50 bp while the 10-year JGB yield is essentially flat. The wider interest rate differential--now above 165 bp at a 2-year high--has also helped the dollar recoup almost 50% of the decline it is saw against the yen from late May through mid-June. Indeed, the dollar was turned lower at that retracement objective in Asia just above JPY98.70.
Recall, that the weekly MOF data shows that Japanese investors have sold the equivalent of $84.5 bln in foreign bonds and almost $46 bln of foreign equities on a net basis thus far this year. And this seems independent of any Fed tapering talking. Separately, the head of Sumitomo Life was quoted in the local press indicating that he has not desire to take on foreign exchange risk with the dollar near JPY100. Nor were Treasury yields attractive a little above 2% while the 20-year JGB at 1.6%-1.7% (actually 1.78% today) id not encourage foreign investment outflows.

Whereas Fed is contemplating reducing the pace of its accommodation, the Bank of Japan may still have to do more if its 2% inflation objective is going to be taken more seriously by Japanese institutional investors, like the Government Pension Investment Fund, the largest pension fund in the world. ECB President Draghi may not emphasize it in tomorrow's speech in Berlin, but he continues to hold out the possibility of more action.

That said, the recent data suggests a cyclical recovery is underway in the euro area, though this week's data is unlikely to shed much fresh light. Money supply growth and lending to the private sector is likely to have remained weak. The defection from the Greek coalition government and the ability to satisfy the IMF in terms of next year's funding (which may be the key to its authorization of the next tranche payment) may be more important than the region's economic data.
European leaders failed to reach an agreement over the weekend on dealing with bank failures. Germany and France were on opposite sides of the issue. Another attempt will be made later this week. Separately, the German June IFO was reportedly largely in line with the market consensus. The current assessment was a bit softer (109.4 form 110.0 in May) while the expectations component improved (102.5 from 101.6). The negativity of the long winter and severe flooding appears to be lifting.

The larger investment climate may be more important for sterling that the CBI distributive trade survey on Wednesday and the final estimate of Q1 GDP on Thursday. The yield on 10-year gilts has risen 50 bp over the past month (the same as US 10-yr Treasury yield) and this may create a window of opportunity for the incoming Governor to test the effectiveness of his forward guidance tools. News that the UK's Vodafone struck a preliminary deal to acquire Kabel Deutschland after increasing its bid to 7.7 bln euros appears to have provided an extra weight on sterling.

Separately, the UK became the first G7 country to enter into a swap agreement with China. A 3-year, CNY200 bln (~$32.5 bln) swap agreement was announced over the weekend and is seen as a necessary step toward the London being an important offshore center for yuan and yuan-denominated instruments. A little more than a dozen other countries have swap lines with China.
The PBOC made its first formal response to the liquidity crunch and in a statement dated June 17 (though posted on its web site earlier today) said there was "a reasonable amount of liquidity". The 7-day repo rate, a measure of interbank liquidity, fell a little more than 100 bp after sliding 227 bp before the weekend, to stand at a still lofty 7.32%. Chinese shares tumbled 5.4%, their biggest decline in more than three years and brings the two-week decline to 12%. The yuan fell the most in six week today, with the PBOC reducing its fix for the fifth consecutive session, the longest such streak this year.

See the original article >>

From rotation to panic - a turning point?

by SoberLook

The latest report from the ISI Group called the recent outflows from bond funds "a bit of a panic". Indeed after years of growth, the drop in fixed income funds' AUM is nothing short of spectacular.

Source: ISI Group

Some insist that this is more of a "rotation" than a panic. A possible way to settle the argument is by looking at the Credit Suisse Risk Appetite Index. One of its components is the Fixed Income Risk Appetite sub-index, which in fact just entered the "panic" mode for the first time since 2011.

Source: Credit Suisse

However, those who prefer the contrarian view of the markets will appreciate the following quote.

Credit Suisse: - A break into "panic" territory has historically been a strong signal for a turning point in the bond market, indicating that the market has become very oversold in the short run. Since the start of the index in 1995, there have been seven such signals. Six out of seven times that translated into longer-dated US bonds outperforming bills over a period of 3-6 months. In recent years, panic deeps have on average become shorter and shallower, resulting in even stronger signals.

The fundamental explanation here is that a sudden rate shock we've had can't be great for the economy. And any visible sign of renewed US economic weakness could delay the Fed's "taper", creating a bid for bonds.

See the original article >>

David Stockman: When The Fed Capitulated To Financial Hoodlums

by AuthorWolf Richter

David Stockman, Director of the Office of Management and Budget under President Reagan, made headlines recently with his pungent, excellent, and hotly debated bestseller, The Great Deformation: The Corruption of Capitalism in America. The stunning Chapter 23, “The Rant That Shook The Eccles Building: How the Fed Got Cramer’d,” may well be prescient once the imploding bond bubble takes down the stockmarket far enough. I will post the entire chapter in installments over the next few weeks. Here is the beginning of Chapter 23 (with permission):

After climbing steadily for four and a half years, the stock market weakened during August 2007 under the growing weight of the housing and mortgage debacle. Yet in response to what was an exceedingly mild initial sell-off, the Fed folded faster than a lawn chair in a desperate attempt to prop up the stock averages. The “Bernanke Put” was thus born with a bang.

The frenetic rate cutting cycle which ensued in the fall of 2007 was a virtual reenactment of the Fed’s easing panics of 2001, 1998, and 1987. As in those episodes, the stock market had again become drastically overvalued relative to the economic and profit fundamentals. But rather than permit a long overdue market correction, the monetary central planners began once more to use all the firepower at their disposal to block it.

The degree to which the Bernanke Fed had been taken hostage by Wall Street was evident in its response to Jim Cramer’s famous rant on CNBC on August 3, 2007, when he denounced the Fed as a den of fools: “They are nuts. They know nothing . . . the Fed is asleep. . . . My people have been in the game for 25 years . . . these firms are going out of business . . . open the darn [discount] window.”

In going postal, Cramer was not simply performing as a CNBC commentator, but functioning as the public avatar for legions of petulant day traders who had taken control of the stock market during the long years Greenspan coddled Wall Street. What the Fed utterly failed to realize was that these now-dominant Cramerites had nothing to do with free markets or price discovery among traded equities.

The idea of price discovery in the stock market was now an ideological illusion. The market had been taken over by white-collar financial hoodlums who needed a trading fix every day. Through Cramer’s megaphone, these punters and speculators were asserting an entitlement to any and all government policy actions which might be needed to keep the casino running at full tilt.

If that had not been clear before August 2007, the truth emerged on live TV. The nation’s central bank was in thrall to a hissy fit by day traders. In a post the next day, the astute fund manager Barry Ritholtz summarized the new reality perfectly: “I have two words for Jim: Moral Hazard. Contrary to everything we learned under Easy Alan Greenspan, it is not the Fed’s role to backstop speculators and guarantee a one way market.”

Yet that is exactly what it did. Within days of the rant which shook the Eccles Building, the Fed slashed its discount rate, abruptly ending its tepid campaign to normalize the money markets. By early November the funds rate had been reduced by 75 basis points, and by the end of January it was down another 150 basis points. As of early May 2008 a timorous central bank had redelivered the money market to the Wall Street Cramerites. Although the US economy was saturated with speculative excess, the Fed was once again shoveling out 2 percent money to put a floor under the stock market.

This stock-propping campaign was not only futile, but also an exercise in monetary cowardice; it only intensified Wall Street’s petulant bailout demands when the real crisis hit a few months later. Indeed, on the day of Cramer’s rant in early August 2007, the S&P 500 closed at 1,433. The broad market index thus stood only 7 percent below the all-time record high of 1,553, which had been reached just ten days earlier in late July.

Ten days of modest slippage from the tippy-top of the charts was hardly evidence of Wall Street distress. Even after it drifted slightly lower during the next two weeks, closing at 1,406 on August 15, the stock market was still comfortably above the trading levels which prevailed as recently as January 2007.

Still, the Fed threw in the towel the next day with a dramatic 50 basis point cut in the discount rate. Although no demonstration was really needed, the nation’s central bank had now confirmed, and abjectly so, that it was ready and willing to be bullied by Cramerite day traders and hedge fund speculators. The latter had suffered a “disappointing” four weeks at the casino; they wanted their juice and wanted it now.

Needless to say, the stock market cheered the Fed’s capitulation, with the Dow rising by 300 points at the open on August 17. The chief economist for Standard & Poor’s harbored no doubt that the Fed’s action was a decisive signal to Wall Street to resume the party: “It’s not just a symbolic action. The Fed is telling banks that the discount window is open. Take what you need.”

The banks did exactly that and so the party resumed for another few months. By the second week of October the market was up 10 percent, enabling the S&P 500 to reach its historic peak of 1,565, a level which has not been approached since then.

Pouring on the monetary juice and signaling to speculators that it once again had their backs, the Fed thus wasted its resources and authority for a silly and fleeting prize: it was able to pin the stock market index to the top rung of its historic charts for the grand duration of about six weeks in the fall of 2007. There was no more to it, and no possible excuse for its panic rate cutting.

See the original article >>

Follow Us